

Abstract
In response to the rapid spread of coronavirus disease-2019 (COVID-19) within and across countries and the need to protect public health, governments worldwide introduced unprecedented measures such as restricted road and air travel and reduced human mobility in 2020. The curtailment of personal travel and economic activity provided a unique opportunity for researchers to assess the interplay between anthropogenic emissions of primary air pollutants, their physical transport, chemical transformation, ultimate fate and potential health impacts. In general, reductions in the atmospheric levels of outdoor air pollutants such as particulate matter (PM), nitrogen dioxide (NO2), carbon monoxide (CO), sulfur dioxide (SO2), and volatile organic compounds (VOCs) were observed in many countries during the lockdowns. However, the levels of ozone (O3), a secondary air pollutant linked to asthma and respiratory ailments, and secondary PM were frequently reported to remain unchanged or even increase. An increase in O3 can enhance the formation of secondary PM2.5, especially secondary organic aerosols, through the atmospheric oxidation of VOCs. Given that the gaseous precursors of O3 (VOCs and NOx) are also involved in the formation of secondary PM2.5, an integrated control strategy should focus on reducing the emission of the common precursors for the co-mitigation of PM2.5 and O3 with an emphasis on their complex photochemical interactions. Compared to outdoor air quality, comprehensive investigations of indoor air quality (IAQ) are relatively sparse. People spend more than 80% of their time indoors with exposure to air pollutants of both outdoor and indoor origins. Consequently, an integrated assessment of exposure to air pollutants in both outdoor and indoor microenvironments is needed for effective urban air quality management and for mitigation of health risk. To provide further insights into air quality, we do a critical review of scientific articles, published from January 2020 to December 2020 across the globe. Finally, we discuss policy implications of our review in the context of global air quality improvement.
Keywords: Global pandemic (COVID-19), Air quality, Particulate matter, Ozone, Health impacts, Policy implications
Graphical Abstract
1. Introduction
In December 2019, the first case of COVID-19 caused by SARS-CoV-2 (Severe Acute Respiratory Syndrome Coronavirus 2) was reported in Wuhan City, China (Huang et al., 2020). Within a short period of time COVID-19 spread to nearly all other parts of the world and was declared a pandemic by the World Health Organization (WHO) on 11 March 2020. Globally, there have been 203,295,170 confirmed cases of COVID-19 infections, including 4,303,515 deaths as of 10 August 2021 (https://covid19.who.int/). To limit the transmission of COVID-19, many countries enforced quarantine and imposed lockdown measures, resulting in a reduction in industrial activities, transportation and human movement. Only essential industries and services were allowed to operate, leading to severe economic repercussions (Nicola et al., 2020). In contrast to the negative impacts of the pandemic on the economy and society, outdoor air quality (OAQ) was found to have improvement in many parts of the world due to reductions in the emissions of primary air pollutants from major sources such as vehicular traffic and industries. This observation indicates that air pollution can be a direct consequence of economic growth and human activities (e.g., Bao and Zhang, 2020; He et al., 2020a; Mahato et al., 2020; Piccoli et al., 2020). The unprecedented natural experiment conducted on a global scale in a controlled manner can be used to improve our understanding of changes in air quality and their causes. This scientific understanding will in turn form a basis for formulating effective environmental policies to improve global air quality by curbing emissions of air pollutants from appropriate anthropogenic sources.
Reductions in the atmospheric levels of criteria air pollutants, i.e., particulate matter (PM; PM10 and PM2.5 (PM with diameter ≤10 μm and ≤2.5 μm, respectively)), nitrogen dioxide (NO2), carbon monoxide (CO), sulfur dioxide (SO2), and ozone (O3) have been reported in many cities during the lockdown, compared to pre-lockdown periods and/or previous years. The change in air quality was studied based on measurements of these criteria air pollutants at routine fixed monitoring stations and satellite-based observations (Bao and Zhang, 2020; Collivignarelli et al., 2021; Dantas et al., 2020; Le et al., 2020; Rodríguez-Urrego and Rodríguez-Urrego, 2020; Sulaymon et al., 2021; Venter et al., 2020). Several cities, however, did not experience an obvious improvement in OAQ, with some of them even observing a worsening of the air quality. These inconsistencies in observational data might be due to variations in meteorological factors, or the role of atmospheric chemistry while having clearing skies. For example, the surface levels of O3, a secondary air pollutant, have frequently been reported to be stable or even increasing (e.g., Bekbulat et al., 2021; Nie et al., 2021; Sicard et al., 2020; Tobías et al., 2020; Zoran et al., 2020). Also, the level of secondary PM, as reported in studies investigating the chemical composition of PM, has been found to be similar or higher during the lockdown period compared to other times in a year (Huang et al., 2021b; Sun et al., 2020; Wang et al., 2021). These unexpected observations merit further investigations in the context of furthering our scientific understanding of the formation of secondary air pollutants, their transport and evolution under different meteorological conditions, their impacts on human health as well as the effectiveness of current air pollution control strategies.
The stay-at-home policies mandated by the governments around the world meant that local populations spend almost all their time in indoor environments. As a consequence, emissions of PM and volatile organic compounds (VOCs) from daily activities such as cooking, cleaning and indoor smoking can potentially expose indoor occupants to harmful levels of air pollutants (Morawska et al., 2020; Saha and Chouhan, 2020; Stabile et al., 2020). Indoor air quality (IAQ), therefore, becomes an important consideration for human health and well-being (Morawska et al., 2013; Morawska et al., 2017; Wolkoff, 2018). In a lockdown/quarantine/telecommuting situation as experienced in 2020–2021 and potentially in the future, IAQ assessment merits a serious consideration with respect to human health. However, following the outbreak of COVID-19 and subsequent lockdowns, only few studies investigated IAQ systematically (e.g., Domínguez-Amarillo et al., 2020; Guo et al., 2020; Saha and Chouhan, 2020; WHO, 2020a). There is a lack of comprehensive studies on IAQ in comparison to OAQ. Also, the role of bioaerosols, aerosols of biological origin such as metabolites, toxins, or fragments of microorganisms (Humbal et al., 2018; Kim et al., 2018) in facilitating the airborne transmission of COVID-19 indoors has been insufficiently addressed. Furthermore, air pollutants such as PM have been implicated in contributing to the severity of COVID-19 health impacts (Conticini et al., 2020; Fattorini and Regoli, 2020; Frontera et al., 2020). This is similar to findings made during the 2003 SARS outbreak in China where a positive association was observed between both acute and chronic health outcomes and the air pollution index (indicator of the levels of PM10, PM2.5, CO, NO2, SO2 and O3) (Cui et al., 2003). Exposure to high levels of air pollutants would directly affect the lung capacity to clear pathogens. Conversely, some studies suggest that after the outbreak of COVID-19, mortality reductions were achieved in countries/cities with lower levels of air pollution compared to those that are considered to be polluted (e.g., Chen et al., 2020b; Kumar et al., 2020; Son et al., 2020).
For the current review, we have considered 149 scientific articles that were published in the global domain from January 2020 up to December 2020 after the outbreak of COVID-19 in Wuhan, China (Asia), see Fig. S1. We selected these articles based on the criteria shown in Fig. 1 with more details given in the supplementary information. The review paper is structured in the following manner. Section 2 deals with the changes in OAQ in terms of sources, concentrations, chemical characteristics of air pollutants with emphasis on PM and O3 and the impact of OAQ in COVID-19 outbreaks. Section 3 provides an overview of studies that investigated IAQ and their practical significance in terms of its impact on COVID-19 transmission. Section 4 discusses the policy implications as a result of the lessons that have been learned from the scientific studies covered in this review. Section 5 provides a summary of this review and points out future research directions. We believe that this critical review of air quality studies conducted on a global scale from multi-disciplinary viewpoints will enable the recommendation of targeted environmental policies for maintaining good OAQ as well as IAQ, leading to healthy living in cities.
Fig. 1.

PRISMA flow diagram of article selection process.
2. Factors affecting OAQ and their impacts
2.1. Overview of OAQ studies
As shown in Table 1 , a number of studies were conducted worldwide in 2020 to assess the effectiveness of lockdown measures imposed in various countries/cities on urban air quality. These studies predominantly reported differences in the concentrations of criteria air pollutants, i.e., PM10/PM2.5, ground-level O3, SO2, NO2, and CO (see last column in Table 1). In general, decreases in the concentrations of the oxides of nitrogen (NOx), CO and SO2, were observed. Particularly, a large reduction in NO2 (~70%) was reported in Spain (Sicard et al., 2020) and India (Gautam, 2020; Resmi et al., 2020). Such large reductions were also reported for SO2 in Singapore (~52%, Li and Tartarini (2020)) and India (~62%, Resmi et al. (2020)) and for CO in Brazil (>30% up to 100%, Siciliano et al. (2020a)) and India (~70%, Resmi et al. (2020)). The decrease in the concentration of primary air pollutants has been mainly attributed to reduced emissions of air pollution from on-road vehicles and non-essential industries (Hudda et al., 2020; Rossi et al., 2020).
Table 1.
Overview of studies related to outdoor air quality during the COVID-19 pandemic.
| Study | Location | Type of study/method | Reference period | Air pollutants and changes observed in percent (%) during the lockdown compared to the reference period |
|---|---|---|---|---|
| Abdullah et al. (2020) | Malaysia (16 states) | Air quality monitoring station data | Before movement control order (14–17 March 2020) | PM2.5: -42.6 to –76.5 |
| Aman et al. (2020) | India | Remote sensing data | Same period of 2015-2019 | Suspended Particulate Matter: -16.8 to -36.5 |
| Barré et al. (2020) | Europe (100 locations) | Satellite data (TROPOMI), air quality monitoring station data, model simulations | Same period of 2019 (February, March, April) | NO2: +6.05% to -60.5% |
| Bekbulat et al. (2021) | USA (all states) | Air quality monitoring station data | Weeks in 2020 when the COVID-19 had little or no impact on activities | PM2.5: +3.0, O3: -4.0, NO2: -30.0 |
| Berman and Ebisu (2020) | USA | OpenAQ API | Pre-COVID-19 period (8 January 8th-12 March 2020) | PM2.5: +3.51 to -11.26, NO2: -5.52 to -26.89 |
| Chen et al. (2020a) | China (367 cities) China (Wuhan) |
Satellite data (Sentinel-5) | Before quarantine period (5 Jan to 20 Jan 20) |
NO2: -12.9 μg/m3,PM2.5: -18.9 μg/m3 NO2: -22.8 μg/m3,PM2.5: -1.4 μg/m3 |
| Chen et al. (2020b) | China (366 urban areas) | Air quality monitoring station data | 2019 | PM2.5: -14.0, PM10: -15.0, SO2: -12.0, NO2: -16.0, CO: +9.0 |
| Collivignarelli et al. (2020) | Italy (Milan) | Air quality monitoring station data | 7-20 Feb 2020 | PM10:-(45.8 to 59.4), PM2.5: -(47.1 to 47.4), BC: -71.0, Benzene: -65.0, CO: (-32.0 to -56.7), NOx: (-58.6), SO2: Unchanged, O3: +66.0 |
| Dantas et al. (2020) | Brazil (Rio de Janeiro) | Air quality monitoring station data | Same period of 2019 | PM10: 28.7 to19.4, NO2: -(24.1 to 32.9), CO: -(37.0 to 43.6), O3: +(22.5 to 63) |
| Evangeliou et al. (2020) | Europe (17 stations) | Air quality monitoring station data, satellite data, remote sensing data | Before lockdowns (2015-2019) | BC: -20.0 to -32.0 |
| Gautam (2020) | China, India, Italy, Spain, France | Satellite data (Sentinel-5P) | Before lockdowns | NO2: -30.0 (China), -70.0 (India), -30.0 (Italy), -25.0 (Spain), -30.0 (France) |
| Giani et al. (2020) | Europe, China | Air quality monitoring station data, | Before lockdowns (2016-2019) | PM2.5: -20.4 (Europe), -11.3 (China) |
| Hudda et al. (2020) | Somerville, Massachusetts, USA | Measurement campaign (CPC, Aethalometer) | Before lockdown (2012-2013, 2018-2019) | PNC: -45.0 to -69.0, BC: -22.0 to -56.0 |
| Isaifan (2020) | China (Wuhan) | Satellite data (NASA) | Before quarantine (1-20 Jan 2020) | NO2: -30.0, CO: -25.0 |
| Kanniah et al. (2020) | Indonesia (Jakarta), Malaysia (Kuala Lumpur), Singapore, Thailand (Bangkok), Vietnam (Ho Chi Minh, Hanoi), Philippines (Manila), Myanmar, Cambodia (Phnom Penh), Laos (Vientiane) Malaysia, 12 cities Malaysia |
Satellite data (Aura-OMI) Air quality monitoring stations Satellite data (Himawari-8) |
Same periods in 2018 and 2019 |
NO2: -34.0 to + 25.0 O3: +3.0 to +7.0, PM10: -26.0 to -31.0, PM2.5: -23.0 to - 32.0, NO2: -63.0 to -64.0, CO: -25.0 to -32.0, SO2: -9.0 to -20.0 NO2: -40.0 to -60.0 |
| Kerimray et al. (2020) | Kazakhstan (Almaty) | Air quality monitoring station data | Same days in 2018–2019 Same seasons in 2015–2019 |
PM2.5: -(6.0 to 34.0), CO: -49.0 NO2: -35.0, Benzene, toluene: 2 to 3 times higher |
| Krecl et al. (2020) | Brazil (Sao Paulo) | Air quality monitoring stations | Business as usual (2-10 March 2020) | NOx: -34.0 to -68.0 |
| Kumar et al. (2020) | India (Chennai, Delhi, Hyderabad, Kolkata, Mumbai) | Air quality monitoring station data | Same period in 2015-2020 | PM2.5: -(19.0 to 43.0) (Chennai), -(41.0 to 53.0) (Delhi), -(26.0 to 54.0) (Hyderabad), -(24.0 to 36.0) (Kolkata), -(10.0 to 39.0) (Mumbai) |
| Le et al. (2020) | China | Satellite data (TROPOMI) and Air quality monitoring station | Same period in 2015-2019 |
NO2: -71.9 (Eastern) PM2.5: -43.5 and O3: +25.1 (Wuhan) PM2.5: +55.1 and O3: +25.1 (Beijing) |
| Liu et al. (2020a) | China (Yangtze River Delta) | Community Multiscale Air Quality (CMAQ) model | Before the lockdown (from 1-22 Jan 2020) | PM2.5: -53.0 to -31.0, NO2: -76.0 to -45.0, CO: -46.0 to -14.0, SO2: -20.0 to +5.0, O3: +31.0 to +88.0 |
| Mahato et al. (2020) | India (Delhi) | Air quality monitoring stations | Pre-lockdown period |
O3: +0.78, PM10: -56.6 to -51.9, PM2.5: -53.1 to -32.9, SO2: -18.0, NO2: -52.7, CO: -30.4, NH3: -12.3, AQI: -61.0 |
| Mohd Nadzir et al. (2020) | Malaysia (Klang Valley) | Air quality monitoring stations, Air sensor Network AiRBOXSense | Normal days (Nov 2017 to April 2018) | PM10: +14.2 to -51.8, CO: -40.5 to -47.5, PM2.5: +41.2 to -58.9 |
| Nakada and Urban (2020) | Brazil (Sao Paulo) | Air quality monitoring station data Satellite data (TROPOMI) |
Same period in 2015-2019, Before and during partial lockdown (25 February to 23 March 2020; 24 March to 20 April 2020) |
PM10: -22.8 to +29.4, PM2.5: -29.5 to -0.3, SO2: -32.7 to +16.2, NO2: -54.3 to +9.6, NO: +29.6 to -77.3, CO: -64.8 to -29.8, O3: +31.5 to -4.3 |
| Pei et al. (2020) | China (Beijing, Guangzhou, Wuhan,) | Air quality monitoring station data | Same period in 2019 | NO2: -(28.0 to 57.0) |
| Resmi et al. (2020) | India (Kannur) | Air quality monitoring station data | Pre-lockdown (1-24 March and 10-17 May 2020) | O3: +22.0, PM10: -61.0, PM2.5: -53.0, NO: -61.0, NO2: -71.0, CO: -67.0, SO2: -62.0, NH3: -13.0, VOCs: -61.0 |
| Sathe et al. (2021) | India (Bengaluru, Chennai, Delhi, Kolkata, Mumbai, Pune) | Air quality monitoring station data | Same period in 2017-2019 | PM10: -24 to -62, PM2.5: -42 to -60, O3: -22 to -56, CO: -16 to -46, NO: -52.6 to -70.7, NO2: -46 to 61 |
| Sicard et al. (2020) | France (Nice), Italy (Rome), Italy (Turin), Spain (Valencia), China (Wuhan) | Air quality monitoring station data | Same period in 2017-2019 | O3: +2.4 to +36.4, PM10: +1.8 to -48.7, PM2.5: +10.6 to -36.3, NO: -52.6 to -70.7, NO2: -30.4 to -69.0 |
| Siciliano et al. (2020a) | Brazil (Sao Paulo, Rio De Janeiro) | Air quality monitoring station data | 16 Feb to 15 March 2020 | PM10: +20.7 to -37.7, NO2: -14.5 to -41.8, CO: -30.0 to -100 |
| Siciliano et al. (2020b) | Brazil (Rio De Janeiro) | Air quality monitoring station data | Before partial lockdown (1 to 22 March 2020) |
O3: +0.1 to +12.9 NOx: -9.2 to -48.1 NMHC: 0 to -25 |
| Son et al. (2020) | USA (10 states) | Air quality monitoring station data | 30 days before the emergency declaration date | PM2.5: -4.3 to -45.1 |
| Stratoulias and Nuthammachot (2020) | Thailand (Hat Yai) | Air quality monitoring station data | Pre-lockdown (1 Dec 2019 to 31 May 2020) | PM10: -22.9, PM2.5: -21.8, NO2: -33.7, CO: +9.9, O3: -12.5 |
| Tobías et al. (2020) | Spain (Barcelona) | Air quality monitoring station data Remote sensing data (Copernicus Sentinel-5) |
Pre-lockdown (14 to 30 March 2020) |
PM10: -31.0 to -27.8, BC: -45.4, NO2: -47.0 to -51.4, SO2: -19.4 to +1.8, O3: +28.5 to +57.7 NO2: -22.0 to -57.0 |
| Vadrevu et al. (2020) | India (41 cities) | Remote sensing data (Copernicus Sentinel-5) | Pre-lockdown (1 Jan to 24 March 2020) | NO2: -19.0 to -13.0 |
| Wang et al. (2020a) | China (Beijing, Chengdu, Shanghai, Xi’an, Shenzhen, Wuhan) | Air quality monitoring station data and Random forest models | Scenario without lockdowns | PM2.5: -(1.5 to 42.1), NO2: -(36 to 53), O3: -0.9 to +20.6, CO: -(14.5 to 28.8) |
| Wang et al. (2020b) | Northern China (30 Cities) | Air quality monitoring station data | Prior control period (1 to 23 Jan 2020) | O3: +51.0, AQI: -20.0, CO: -20.0, SO2: -16.0, NO2: -54.0, PM2.5: -21.0, PM10: -27.0 |
| Zhu et al. (2020) | Singapore | Air quality monitoring stations and Satellite data (Sentinel-5P) | Same period in 2016-2019 | O3: +18.0, PSI: -19.0, PM10: -23.0, PM2.5: -29.0, NO2: +54.0, CO: -6.0, SO2: -52.0 |
It should be noted that the improvement of urban air quality with respect to primary air pollutants did not show consistent temporal or spatial trends among cities within the same country and among different countries. This inconsistency arises from differences in the emission strengths of air pollutants from specific sources, the location of air pollution sources relative to fixed air quality monitoring stations, prevailing meteorology, chemical transformations of reactive air pollutants induced by atmospheric oxidants, and the effectiveness of their removal by atmospheric deposition processes. Air pollutants are emitted from a range of human-induced sources such as industries, on-road vehicles, ships, and aeroplanes, biomass burning and natural sources such as dust storms and oceans. During lockdowns, urban mobility was significantly restricted in most cities, leading to a reduction in transport-related air pollution. However, the emission characteristics of traffic-related air pollutants not only depend on the volume of on-road vehicles, but also on the traffic composition (the relative counts of motorcycles, passenger cars, buses, utility vehicles, and heavy-duty trucks) (Tran et al., 2021a).
Some studies considered changes in traffic volume and composition while interpreting their observational data on air pollutants. For example, Siciliano et al. (2020a) explained that the reduction in the levels of CO, NO2 and PM10 in Brazil’s two most populated cities (São Paulo and Rio the Janeiro) during the lockdown periods did not show a consistent pattern. This inconsistency was attributed to changes in the vehicular fleet characteristics in the two cities and the influence of other factors such as the transport of air masses from industrial and rural areas. In Singapore, PM10, PM2.5, NO2, CO, and SO2 decreased by 19, 23, 29, 54, 6, and 52%, respectively, while O3 increased by 18% during the lockdown period in 2020 (April–May) compared to their concentrations observed in the same months from 2016 to 2019 (Li and Tartarini, 2020). The reduction in the levels of PM2.5 and NO2 was mainly influenced by the reduced human mobility on road (Li and Tartarini, 2020). The changes in the concentrations of PM10, CO, and SO2 were attributed to the spatial distribution of other pollution sources such as industries, petroleum refineries and shipping-related activities in Singapore. In contrast to other air pollutants, the concentration of O3 rather increased in Singapore which was also observed during the lockdown in several other cities (Chen et al., 2020c; Collivignarelli et al., 2020; Kerimray et al., 2020; Sulaymon et al., 2021). Reasons for the unexpected increase in the levels of O3 are explained in a later section.
To get further insights, source apportionment (SA) of air pollutants using receptor models or chemical mass balance models is needed for developing effective air pollution control strategies (Hopke, 2016). However, only few studies, as shown in Section 2.2., investigated source characteristics of air pollutants with emphasis on PM using SA methods. The other reason for inconsistent results reported by different researchers in terms of improvements in urban air quality is the duration of lockdowns imposed in different countries. For example, China imposed a lockdown from 10 February to 14 March 2020, while India imposed 3 successive lockdowns from 25 March to 17 May 2020. The USA had its lockdown across the country from 19 March to April 30, 2020. Therefore, the volume of observational data obtained on criteria air pollutants differed significantly among countries worldwide. While comparing the concentrations of air pollutants measured during the lockdown to those obtained during pre- and post-lockdown periods, researchers used different protocols. Consequently, there was no consistency in the study outcomes. For example, some studies compared the levels of air pollutants measured during lockdowns to those obtained in the same year preceding and/or following the lockdown period (e.g., Abdullah et al., 2020; Cui et al., 2020; Siciliano et al., 2020a). Other studies considered either the same time period in previous years (2019/2018/2017) (e.g., Bekbulat et al., 2021; Chen et al., 2020b; Mahato et al., 2020; Singh and Chauhan, 2020) or a combination of both such time periods (e.g., Vadrevu et al., 2020). Meteorological conditions such as incoming solar radiation, ambient air temperature, relative humidity, wind speed and wind direction differ from one season to another within the same year. Consequently, the selection of pre- or post-lockdown period is critical in assessing the effectiveness of lockdown measures on urban air quality. Specifically, the transport, dispersion, distribution (both spatial and vertical) and concentration of air pollutants depend on seasonal variations of meteorological conditions.
In fact, several studies pointed out the importance of considering the role of meteorological conditions in explaining the changes in urban air quality during the lockdown (Ansari et al., 2019; He et al., 2017; Zhang et al., 2016). However, prevailing meteorological factors were seldom considered in the majority of lockdown-related air quality studies, which makes the comparison of study outcomes challenging to assess air quality improvements at regional and global scales. In addition to meteorology, the role of atmospheric chemistry in the conversion of reactive primary air pollutants such as SO2, VOCs and NOx to secondary air pollutants such as O3, secondary inorganic aerosol (SIA) and secondary organic aerosol (SOA) during lockdowns should also be considered (Huang et al., 2021a; Kroll et al., 2020; Sun et al., 2020).
This fundamental understanding in the formation of secondary air pollutants based on atmospheric observations in conjunction with the use of chemical transport models is important in the context of formulating air pollution mitigation policies (Chang and Hanna, 2004). For example, Sharma et al. (2020) demonstrated an overall decline of 43% in PM2.5 during part of the lockdown period for 22 cities in India (16 March–14 April 2020), when compared with the same time period in the previous years 2017–2019, based on modelling simulations. Miyazaki et al. (2020) provided insights into the reduction of NOx emissions by 36% on average in Chinese provinces during the lockdown compared to the 15-year pre-lockdown period (2005–2019) using a chemical transport model. The reduced precursor (NOx) emissions helped to explain the increased surface O3 (+16 ppb) and the decreased PM2.5 (by up to 23 μg/m3) concentrations nationwide.
The factors discussed above that are related to urban air quality are thought to be responsible for large variations in the concentrations of criteria air pollutants shown in Table 1. Selected comprehensive air quality studies included in Table 1 are discussed here to provide insights into changes in OAQ in 2020. Bekbulat et al. (2021) assessed the long-term and seasonal changes in PM2.5 levels (530 air quality monitoring stations across the USA) and O3 (611 air quality monitoring stations across the USA) based upon quality-assured data collected by the US-EPA (Environmental Protection agency) during “pre-COVID” and “post-COVID” in 2020 and compared these data to those obtained from the same time periods between 2010-2019 (termed as “expected concentrations”). The levels for PM2.5 for all stations during post-COVID response were on average higher (3%) and those for O3 lower (4%) compared to expected levels. The authors ascribe the relatively small but unexpected changes in PM2.5 and O3 to non-linear atmospheric chemistry, resulting in complex chemical reactions involving NOx and VOCs under clear skies. Kumar et al. (2020) used hourly PM2.5 data collected from five major cities in India (Chennai, Delhi, Hyderabad, Kolkata and Mumbai) to evaluate the changes in PM2.5 during the lockdown period compared to previous years. The PM2.5 data obtained in 2020 were compared to those collected during similar time periods over the past five years (2015–2019). This comparative evaluation revealed substantial reductions in PM2.5 concentrations, from 19 to 43% (Chennai), 41–53% (Delhi), 26–54% (Hyderabad), 24–36% (Kolkata), and 10–39% (Mumbai). In general, cities with larger traffic volume reductions showed greater decreases in PM2.5 concentrations. In addition to ground-based measurements of PM2.5, Kumar et al. (2020) used satellite imagery collected over the entire country to investigate the changes in Aerosol Optical Depth (AOD) which exhibited similar trends as PM2.5. Furthermore, the authors also carried out health and related economic impact assessments which indicated 630 prevented premature deaths during the lockdown across all five cities, valued at 0.69 billion USD.
Among all the criteria air pollutants, PM and O3 were observed to have the lowest percentage reductions (see Table 1) with some studies even reporting increases during the lockdown period for PM (Bekbulat et al., 2021; Siciliano et al., 2020a) and O3 (e.g., Kanniah et al., 2020; Sicard et al., 2020). PM2.5 and O3 concentrations are influenced by complex non-linear atmospheric formation processes, which will be discussed in further detail in the following two sections. An in-depth discussion regarding the variations of these two pollutants and associated factors is needed as they are both toxic and can cause adverse health effects when inhaled at elevated levels (Chowdhury et al., 2018; Kroll et al., 2020; Nuvolone et al., 2018; Sun et al., 2020). Other than the criteria air pollutants, decreases in the concentration of black carbon (BC) (Hudda et al., 2020; Tobías et al., 2020), ammonia (NH3) (Mahato et al., 2020; Resmi et al., 2020) and VOCs (Resmi et al., 2020; Siciliano et al., 2020b) were also observed in cities. However, studies dealing with changes in the concentrations and source variations of NH3 are limited compared to those on SO2 and NOx. Concentrations of NH3 were observed to decrease by up to 13% during the COVID-19 lockdowns. The decrease was attributed to reduced traffic and industry-related activities (Mahato et al., 2020; Resmi et al., 2020). In contrast, Zhang et al. (2021) found an increase in NH3 levels in Beijing, China and attributed this enhancement to a shallow boundary layer rather than changes in the emission intensity of NH3. The conversion of NH3 to ammonium (NH4 +) in the particle phase is influenced by meteorological factors (temperature and relative humidity) and concentrations of acidic gases (total nitrate (HNO3+NO3 -) and total sulfate (SO2+SO4 2-)) (Baek et al., 2004; Behera et al., 2013). While a decrease in particulate-bound NH4 + was observed in studies dealing with the chemical composition of PM (Chen et al., 2020a; Sun et al., 2020), the role of NH3 in gas-to-particle conversion has not been reported. The reduced emission of BC appears to be mainly related to a decrease in local traffic emissions, especially from diesel-powered vehicles (Hudda et al., 2020). BC is not only a toxic pollutant, but also an important contributor to global warming (Adam et al., 2020).
2.2. Impact of lockdown measures on PM
PM affects atmospheric visibility leading to haze, induces adverse human health effects and contributes to global climate change (Andreae and Crutzen, 1997; Lelieveld et al., 2015; Pöschl, 2005; Ramanathan and Carmichael, 2008). As can be seen in Table S1, only few studies have addressed the changes in PM composition, sources, and evolution processes between lockdown and non-lockdown periods. Without these insights into PM characteristics, it is difficult to formulate future PM mitigation strategies that aim at protecting human health (Lelieveld et al., 2015). Compared to other criteria air pollutants, PM exists in various sizes (from ~3 nm to 10 μm) and is composed of primary (e.g., BC, trace elements, and crustal matter) and secondary chemical components including SOA and SIA (NH4NO3, NH4Cl, and (NH4)2SO4) formed in the atmosphere through complex chemical reactions (Pöschl, 2005; Seinfeld and Pandis, 2016).
While time-integrated measurements are widely conducted to study the chemical composition of PM (Adam et al., 2021b; Balasubramanian et al., 2003; Betha et al., 2013; See et al., 2007a; See et al., 2006; Tran et al., 2020a), real-time measurements of PM chemical components are relatively scarce, especially during the lockdowns. High-resolution aerosol mass spectrometer (AMS)-based measurements provide a means to quantify the chemical composition of PM of various sizes ranging from 10 nm to 10 μm (Canagaratna et al., 2007; Jayne et al., 2000). The OA component can make up a large fraction (~50%) of PM consisting of primary organic aerosol (POA, direct emissions) and SOA (formed from VOC oxidation, see Fig. 2a) (De Gouw and Jimenez, 2009; Hallquist et al., 2009; Jimenez et al., 2009). Recent toxicological studies demonstrated the oxidative and inflammatory potency of SOA in human lung epithelial cells and macrophages, underscoring the importance of carrying out the detailed chemical speciation of PM (Chowdhury et al., 2018; Decesari et al., 2017; Ito et al., 2019). In this review, we brought together most of the published studies reporting AMS data-based observations of PM chemical composition, which are primarily from China as can be seen in Table S1.
Fig. 2.

(a) Formation of O3 and secondary PM2.5 from various sources (adapted from Akimoto (2019)) and (b) NO-NO2-O3 photochemical reaction sequence.
In general, real-time PM chemical composition measurements conducted in China indicate that the observed concentration trend of secondary aerosols was not consistent with that of primary aerosols, which decreased in response to strict lockdown measures imposed over the entire country. The key observations of changes in the PM chemical composition in China are discussed below. Sun et al. (2020) studied the lockdown effects on PM concentration and composition in Beijing, China, based on the PM data collected from 2012–2020 using quadrupole aerosol chemical speciation monitor (Q-ACSM, 2012, 2013, 2015, 2018), Time-of-Flight (ToF) ACSM (2019–2020) and Aethalometer AE22/AE33 (BC). Their findings indicate that primary PM species, which were linked to traffic, cooking and coal combustion emissions, were reduced by 30-50% on average during the Chinese New Year (CNY) period from 25 January to 2 February. However, surprisingly, SIA and SOA exhibited significant increases by 60–110% and 52–175%, which were attributed to regional transport of air masses from the south and the east in China and enhanced secondary aerosol formation.
Zheng et al. (2020) carried out hourly observations of PM2.5 chemical compositions including water-soluble ions (WSIs), trace elements (TEs), organic carbon (OC), and elemental carbon (EC) in Wuhan, China, using online instruments from 23 January 2020 to 22 February 2020. They contrasted the PM2.5 chemical speciation data observed during this time period with those during the same time period in 2019. The authors observed reductions in the concentrations of TEs and EC by about 1% during the lockdown period, suggesting little reductions in primary anthropogenic emissions of PM, while mass percentages of secondary species OC (+2.5%) and SIA (+8.7%) increased. Chang et al. (2020) performed comprehensive PM2.5 measurements together with the use of a chemical transport model at multiple sites in China (focused on Shanghai, besides Beijing, Jiaxing, Nanjing). They acquired observational data from several instruments including MARGA (semi-continuous Monitoring device for AeRosols and Gases in ambient Air), ToF-ACSM, semi-continuous OC-EC analyzer and multi-metal monitor (19 trace elements). The goal of this study was to study the impact of lockdown measures on PM characteristics in 2020 compared to 2019. While SOA levels were similar for both years, the authors noted higher levels of SIA (1.6 higher) for New Year Holiday (NYH) in 2020 compared to NYH-19 in spite of reductions in the emission of corresponding precursor species levels. This work suggested that differential transport patterns of polluted air masses, rather than local emissions of PM, might be the reason for the observed differences in PM2.5 mass concentrations and speciation in Shanghai between NYH-20 and NYH-19. In another study in Shanghai, China, Chen et al. (2020a) contrasted ToF-ACSM-based observations of PM2.5 speciation collected for three time periods. The authors reported that the strict quarantine measures led to lower PM2.5 levels, which was attributed to a combination of lower primary PM2.5 emissions and lower levels of NO3 - formed as a result of reduced NOx emissions. Further reductions in PM2.5 were inhibited by increased contributions of SO4 2- and SOA.
2.3. Impact of lockdown measures on O3
Surface O3 is formed photochemically through a series of chemical reactions involving gaseous precursors NOx and VOCs (Sillman, 1999) as shown in Fig. 2b. VOCs are emitted from biogenic (natural wetlands, trees) and anthropogenic (fossil-fuel-related, rice paddies, landfills and biomass burning emissions) sources (Di Carlo et al., 2004; Kansal, 2009) with important implications for atmospheric chemical transformations (Atkinson, 2000). In contrast to the other air pollutants, O3 was reported to have remained at a similar level or even show enhancements compared to pre-lockdown periods (e.g., Collivignarelli et al., 2020; Dantas et al., 2020; Nakada and Urban, 2020; Siciliano et al., 2020b; Tobías et al., 2020). Several factors may have contributed to the counter-intuitive trend of increased O3 levels: (i) At the city-scale, the O3 production rate is strongly linked to the VOC/NOx ratio (Pusede and Cohen, 2012). Generally, urban areas are characterized by a low VOC/NOx ratio due to high NOx concentrations driven by emissions from vehicles (Sillman, 1999). However, due to the decrease in NOx emissions from its main source (transport), it is plausible that O3 generation was enhanced because of a high VOC/NOx ratio and its reduced loss through the chemical titration with NO (Huang et al., 2021b). (ii) The decrease in observed PM2.5 levels may lead to an increase in the incoming solar radiation and thus enhanced photochemical production of O3 (Jia et al., 2017; Wang et al., 2020a). (iii) Also, the lower PM2.5 levels present a less efficient sink for hydroperoxyl radicals (HO2), enhancing O3 generation via the peroxy radical pathway (Sicard et al., 2020).
Sicard et al. (2020) investigated changes in tropospheric O3 levels at four European cities (Nice, Turin, Rome, Valencia) and Wuhan (China). The key findings are that the daily O3 mean concentrations increased at the urban stations by 24% in Nice, 27% in Turin, 14% in Rome, 2.4% in Valencia and 36% in Wuhan during the lockdown in 2020. The increase in O3 concentrations is mainly attributed to the unprecedented reduction in NOx emissions. The other key findings are: (i) the reduction in PM levels was much smaller in Europe (~8%) than in Wuhan (~42%); (ii) the NOx concentrations were lower in all cities during the lockdown (~49%) than those of the previous years; and (iii) the lockdown effect on O3 production was much higher in Wuhan (38%) than in southern Europe (~10%).
Le et al. (2020) studied changes in air quality (PM2.5, O3, SO2, NO2) in China during the lockdown period (23 January–13 February 2020) compared to those in the previous 5 years (2015–2019). Based on the synergistic observational and model analysis, the authors concluded that nonlinear formation pathways and the lack of titration of O3 in winter with reduced NO resulted in the enhancement of surface O3 in urban areas. Additionally, the oxidation capacity of the atmosphere was enhanced, which promoted the SOA formation. Liu et al. (2020a) investigated the impacts of changes in anthropogenic emissions and prevailing meteorology on the levels of PM2.5 and O3 for four cities (Shanghai, Nanjing, Hangzhou, and Hefei) in the Yangtze River Delta (YRD), China, using the Community Multiscale Air Quality (CMAQ) model from 29 December 2019 to February 29, 2020. A decrease was observed in PM2.5 (-53% to -31%). In contrast, for O3, significant increases were observed (+31% to +88%). The authors found that the O3 increase was primarily driven by both emission reductions of NOx (+29% to +52%) and variations in meteorological conditions (+17% to +49%) in YRD. The authors highlighted that strategically designed multi-pollutants (including NOx, VOCs, and primary PM) emissions control strategies are needed to achieve a significant improvement in urban air quality.
Changes in the levels of O3 also have implications for the oxidation capacity of the atmosphere. The oxidation capacity refers to the atmosphere’s ability to degrade inorganic and organic pollutants of anthropogenic and natural origins through reactions with the atmospheric oxidants such as the hydroxyl radical (OH), O3 and the nitrate radical (NO3) (Monks, 2005). Tropospheric O3 is also the dominant source of OH radicals, the key oxidant in the atmosphere during daytime (Berresheim et al., 2014; Berresheim et al., 2013). The OH radical initiates many oxidation reactions in the troposphere, leading to the formation of O3. An increase in O3 could in turn lead to an unintended enhancement of secondary PM2.5 as O3 can also enhance the formation of SOA as shown in Fig. 2a, which has implications for environment, health and climate (Chowdhury et al., 2018; Ito et al., 2019; von Schneidemesser et al., 2015). This observation has been discussed in a few studies (e.g., Huang et al., 2021b; Jia et al., 2020; Le et al., 2020). Overall, all these studies highlight that the mitigation of secondary air pollutants such as O3, SIA, and SOA in cities will remain a challenge even after implementation of effective policies for reduced emissions of primary air pollutants.
2.4. Impact of OAQ on COVID-19 outbreaks
There is a growing concern that air pollution may contribute to the severity of COVID-19 in persons who have contracted the virus by directly affecting the lungs’ ability to clear pathogens and indirectly by exacerbating underlying cardiovascular or pulmonary diseases (Brandt et al., 2020; Comunian et al., 2020). Similar concerns were reported during the SARS (Severe Acute Respiratory Syndrome) epidemic, caused by a virus genetically identical to COVID-19, whereby high mortality rates were noted in areas with deteriorated air quality (Cui et al., 2003).
Several studies have explored the association between outdoor air pollution and severity of COVID-19 infection and mortality, and suggested that poor OAQ has the potential to increase the lethality of COVID-19 (Conticini et al., 2020; Setti et al., 2020; Wu et al., 2020; Zhu et al., 2020). These studies accounted for variations in confounding factors such as population density, socioeconomic status and meteorological variables. In an ecological regression analysis study with data from 3089 counties across the USA representing 98% of the country’s population, Wu et al. (2020) found that a PM2.5 increase of only 1 μg/m3 was associated with an 8% increase in the COVID-19 death rate. Yao et al. (2020b) used publicly available data in China (Wuhan) on PM levels and the occurrence of COVID-19 cases, and found a strong positive association between case fatality rate (CFR) and exposure to high levels of PM10 and PM2.5. The authors suggest that exposure to high levels of PM increases systemic inflammation and oxidative stress in COVID-19 patients, which would in turn decrease cardiopulmonary functions. However, no attempts were made to characterize PM chemical speciation or provide details on the history of patients’ prior PM exposure, age and pre-existing health conditions. Han et al. (2020) showed that higher levels of outdoor air pollution are associated with an increased COVID-19 infection rate in Wuhan, China. A generalized additive model study by Zhu et al. (2020) suggested that even short-term exposure (e.g., two weeks) to PM10, PM2.5, O3, and NO2 was associated with a higher number of daily confirmed COVID-19 cases. Italy, in particular the northern region, proved to be one of the early epicentres of COVID-19 infections in the world during the spring of 2020. The region in northern Italy is generally characterized by high PM2.5 and PM10 levels, and is recognized as one of the most polluted areas in Europe (Conticini et al., 2020). Two cities in the north, Bergamo and Milan, were severely affected by the outbreak of COVID-19 (Setti et al., 2020). Contini and Costabile (2020) and Conticini et al. (2020) suggested that elevated air pollution levels in northern Italy contributed to the pronounced number of COVID-19 infections and high mortality. However, their conclusions were driven based upon existing findings in the air quality and human health domain. Further experimental and epidemiological studies are urgently needed to evaluate the role of the air pollution in COVID-19 pandemic.
O3, NO2 and transition metals in PM2.5 and UFPs are potent oxidants that are able to generate reactive oxygen species (ROS) which can induce adverse human health effects via inflammation and oxidative stress (Lodovici and Bigagli, 2011; Øvrevik et al., 2015; See et al., 2007b). However, compared to traffic-related emissions of primary aerosols, the role of secondary aerosols in contributing to negative health impacts is much less understood (Adams et al., 2015a).
Limited studies have been conducted to quantify health benefits associated with strict lockdown measures imposed in polluted cities such as reduced road traffic, telecommuting and mandatory wearing of face masks. Han and Hong (2020) used publicly available data (PM2.5 concentrations and the local population) in Seoul (South Korea) from 2016–2020 (January to April) to estimate mortality rates in 2019 and 2020. While no strict lockdown was imposed in South Korea during the study period, the PM2.5 levels decreased by 4.1 μg/m3 in 2020 in Seoul compared to the previous 4 years. The lower PM2.5 concentration in 2020 was attributed to two factors: (i) reduced domestic emissions of PM2.5 due to social distancing and increased telecommuting in Seoul and (ii) lower long-range transport of PM2.5 from China due to the implementation of stringent lockdown measures. Overall, 38 non-accidental, 7 cardiovascular, and 5 respiratory mortalities were avoided in 2020 due to exposure to lower PM2.5 levels. The number of estimated mortalities further decreased by a factor of 2.5 while considering the benefits of wearing face masks. This study has clearly shown the combined health benefits of reduction in PM2.5 concentrations and positive changes in the social behavior of the public. Nie et al. (2021) reported that the reductions of PM10, PM2.5 and NO2 levels observed in 31 provincial cities in China resulted in significant health benefits, i.e., total avoided premature deaths of 9410 (7273–11,144). NO2 reduction was the largest contributor (55%), followed by and PM10 (23.9%) and PM2.5 (10.9%). Mitze et al. (2020) used data on face masks for 401 regions (municipal districts) in Germany to study to what degree face masks protect the person using it from contracting COVID-19. The authors pointed out that face masks became mandatory at different times across Germany and found that 20 days after implementation of this mandatory requirement, the number of new infections was reduced by 45% (Mitze et al., 2020).
3. Factors affecting IAQ and their impacts
3.1. Overview of IAQ studies
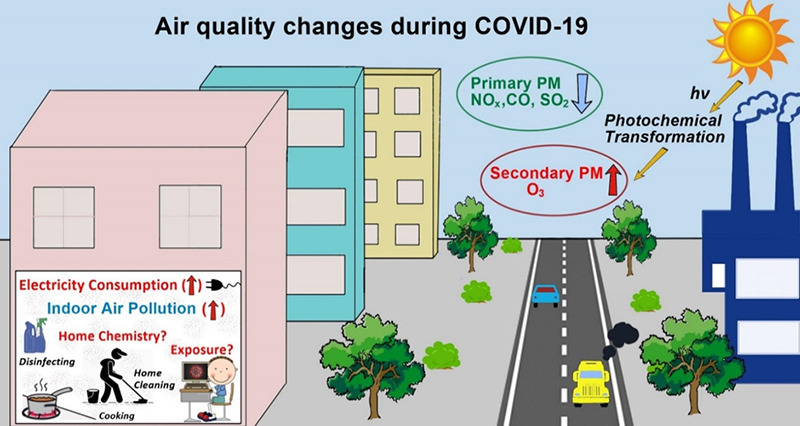
As people spend the majority of their time indoors (up to 90%, (Klepeis et al., 2001; Matz et al., 2015)) and almost 100% during the lockdown, indoor air pollution (IAP) deserves more attention from human health considerations than outdoor air pollution. Although outdoor air pollution can migrate into indoor environments through advection via open windows and infiltration otherwise, there are distinct and important sources of IAP such as cooking, smoking, home cleaning and incense burning (Balasubramanian and Lee, 2007; See and Balasubramanian, 2006; See and Balasubramanian, 2008; US EPA, 2020b). Therefore, reduction of ambient air pollution is not likely to result in a similar drop in IAP (illustrated in Fig. 3 ) (Du and Wang, 2020). Indoor air pollutants of concern include PM2.5, UFPs, polycyclic aromatic hydrocarbons (PAHs), VOCs, CO, NOx, airborne microbes, and other toxic organic compounds, which can emanate not only from a range of sources as mentioned earlier, but also from emissions from building materials or furnishings (Chakraborty et al., 2014; Gordon et al., 2014; Lewtas, 2007; Wang et al., 2017). Reactive air pollutants can be an additional source of harmful secondary indoor air pollutants, such as O3, OH. radicals, nitrous acid (HONO) and VOCs (Weschler and Carslaw, 2018).
Fig. 3.
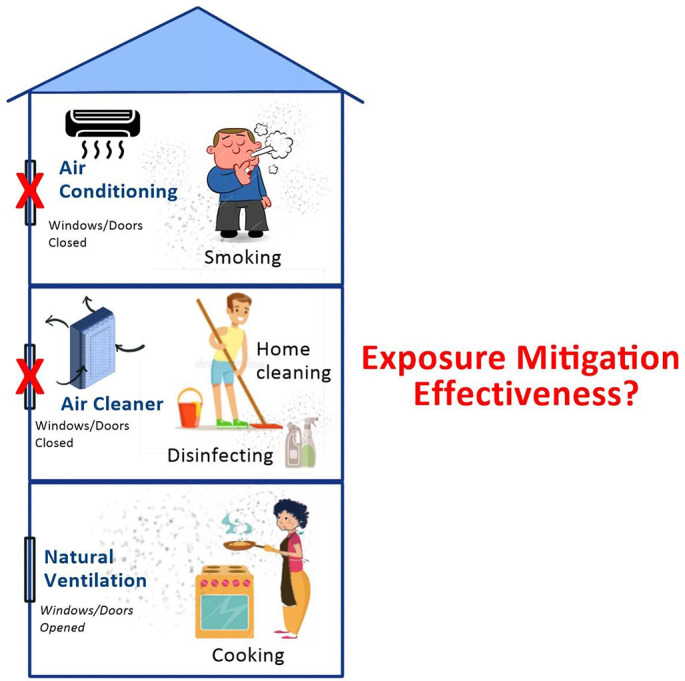
Schematic of indoor air pollution and different ventilation and mitigation scenarios.
Among the aforementioned indoor air pollution sources, cooking has been identified as one of the major sources of indoor PM, especially UFPs, which are a by-product of gas-stove combustion and/or are released from food ingredients in developed countries and biomass-based cooking (Kabera et al., 2020; Pollard et al., 2014; See and Balasubramanian, 2006; Zhao and Zhao, 2018). Certain types of cooking such as deep-frying, pan-frying or roast cooking can generate elevated levels of PM2.5 that are similar to the concentrations observed in the world’s most polluted cities (Patel et al., 2020; See and Balasubramanian, 2008; Sharma and Balasubramanian, 2020). Apart from intense and frequent cooking activities, the COVID-19 pandemic also has stimulated people to clean their homes frequently and with stronger chemicals or detergents to reduce the potential of viral infection (Anthes, 2020). Some studies have pointed out that household disinfectant products can be a significant emission source of secondary UFPs in indoor environments (Singer et al., 2006; Stabile et al., 2020). In addition, lockdown measures may result in increased levels of airborne microbes because of higher building occupant density than usual, with potential contact and airborne transmission of infectious/non-infectious microbes (Adams et al., 2015b; Kim et al., 2018). Therefore, as people are increasingly confined to their homes, population’s exposure to indoor air pollutants could be expected to be elevated and prolonged, leading to increased health risks (Morawska and Cao, 2020; Nwanaji-Enwerem et al., 2020; Saha and Chouhan, 2020).
3.2. Impact of lockdown measures on IAQ
While numerous studies focused on OAQ during the COVID-19 lockdown, the number of IAQ studies are relatively scant, which are summarized in Table S2. The key outcomes of some of the studies are discussed here. A study conducted in Marid city (Spain) found that although OAQ was improved, daily indoor PM2.5 and TVOC (total VOC) concentrations, on average, rose by 12% and 37% to 559%, respectively, during the lockdown compared to the pre-lockdown period (Domínguez-Amarillo et al., 2020). The peaks of indoor air pollutants were associated with the period of daily cleaning and food preparation (Domínguez-Amarillo et al., 2020). These findings are consistent with those reported by Kaliszewski et al. (2020). Habitual indoor burning of incense was reported by Amoatey et al. (2020) to increase indoor PM10 and PM2.5 concentrations, facilitating the potential human to human transmission of the SARS-CoV-2 via inhalation in Middle Eastern countries. Saha and Chouhan (2020) found that children aged under-five living in indoor smoky environmental conditions in India are the most vulnerable in terms of the health risk associated with the COVID-19 disease. The risk of COVID-19 infection was estimated based on data obtained from the National Family Health Survey in India conducted with the participation of 247,743 living children and daily ‘COVID-19 state-wise status’ in India (Saha and Chouhan, 2020). The other vulnerable group of the general population includes smokers. A study conducted in China revealed that hospitalized COVID-19 patients with smoking behaviour were about 14 times more likely to die compared to patients who were non-smokers (Liu et al., 2020b). In addition, exposure to IAP is believed to render individuals with pre-existing health conditions and the elderly more susceptible to COVID-19 during the lockdown (Sharma and Hossain, 2020). Thakur et al. (2020) also pointed out the high susceptibility to COVID-19 infection of refugees and migrant workers staying in poor IAQ conditions.
The possible association between COVID-19 and exposure to IAP may be partly due to the influence of exposure to IAP on the respiratory and immune systems of human beings (Afshari, 2020; Saha and Chouhan, 2020; Thakur et al., 2020). Continued exposure to IAP may weaken the human immune system, leading to decreased ability to fight against disease-causing toxicants upon inhalation. People staying in an area with high levels of indoor air pollutants are more likely to develop chronic respiratory conditions than others in relatively less polluted areas, and thus experience elevated health risk due to exposure to any infective agent (Conticini et al., 2020). The association between the exposure to IAP and respiratory ailments is thought to be due to oxidative stress, induced by PM-bound redox-active toxic elements (Ciencewicki and Jaspers, 2007; Pavagadhi et al., 2013; See et al., 2007b). Inhalation toxicology studies revealed that the exposure to PM could induce immunosuppression which in turn tends to (i) reduce the ability of macrophages to phagocytize or inactivate viruses, (ii) alter the function of surfactant proteins (SP-A and SP-D), and (iii) increase the permeability of the pulmonary epithelium. These impacts are all associated with enhanced susceptibility to respiratory virus infections (Ciencewicki and Jaspers, 2007; Tao et al., 2020). 3.8 million people a year worldwide die prematurely from illnesses attributable to household air pollution (WHO, 2020a). Poor IAQ is a long-standing public health issue and is of even greater relevance during COVID-19 pandemic (Nwanaji-Enwerem et al., 2020). Therefore, to protect human health and well-being during the COVID-19 pandemic and beyond, IAP should be prioritized and aligned with long-term environmental health initiatives on a global scale.
3.3. Impact of IAQ on COVID-19 transmission
Researchers investigated the role of various indoor air pollutants in the transmission of many infectious diseases (such as MERS-CoV, SARS-CoV-1, influenza A/H5N1) over the years. However, compared to investigations on the association between exposure to outdoor air pollution and health effects, the number of studies addressing the relationship between IAP and COVID-19 are relatively limited. A few studies have shown that occupants staying indoors with poor air quality may experience high severity of COVID-19 (Saha and Chouhan, 2020; Sharma and Hossain, 2020; Thakur et al., 2020). Also, air-tight indoor environments present a particularly conducive space for the airborne transmission of COVID-19 (Morawska et al., 2020; Velraj and Haghighat, 2020). Emerging evidence suggests that the transmission of COVID-19 via air (especially through bioaerosols) may represent an important pathway for the spread of the virus which the World Health Organization (WHO) has acknowledged in one of its latest scientific briefs on 09 July 2020 (WHO, 2020b).
Recent findings indicated a potential risk for bioaerosol (biological aerosol) transmission in the air (Kim et al., 2018; Stockwell et al., 2019). Bioaerosols are very small airborne particles (ranging in size from 0.001 to more than 100 μm) of biological origin that emanate from humans/plants/animals and can contain living organisms (e.g., viruses, bacteria, and fungi) (Douwes et al., 2003; Georgakopoulos et al., 2009). Regular human activities (e.g., breathing, talking, coughing, sneezing, walking, toilet flushing or sweeping floors) are capable of generating bioaerosols and therefore spreading pathogenic viruses (Chen and Hildemann, 2009; Cox et al., 2020). Evidence about the possibility of airborne transmission of SARS-CoV-2 is currently mounting. Several hospital-based studies have performed air-sampling, addressing COVID-19-related issues (Chia et al., 2020; Ding et al., 2020; Faridi et al., 2020; Guo et al., 2020; Jiang et al., 2020; Kenarkoohi et al., 2020; Lednicky et al., 2020; Liu et al., 2020c; Ong et al., 2020; Santarpia et al., 2020). Only two of these studies (Faridi et al., 2020; Ong et al., 2020) reported the absence of SARS-CoV-2 in air samples, while the other studies found the presence of SARS-CoV-2 genome (RNA) in hospital indoor air based on polymerase chain reaction (PCR) testing. Several research studies have also highlighted that the airborne transmission of SARS-CoV-2 virus is one of the most potential modes of its infection (Anderson et al., 2020; Lewis, 2020; Morawska and Cao, 2020; Wathore et al., 2020; Zhang et al., 2020).
The small particles containing the SARS-CoV-2 virus can be spread within indoor environments through diffusion covering distances up to 10 m from the emission sources (Morawska and Cao, 2020; Setti et al., 2020). There is a high probability of transmission of SARS-CoV-2 virus through respiratory droplets (>5 μm) and aerosols (<5 μm) emitted while speaking, in addition to coughing and sneezing (Stadnytskyi et al., 2020; Wathore et al., 2020; Zhang et al., 2020). The SARS-CoV-2 virus has been reported to be stable in the aerosol phase with a half-life of approximately 1.1–1.2 hours (Van Doremalen et al., 2020), so it can potentially be inhaled by susceptible individuals causing infection and further spreading of the disease human to human. Although airborne particles are believed to play an important role in carrying and transporting microorganisms including COVID-19, the interaction of different constituents of PM such as BC, PAHs and redox-active trace elements with coronavirus remains poorly understood due to lack of fundamental investigations addressing such interactions. In-depth studies are needed on virus survival and transmission in the presence of major individual chemical components of PM to develop a better understanding of the role of PM on the aforementioned topics.
Temperature, relative humidity and ventilation conditions are important indoor environmental factors that are related to the survival of SARS-CoV-2. Ahlawat et al. (2020) found that the chances of airborne transmission of SARS-CoV-2 are higher in dry indoor places (<40% RH) compared to humid places (>90% RH). Biryukov et al. (2020) also found that the virus decayed more rapidly when either indoor humidity or temperature remained high. Several studies have pointed out that poor ventilation in the indoor environment is associated with increased transmission of respiratory infections (Guo et al., 2021). Most COVID-19 transmission has been found to occur in indoor (or enclosed) environments particularly in crowded, poorly ventilated environments with indoor heating and doors kept closed (Miller et al., 2021), apartment building (Hwang et al., 2021), fitness centers and restaurants with minimal ventilation rate (Lu et al., 2020; Nishiura et al., 2020). In addition, recent evidence has shown that COVID-19 transmission could occur in air-tight transport microenvironments with high occupant density such as those on buses (with centralized air conditioner and in recirculation mode) (Shen et al., 2020) or in flights (Choi et al., 2020; Khanh et al., 2020). The evidence on disease transmission, e.g., in apartments, restaurants, buses, suggests that the way buildings are designed, operated and maintained influences ventilation and therefore, transmission.
Recent studies have highlighted that proper ventilation maintained in indoor environments can contain the spread of the SARS-CoV-2 virus in indoor environments (Azuma et al., 2020; Buonanno et al., 2020; Melikov et al., 2020; Morawska et al., 2020; SinBerBEST, 2020). This finding is further supported by the scientific literature that recognizes the importance of ventilation strategies to reduce the level of IAP (Ferguson et al., 2020; Stabile et al., 2019). Increasing the ventilation rate (ACH - air change per hour) has been widely suggested to be an effective management strategy to remove exhaled virus-laden aerosols, lowering their overall indoor concentrations through dilution and thus their uptake through inhalation by building occupants (Li et al., 2005; Stockwell et al., 2019). However, specific ventilation rates that can eliminate the risk of COVID-19 transmission by airborne PM have not been reported yet. There is also a lack of systematic investigations on aerosols containing chemicals and microbes under different ventilation (i.e., natural vs mechanical (with different ACH)) and exposure conditions (with and without air purification with filter-based devices). Lelieveld et al. (2020) simulated the individual risk of a particular person being infected in four indoor environments (office, school, choir and reception) and five exposure scenarios (passive ventilation + no masks; active ventilation with outside air + no masks; active ventilation + face masks; active ventilation, high-quality masks; high-volume filtration with HEPA). The simulation results show that the most effective strategy to reduce health risk is to make use of a combination of active ventilation and wearing face masks compared to other exposure reduction scenarios. However, there are significant uncertainties (e.g., related to the infective dose and the viral load) that may influence the results of model calculations. A detailed investigation of the influence of optimizing ventilation and exposure conditions in future simulation and experimental studies can provide science-based guidelines for mitigating the risks of COVID- 19 airborne transmission.
3.4. Improvement of IAQ
Based on the aforementioned review of various studies, appropriate mitigation measures need to be considered to minimize the exposure of people remaining indoors to IAP and thus the potential spread of aerosol-mode transmission of COVID-19. In buildings equipped with mechanical ventilation systems, outdoor air supply shall be kept to the maximum setting to enhance dilution of indoor air with the fresh air of outdoor origin. Recirculation of indoor air shall be set at a minimum level and treated with high-efficiency air filters (e.g., filters with equipped with Minimum Efficiency Reporting Value (MERV) 14–16) and disinfection of indoor air with UV irradiation (Siddiqui et al., 2020). Several studies have found the presence of SARS-CoV-2 in the air within restrooms/toilets (Ding et al., 2020; Liu et al., 2020c). Therefore, the exhaust ventilation in restrooms/toilets shall always be kept on to avoid the possibility of virus transmission in this indoor environment. In common areas with a high risk of crowd gatherings, such as meeting venues or the entrance lobby in large buildings, sufficient air extraction/exhaust and ventilation openings should be in place. The association between airflows and the spread of the COVID-19 virus has been reported (Borro et al., 2021; Lu et al., 2020). Therefore, it is recommended that the airflow patterns should be taken into consideration in the occupancy layout for social distancing. If fans are used in the oscillating mode, it should be ensured that the air is not blown directly from one person to another. It is also recommended that workplaces should be arranged such that there is no person directly facing one another.
For naturally ventilated buildings, windows or doors should be kept open to allow outdoor air to flow indoors without obstacles. If the recirculation air-conditioning is used, sufficient outdoor air should be provided by keeping the windows/doors minimally open in every room. Air-conditioning can be used to provide thermal comfort, but a fairly low particle removal efficiency and high energy usage may be expected (Tran et al., 2021b). There is potential to emit elevated outdoor PM levels from power plants as carbon-intensive fuels may be used to generate more electricity to meet the increased energy demand due to operation of air-conditioning systems (He et al., 2020b). Therefore, a reduction in energy consumption should be paid attention to in the context of improving IAQ. To reduce indoor airborne particles including viruses, HEPA-based portable air cleaners (PACs), fan filters, and disinfection devices (such as germicidal ultraviolet) may be deployed (James et al., 2020; Sharma and Balasubramanian, 2017, Sharma and Balasubramanian, 2019; Tham et al., 2018; Tran et al., 2021b; US EPA, 2020a). The selection of PACs depends on its performance in relation to the size of the room where it is placed; clean air delivery rate (CADR) is a very important factor to consider (AHAM, 2013; Shaughnessy and Sextro, 2006).
Viral infection largely depends on the amount of active viral inhaled dose and the immunity status of exposed individuals. To effectively minimize the exposure dose, wearing face masks is necessary, especially when staying or entering a closed environment with a high possibility of SARS-CoV-2 accumulation and transmission (Kohanski et al., 2020; Lelieveld et al., 2020; Yao et al., 2020a). However, different face masks have different protection efficiencies and degrees of fitness (Yao et al., 2020a; Zou and Yao, 2015). Several previous studies have shown that N95 and surgical masks have effectively reduced the wearer’s exposure and community transmission of coronavirus and influenza viruses (Jefferson et al., 2008; Leung et al., 2020; MacIntyre et al., 2017). Face shields are also proposed as an effective way to prevent early exposure to high-velocity aerosols or droplets (generated by coughing or sneezing) before impacting on a face mask or respirator (Lindsley et al., 2014). Wearing of face masks is recommended as the most effective means to prevent inter-human transmission, and this inexpensive practice, in conjunction with simultaneous active ventilation in indoor environments, contact tracing, quarantine and social distancing, represents the most likely fighting opportunity to stop the COVID-19 pandemic (Lelieveld et al., 2020; Zhang et al., 2020).
For maintaining an individual's immune system and ensuring long-term protection of public health, elimination or at least mitigation of the intensity of indoor air pollution sources is essential. Switching to electric appliances instead of wood or gas stoves, avoiding cooking/frying at very high temperature, and using kitchen hoods during cooking may prove to be effective in reducing the exposure to PM released from indoor cooking (Snider et al., 2018; Zhao and Zhao, 2018). When cleaning, it is good to avoid the overuse of disinfection products or chemicals that may contribute to the emission of hazardous substances to the indoor air (Nwanaji-Enwerem et al., 2020). Alternatively, the use of disinfectants that are less aggressive and have lower emissions of chemicals should be encouraged (e.g., avoiding the use of disinfectant sprays) (Domínguez-Amarillo et al., 2020).
4. Policy implications
Air quality management is a serious challenge because of the chemical complexity of outdoor and indoor air. Since anthropogenic activities are the main drivers of air pollution across the world (Fuzzi et al., 2015), policy decisions are the most effective tool to mitigate the emission of air pollutants and improve air quality for the benefit of human health and the environment. However, these decisions need to be made in accordance with a sound fundamental understanding of the science underpinning air pollution (Kroll et al., 2020). In this context, it is important for air quality scientists and policy makers to work together so that the scientific lessons learnt from air quality observations around the world during the lockdown can be translated into air pollution control policy-oriented actions. We point out several policy-oriented actions below.
4.1. Co-mitigation of PM and O3
The central take-home lesson from the lockdowns is that future air pollution control policies need to address the co-mitigation of PM2.5 and O3 pollution (see Fig. 4 ). However, until recently, PM2.5 and O3 were treated as two separate air pollutants (Li et al., 2019). Tropospheric O3 is formed in the atmosphere through a complex set of photochemical reactions, and poses a threat to human health when its concentration is elevated. Likewise, the formation of secondary PM containing both inorganic and organic species is very complex and depends on the oxidizing capacity of the atmosphere and meteorological conditions. Secondary PM2.5 contributes substantially to overall PM2.5 levels (Jimenez et al., 2009; Volkamer et al., 2006) and is associated with detrimental health effects (Ito et al., 2019). The synergistic health effects of PM2.5 and O3 remain unknown. Compared to controlling primary emissions of PM2.5, reduction in the concentration of secondary PM2.5 is more challenging as its formation can occur via aqueous-phase or gas-phase photochemical processes. Given that the same gaseous precursors are involved in the formation of both O3 and secondary aerosols, an integrated air pollution control policy is needed based on the following measures by: (i) lowering emissions of both NOx and SO2 from fossil fuel combustion sources in order to mitigate the formation of sulfate (SO4 2-) and nitrate (NO3 -) which are major components of SIA and to suppress the formation of O3 as NOx is an important precursor; (ii) lowering emissions of both NOx and VOCs simultaneously to further reduce O3 and decrease the formation of SOA (Akimoto et al., 2015).
Fig. 4.

Policy implications as a result of the scientific findings made during the lockdowns across the world.
Recent (2013–2017) stringent air pollution control measures implemented in China to regulate the emission of primary pollutants led to similar observations as those during the lockdowns whereby a decrease in PM2.5 levels had the unintended consequence of increasing O3 levels (Li et al., 2019; Zhang et al., 2019). Atmospheric chemistry model simulations performed by Li et al. (2019) showed that the scavenging of the hydroperoxy (HO2) and nitrate (NO3) radicals by PM was reduced due to lower PM2.5 levels, resulting in enhanced O3 formation. The authors suggest that reductions of NOx and aromatic VOC emissions may be particularly effective for decreasing SOA and O3 in parallel (see Section 2.3. for details on O3 chemistry). However, the authors did not discuss potential changes in PM2.5 speciation in the study. Furthermore, air quality modelling studies indicate that if appropriate air pollution control policies were to be implemented for simultaneous mitigation of both PM2.5 and O3, significant public health benefits could be derived. For example, population exposure to PM2.5 could be drastically reduced (up to 75% reduction of PM2.5) by implementing anthropogenic emission reductions, bringing PM2.5 levels well below WHO guidelines along with a reduction in premature deaths (Amann et al., 2020). In another global atmospheric chemistry-climate model study, Lelieveld et al. (2019) showed that replacement of fossil fuels by renewable energy sources would reduce global premature deaths by 65% because of reduction in the atmospheric levels of both primary and secondary air pollutants. A combination of measurements of the changes in atmospheric chemical composition and the use of appropriate chemical-transport models will inform what policy interventions would be most effective for the co-mitigation of PM2.5 and O3.
In order to mitigate the concentration of PM2.5 and O3, a multi-pronged approach with the development of pro-active policies focusing on effective air pollution control at the sources of 3 their precursor species (SO2, NOx and VOCs) is needed. The following pollution control measures are suggested: (i) post-combustion emission controls at large plants in the power and industry sectors; (ii) effective mitigation of these precursor emissions from industrial processes, including steel, cement and glass production; (iii) implementation of higher emissions standards such as Euro VI for diesel and gasoline vehicles (Jonson et al., 2017; Rhys-Tyler et al., 2011); (iv) large-scale installation of renewable energy sources such as wind, solar and hydro power for electricity generation in countries by providing economic incentives (Alvarez-Herranz et al., 2017); (v) prescribed land clearing activities associated with agricultural practices to prevent the occurrence of biomass burning episodes (forest and peat fires) (Adam et al., 2021b); (vi) the use of clean cooking fuels such as electricity and liquid petroleum gas (LPG) (Rosenthal et al., 2018); (vii) improved energy efficiency of household appliances, buildings, lighting, heating and cooling and encourage roof-top solar installations; (viii) environmentally-benign urban planning involving green infrastructure and low-emission zones in cities (Kumar et al., 2019); (ix) promotion of public and active transport and vehicle sharing concepts with the added benefits of physical activity if active transport is used (Rabl and De Nazelle, 2012; Tran et al., 2021c). To facilitate this lifestyle habit change, cities need to make appropriate changes to their infrastructure, e.g., by implementing more cycling lanes (Tran et al., 2020b); and (x) promotion of electric and fuel-cell powered vehicles in cities (Liang et al., 2019).
4.2. IAQ control
The topic of indoor air pollution merits increased attention as people spend a considerable amount of their time indoors. However, IAQ guidelines currently do not exist in many countries, but are necessary for health risk assessment (Morawska et al., 2013; Morawska et al., 2017). IAQ considerations are of particular importance to human health during lockdowns due to the intensity of human activities taking place in close proximity to indoor occupants (e.g., cleaning, cooking, smoking and incense burning) and the long duration of exposure to air pollutants (Du and Wang, 2020). Policy makers, building scientists, and air quality scientists should work together to establish specific IAQ guidelines that are relevant to individual cities by taking into consideration the local population density, demography, topography and lay-out of residential buildings. While attempting to improve IAQ, it is important to note that the continued use of various indoor appliances would lead to increased energy consumption and thus increased emissions of air pollutants including CO2 from power plants.
4.3. Health risk assessment
Air Quality Index (AQI) that is indicative of the level of outdoor air pollution has been widely used by government agencies around the world to inform the public of potential health effects of exposure to outdoor air pollutants. However, no such index is currently available to provide health advisory. As a result, indoor occupants tend to underestimate health risk, especially while being home quarantined. If appropriate health advisory is provided, this will enable the vulnerable members of the population to make an informed decision about protecting their health against exposure to harmful indoor air pollutants by using effective exposure mitigation devices. As people are mobile, integrated air pollution exposure assessment based on the concentrations of air pollutants, particularly PM, measured in both outdoor and indoor microenvironments using portable sensors is vital (Adam et al., 2021a; Tran et al., 2021c; Tran et al., 2020a). This kind of exposure assessment will allow people to minimize health risks by avoiding visits to polluted or crowded environments. From the policy viewpoint, there is an urgent need to conduct epidemiological studies with an aim of investigating the relationship between time-integrated exposure to air pollution across both outdoor and indoor microenvironments and health impacts associated with COVID-19. Spatiotemporal variations of air pollutants and exposure assessment models should be coupled to develop appropriate pro-active policies in the context of mitigation of health risk (Stewart et al., 2017; Vitolo et al., 2018).
According to the WHO, more than 90% of urban dwellers are subject to air quality levels above the WHO issued global air quality guideline value for PM2.5 in ambient air of 10 μg m-3 as annual mean (WHO, 2018). However, the total PM mass concentrations may not be an appropriate indicator of its health impacts as the different PM chemical components have differing toxicological potential (Betha et al., 2014; Pavagadhi et al., 2013; Wu et al., 2017). Hence, health impact assessments of PM should consider its chemical composition (Betha et al., 2014; Betha et al., 2013).
5. Summary and recommendations
The lockdowns imposed by governments around the world in response to the steep surge in COVID-19 infections in early 2020 provided a unique opportunity to enhance our understanding of how anthropogenic activities impact air quality based on the reconstruction of knowledge generated by the scientific community out of the global-scale experiment conducted in the natural laboratory. While the approach to study the changes in air quality during the lockdown compared to pre- and post-lockdown periods varied among researchers, most countries in general reported a substantial decline in the levels of primary air pollutants including NOx, SO2, and CO, and primary PM, which was largely attributed to reductions in traffic-related emissions and some industrial emissions. However, the complex and nonlinear response of secondary chemical components of PM to air pollution control measures meant that the formation of secondary PM at least partially offset the reductions in primary PM. Furthermore, most studies reported either minimal to no reduction, or even an increase in surface O3 concentrations. Compared to OAQ studies, IAQ investigations were relatively scarce in spite of the global population spending the majority of their time indoors during the lockdowns, accompanied by pollution-causing household activities such as cooking and cleaning. In the context of human health considerations, studies have shown that the airborne transmission of the SARS-CoV-2 virus, particularly in indoor environments, is of serious concern. Specifically, high levels of air pollution can exacerbate the human health impacts that COVID-19 patients experience and slow down their recovery. For transmission of the virus, it is important how indoor environments (i.e., buildings) are designed, operated and maintained because of the influence of ventilation the transmission of airborne virus. The consolidation of key findings on OAQ and IAQ has important implications for development and implementation of air pollutant control strategies. Concerted efforts are needed to phase out anthropogenic emissions from carbon-intensive sources through implementation of pro-active policies, aiming at co-benefits in terms of better OAQ & IAQ, improved human health and climate resilience.
Major recommendations arising from this critical review are listed below:
-
•
The enhanced formation of secondary PM2.5 and O3 under favorable pollution and weather conditions indicates that an integrated air pollution control policy is needed for the co-mitigation of both PM2.5 and O3 with the use of an appropriate chemical transport model.
-
•
Fundamental multi-disciplinary scientific investigations are needed to provide insights into the interplay of anthropogenic emissions of air pollutants, prevailing meteorology and atmospheric chemistry in the context of developing urban air quality management strategies.
-
•
Observational air pollution data obtained from multiple platforms should be analyzed to identify temporal and spatial distributions of primary and secondary air pollutants in conjunction with the use of chemical transport models and source apportionment techniques.
-
•
Assessment of air quality in indoor environments, especially in domestic environments, is of great significance during lockdowns as people spend most of their time indoors, being exposed to air pollutants of diverse origins including indoor activities. However, studies investigating changes in IAQ are scarce. Such studies should be conducted under different ventilation conditions and occupancy levels and with exposure mitigation technologies to assess and manage human health risk so that appropriate IAQ guidelines can be recommended.
-
•
High levels of outdoor and indoor air pollution can potentially aggravate the adverse health impacts that COVID-19 patients might experience and slow down their recovery. Hence, an integrated assessment of OAQ and IAQ using mobile devices is warranted.
-
•
There is a lack of epidemiological investigations and in vivo and in vitro studies to investigate potential health impacts of infectious aerosols in the presence of PM and other air pollutants in the background outdoor/indoor air. Such investigations are needed to formulate effective strategies to improve air quality.
-
•
Clean air policy development, focused on the decarbonization of economies with the integration of transport, industrial and energy sectors, is necessary to bring a paradigm shift in how air pollution challenges are tackled in the future while the global population and urbanization are on the rise.
Funding sources
This research did not receive any specific grant from funding agencies in the public, commercial, or not-for-profit sectors.
Declaration of Competing Interest
The authors declare that they have no known competing financial interests or personal relationships that could have appeared to influence the work reported in this paper.
Acknowledgements
We thank Ms. Jayanthi Padmanabhan for helpful discussions and editorial help.
Footnotes
Supplementary data to this article can be found online at https://doi.org/10.1016/j.atmosres.2021.105823.
Appendix A. Supplementary data
Supplementary material
References
- Abdullah S., Mansor A.A., Napi N.N.L.M., Mansor W.N.W., Ahmed A.N., Ismail M., Ramly Z.T.A. Air quality status during 2020 Malaysia Movement Control Order (MCO) due to 2019 novel coronavirus (2019-nCoV) pandemic. Sci. Total Environ. 2020;729:139022. doi: 10.1016/j.scitotenv.2020.139022. [DOI] [PMC free article] [PubMed] [Google Scholar]
- Adam M.G., Chiang A.W.J., Balasubramanian R. Insights into characteristics of light absorbing carbonaceous aerosols over an urban location in Southeast Asia. Environ. Pollut. 2020;257:113425. doi: 10.1016/j.envpol.2019.113425. [DOI] [PubMed] [Google Scholar]
- Adam M.G., Tran P.T., Cheong D.K., Chandra Sekhar S., Tham K.W., Balasubramanian R. Assessment of home-based and mobility-based exposure to black carbon in an urban environment: a pilot study. Int. J. Environ. Res. Public Health. 2021;18:5028. doi: 10.3390/ijerph18095028. [DOI] [PMC free article] [PubMed] [Google Scholar]
- Adam M.G., Tran P.T.M., Bolan N., Balasubramanian R. Biomass burning-derived airborne particulate matter in Southeast Asia: a critical review. J. Hazard. Mater. 2021;407:124760. doi: 10.1016/j.jhazmat.2020.124760. [DOI] [PubMed] [Google Scholar]
- Adams K., Greenbaum D.S., Shaikh R., van Erp A.M., Russell A.G. Particulate matter components, sources, and health: systematic approaches to testing effects. J. Air Waste Manage. Assoc. 2015;65:544–558. doi: 10.1080/10962247.2014.1001884. [DOI] [PubMed] [Google Scholar]
- Adams R.I., Bateman A.C., Bik H.M., Meadow J.F. Microbiota of the indoor environment: a meta-analysis. Microbiome. 2015;3:49. doi: 10.1186/s40168-015-0108-3. [DOI] [PMC free article] [PubMed] [Google Scholar]
- Afshari R. Indoor air quality and severity of COVID-19: where communicable and non-communicable preventive measures meet. Asia Pac. J. Med. Toxicol. 2020;9:1–2. [Google Scholar]
- AHAM . 2013. Method for Measuring Performance of Portable Household Electric Room Air Cleaners. [Google Scholar]
- Ahlawat A., Wiedensohler A., Mishra S.K. An overview on the role of relative humidity in airborne transmission of SARS-CoV-2 in indoor environments. Aerosol Air Qual. Res. 2020;20:1856–1861. [Google Scholar]
- Akimoto H. 2019. PM2.5 and Ozone Co-Control-Clean Air Policy Brief 2019. [Google Scholar]
- Akimoto H., Kurokawa J.i., Sudo K., Nagashima T., Takemura T., Klimont Z., Amann M., Suzuki K. SLCP co-control approach in East Asia: tropospheric ozone reduction strategy by simultaneous reduction of NOx/NMVOC and methane. Atmos. Environ. 2015;122:588–595. [Google Scholar]
- Alvarez-Herranz A., Balsalobre-Lorente D., Shahbaz M., Cantos J.M. Energy innovation and renewable energy consumption in the correction of air pollution levels. Energy Policy. 2017;105:386–397. [Google Scholar]
- Aman M.A., Salman M.S., Ali P.Y. COVID-19 and its impact on environment: Improved pollution levels during the lockdown period – a case from Ahmedabad, India. Remote Sensing Appl. Soc. Environ. 2020;20:100382. doi: 10.1016/j.rsase.2020.100382. [DOI] [PMC free article] [PubMed] [Google Scholar]
- Amann M., Kiesewetter G., Schöpp W., Klimont Z., Winiwarter W., Cofala J., Rafaj P., Höglund-Isaksson L., Gomez-Sabriana A., Heyes C., Purohit P., Borken-Kleefeld J., Wagner F., Sander R., Fagerli H., Nyiri A., Cozzi L., Pavarini C. Reducing global air pollution: the scope for further policy interventions. Phil. Trans. R. Soc. A Math., Phys. Eng. Sci. 2020;378:20190331. doi: 10.1098/rsta.2019.0331. [DOI] [PMC free article] [PubMed] [Google Scholar]
- Amoatey P., Omidvarborna H., Baawain M.S., Al-Mamun A. Impact of building ventilation systems and habitual indoor incense burning on SARS-CoV-2 virus transmissions in Middle Eastern countries. Sci. Total Environ. 2020;733:139356. doi: 10.1016/j.scitotenv.2020.139356. [DOI] [PMC free article] [PubMed] [Google Scholar]
- Anderson E.L., Turnham P., Griffin J.R., Clarke C.C. Consideration of the aerosol transmission for COVID-19 and public health. Risk Anal. 2020;40:902–907. doi: 10.1111/risa.13500. [DOI] [PMC free article] [PubMed] [Google Scholar]
- Andreae M.O., Crutzen P.J. Atmospheric aerosols: biogeochemical sources and role in atmospheric chemistry. Science. 1997;276:1052–1058. [Google Scholar]
- Ansari T.U., Wild O., Li J., Yang T., Xu W., Sun Y., Wang Z. Effectiveness of short-term air quality emission controls: a high-resolution model study of Beijing during the Asia-Pacific Economic Cooperation (APEC) summit period. Atmos. Chem. Phys. 2019;19:8651–8668. [Google Scholar]
- Anthes E. Coronavirus lockdowns may raise exposure to indoor air pollution: smarter cooking and cleaning can lessen the risk. Sci. Am., Munn&Co; New York, June 1. 2020 https://www.scientificamerican.com/article/coronavirus-lockdowns-may-raise-exposure-to-indoor-air-pollution/ [Google Scholar]
- Atkinson R. Atmospheric chemistry of VOCs and NOx. Atmos. Environ. 2000;34:2063–2101. [Google Scholar]
- Azuma K., Yanagi U., Kagi N., Kim H., Ogata M., Hayashi M. Environmental factors involved in SARS-CoV-2 transmission: effect and role of indoor environmental quality in the strategy for COVID-19 infection control. Environ. Health Prev. Med. 2020;25:1–16. doi: 10.1186/s12199-020-00904-2. [DOI] [PMC free article] [PubMed] [Google Scholar]
- Baek B.H., Aneja V.P., Tong Q. Chemical coupling between ammonia, acid gases, and fine particles. Environ. Pollut. 2004;129:89–98. doi: 10.1016/j.envpol.2003.09.022. [DOI] [PubMed] [Google Scholar]
- Balasubramanian R., Lee S.S. Characteristics of indoor aerosols in residential homes in urban locations: a case study in Singapore. J. Air Waste Manage. Assoc. 2007;57:981–990. doi: 10.3155/1047-3289.57.8.981. [DOI] [PubMed] [Google Scholar]
- Balasubramanian R., Qian W.B., Decesari S., Facchini M.C., Fuzzi S. Comprehensive characterization of PM2.5 aerosols in Singapore. J. Geophys. Rese. Atmos. 2003;108:4523. [Google Scholar]
- Bao R., Zhang A. Does lockdown reduce air pollution? Evidence from 44 cities in northern China. Sci. Total Environ. 2020;731:139052. doi: 10.1016/j.scitotenv.2020.139052. [DOI] [PMC free article] [PubMed] [Google Scholar]
- Barré J., Petetin H., Colette A., Guevara M., Peuch V.H., Rouil L., Engelen R., Inness A., Flemming J., Pérez García-Pando C., Bowdalo D., Meleux F., Geels C., Christensen J.H., Gauss M., Benedictow A., Tsyro S., Friese E., Struzewska J., Kaminski J.W., Douros J., Timmermans R., Robertson L., Adani M., Jorba O., Joly M., Kouznetsov R. Estimating lockdown induced European NO2 changes. Atmos. Chem. Phys. Disc. 2020;2020:1–28. [Google Scholar]
- Behera S.N., Betha R., Balasubramanian R. Insights into chemical coupling among acidic gases, ammonia and secondary inorganic aerosols. Aerosol Air Qual. Res. 2013;13:1282–1296. [Google Scholar]
- Bekbulat B., Apte J.S., Millet D.B., Robinson A.L., Wells K.C., Presto A.A., Marshall J.D. Changes in criteria air pollution levels in the US before, during, and after Covid-19 stay-at-home orders: evidence from regulatory monitors. Sci. Total Environ. 2021;769:144693. doi: 10.1016/j.scitotenv.2020.144693. [DOI] [PMC free article] [PubMed] [Google Scholar]
- Berman J.D., Ebisu K. Changes in U.S. air pollution during the COVID-19 pandemic. Sci. Total Environ. 2020;739:139864. doi: 10.1016/j.scitotenv.2020.139864. [DOI] [PMC free article] [PubMed] [Google Scholar]
- Berresheim H., McGrath J., Adam M., Mauldin R.L., III, Bohn B., Rohrer F. Seasonal measurements of OH, NOx, and J(O1D) at Mace Head, Ireland. Geophys. Res. Lett. 2013;40:1659–1663. [Google Scholar]
- Berresheim H., Adam M., Monahan C., O'Dowd C., Plane J.M.C., Bohn B., Rohrer F. Missing SO2 oxidant in the coastal atmosphere?-observations from high-resolution measurements of OH and atmospheric sulfur compounds. Atmos. Chem. Phys. 2014;14:12209–12223. [Google Scholar]
- Betha R., Pradani M., Lestari P., Joshi U.M., Reid J.S., Balasubramanian R. Chemical speciation of trace metals emitted from Indonesian peat fires for health risk assessment. Atmos. Res. 2013;122:571–578. [Google Scholar]
- Betha R., Behera S.N., Balasubramanian R. 2013 Southeast Asian smoke haze: fractionation of particulate-bound elements and associated health risk. Environ. Sci. Technol. 2014;48:4327–4335. doi: 10.1021/es405533d. [DOI] [PubMed] [Google Scholar]
- Biryukov J., Boydston J.A., Dunning R.A., Yeager J.J., Wood S., Reese A.L., Ferris A., Miller D., Weaver W., Zeitouni N.E. Increasing temperature and relative humidity accelerates inactivation of SARS-CoV-2 on surfaces. MSphere. 2020;5 doi: 10.1128/mSphere.00441-20. [DOI] [PMC free article] [PubMed] [Google Scholar]
- Borro L., Mazzei L., Raponi M., Piscitelli P., Miani A., Secinaro A. The role of air conditioning in the diffusion of Sars-CoV-2 in indoor environments: a first computational fluid dynamic model, based on investigations performed at the Vatican State Children's hospital. Environ. Res. 2021;193:110343. doi: 10.1016/j.envres.2020.110343. [DOI] [PMC free article] [PubMed] [Google Scholar]
- Brandt E.B., Beck A.F., Mersha T.B. Air pollution, racial disparities, and COVID-19 mortality. J. Allergy Clin. Immunol. 2020;146:61–63. doi: 10.1016/j.jaci.2020.04.035. [DOI] [PMC free article] [PubMed] [Google Scholar]
- Buonanno G., Morawska L., Stabile L. Quantitative assessment of the risk of airborne transmission of SARS-CoV-2 infection: prospective and retrospective applications. Environ. Int. 2020;145:106112. doi: 10.1016/j.envint.2020.106112. [DOI] [PMC free article] [PubMed] [Google Scholar]
- Canagaratna M.R., Jayne J.T., Jimenez J.L., Allan J.D., Alfarra M.R., Zhang Q., Onasch T.B., Drewnick F., Coe H., Middlebrook A. Chemical and microphysical characterization of ambient aerosols with the aerodyne aerosol mass spectrometer. Mass Spectrom. Rev. 2007;26:185–222. doi: 10.1002/mas.20115. [DOI] [PubMed] [Google Scholar]
- Chakraborty D., Mondal N.K., Datta J.K. Indoor pollution from solid biomass fuel and rural health damage: a micro-environmental study in rural area of Burdwan, West Bengal. Int. J. Sustain. Built Environ. 2014;3:262–271. [Google Scholar]
- Chang J.C., Hanna S.R. Air quality model performance evaluation. Meteorol. Atmos. Phys. 2004;87:167–196. [Google Scholar]
- Chang Y., Huang R.-J., Ge X., Huang X., Hu J., Duan Y., Zou Z., Liu X., Lehmann M.F. Puzzling haze events in China during the Coronavirus (COVID-19) shutdown. Geophys. Res. Lett. 2020;47 doi: 10.1029/2020GL088533. e2020GL088533. [DOI] [PMC free article] [PubMed] [Google Scholar]
- Chen Q., Hildemann L.M. The effects of human activities on exposure to particulate matter and bioaerosols in residential homes. Environ. Sci. Technol. 2009;43:4641–4646. doi: 10.1021/es802296j. [DOI] [PubMed] [Google Scholar]
- Chen H., Huo J., Fu Q., Duan Y., Xiao H., Chen J. Impact of quarantine measures on chemical compositions of PM2.5 during the COVID-19 epidemic in Shanghai, China. Sci. Total Environ. 2020;743:140758. doi: 10.1016/j.scitotenv.2020.140758. [DOI] [PMC free article] [PubMed] [Google Scholar]
- Chen K., Wang M., Huang C., Kinney P.L., Anastas P.T. Air pollution reduction and mortality benefit during the COVID-19 outbreak in China. Lancet Planet. Health. 2020;4:e210–e212. doi: 10.1016/S2542-5196(20)30107-8. [DOI] [PMC free article] [PubMed] [Google Scholar]
- Chen Q.-X., Huang C.-L., Yuan Y., Tan H.-P. Influence of COVID-19 event on air quality and their association in Mainland China. Aerosol Air Qual. Res. 2020;20:1541–1551. [Google Scholar]
- Chia P.Y., Coleman K.K., Tan Y.K., Ong S.W.X., Gum M., Lau S.K., Lim X.F., Lim A.S., Sutjipto S., Lee P.H. Detection of air and surface contamination by SARS-CoV-2 in hospital rooms of infected patients. Nat. Commun. 2020;11:1–7. doi: 10.1038/s41467-020-16670-2. [DOI] [PMC free article] [PubMed] [Google Scholar]
- Choi E.M., Chu D.K., Cheng P.K., Tsang D.N., Peiris M., Bausch D.G., Poon L.L., Watson-Jones D. In-flight transmission of SARS-CoV-2. Emerg. Infect. Dis. 2020;26:2713. doi: 10.3201/eid2611.203254. [DOI] [PMC free article] [PubMed] [Google Scholar]
- Chowdhury P.H., He Q., Lasitza Male T., Brune W.H., Rudich Y., Pardo M. Exposure of lung epithelial cells to photochemically aged secondary organic aerosol shows increased toxic effects. Environ. Sci. Technol. Lett. 2018;5:424–430. [Google Scholar]
- Ciencewicki J., Jaspers I. Air pollution and respiratory viral infection. Inhal. Toxicol. 2007;19:1135–1146. doi: 10.1080/08958370701665434. [DOI] [PubMed] [Google Scholar]
- Collivignarelli M.C., Abba A., Bertanza G., Pedrazzani R., Ricciardi P., Carnevale Miino M. Lockdown for COVID-2019 in Milan: what are the effects on air quality? Sci. Total Environ. 2020;732:139280. doi: 10.1016/j.scitotenv.2020.139280. [DOI] [PMC free article] [PubMed] [Google Scholar]
- Collivignarelli M.C., De Rose C., Abbà A., Baldi M., Bertanza G., Pedrazzani R., Sorlini S., Carnevale Miino M. Analysis of lockdown for CoViD-19 impact on NO2 in London, Milan and Paris: what lesson can be learnt? Process Safety Environ. Protect. 2021;146:952–960. doi: 10.1016/j.psep.2020.12.029. [DOI] [PMC free article] [PubMed] [Google Scholar]
- Comunian S., Dongo D., Milani C., Palestini P. Air pollution and COVID-19: the role of particulate matter in the spread and increase of Covid-19's morbidity and mortality. Int. J. Environ. Res. Public Health. 2020;17:4487. doi: 10.3390/ijerph17124487. [DOI] [PMC free article] [PubMed] [Google Scholar]
- Conticini E., Frediani B., Caro D. Can atmospheric pollution be considered a co-factor in extremely high level of SARS-CoV-2 lethality in Northern Italy? Environ. Pollut. 2020;261:114465. doi: 10.1016/j.envpol.2020.114465. [DOI] [PMC free article] [PubMed] [Google Scholar]
- Contini D., Costabile F. Does air pollution influence COVID-19 outbreaks? Atmosphere. 2020;11:377. [Google Scholar]
- Cox J., Mbareche H., Lindsley W.G., Duchaine C. Field sampling of indoor bioaerosols. Aerosol Sci. Tech. 2020;54:572–584. doi: 10.1080/02786826.2019.1688759. [DOI] [PMC free article] [PubMed] [Google Scholar]
- Cui Y., Zhang Z.-F., Froines J., Zhao J., Wang H., Yu S.-Z., Detels R. Air pollution and case fatality of SARS in the People's Republic of China: an ecologic study. Environ. Health. 2003;2:1–5. doi: 10.1186/1476-069X-2-15. [DOI] [PMC free article] [PubMed] [Google Scholar]
- Cui Y., Ji D., Maenhaut W., Gao W., Zhang R., Wang Y. Levels and sources of hourly PM2.5-related elements during the control period of the COVID-19 pandemic at a rural site between Beijing and Tianjin. Sci. Total Environ. 2020;744:140840. doi: 10.1016/j.scitotenv.2020.140840. [DOI] [PMC free article] [PubMed] [Google Scholar]
- Dantas G., Siciliano B., Franca B.B., da Silva C.M., Arbilla G. The impact of COVID-19 partial lockdown on the air quality of the city of Rio de Janeiro, Brazil. Sci. Total Environ. 2020;729:139085. doi: 10.1016/j.scitotenv.2020.139085. [DOI] [PMC free article] [PubMed] [Google Scholar]
- De Gouw J., Jimenez J.L. Organic aerosols in the Earth’s atmosphere. Environ. Sci. Technol. 2009;43:7614–7618. doi: 10.1021/es9006004. [DOI] [PubMed] [Google Scholar]
- Decesari S., Sowlat M.H., Hasheminassab S., Sandrini S., Gilardoni S., Facchini M.C., Fuzzi S., Sioutas C. Enhanced toxicity of aerosol in fog conditions in the Po Valley, Italy. Atmos. Chem. Phys. 2017;17:7721–7731. [Google Scholar]
- Di Carlo P., Brune W.H., Martinez M., Harder H., Lesher R., Ren X., Thornberry T., Carroll M.A., Young V., Shepson P.B. Missing OH reactivity in a forest: Evidence for unknown reactive biogenic VOCs. Science. 2004;304:722–725. doi: 10.1126/science.1094392. [DOI] [PubMed] [Google Scholar]
- Ding Z., Qian H., Xu B., Huang Y., Miao T., Yen H.-L., Xiao S., Cui L., Wu X., Shao W. Toilets dominate environmental detection of severe acute respiratory syndrome coronavirus 2 in a hospital. Sci. Total Environ. 2020;753:141710. doi: 10.1016/j.scitotenv.2020.141710. [DOI] [PMC free article] [PubMed] [Google Scholar]
- Domínguez-Amarillo S., Fernández-Agüera J., Cesteros-García S., González-Lezcano R.A. Bad air can also kill: residential indoor air quality and pollutant exposure risk during the COVID-19 crisis. Int. J. Environ. Res. Public Health. 2020;17:7183. doi: 10.3390/ijerph17197183. [DOI] [PMC free article] [PubMed] [Google Scholar]
- Douwes J., Thorne P., Pearce N., Heederik D. Bioaerosol health effects and exposure assessment: progress and prospects. Ann. Occup. Hyg. 2003;47:187–200. doi: 10.1093/annhyg/meg032. [DOI] [PubMed] [Google Scholar]
- Du W., Wang G. Indoor air pollution was nonnegligible during COVID-19 lockdown. Aerosol Air Qual. Res. 2020;20:1851–1855. [Google Scholar]
- Evangeliou N., Platt S.M., Eckhardt S., Lund Myhre C., Laj P., Alados-Arboledas L., Backman J., Brem B.T., Fiebig M., Flentje H., Marinoni A., Pandolfi M., Yus-Dìez J., Prats N., Putaud J.P., Sellegri K., Sorribas M., Eleftheriadis K., Vratolis S., Wiedensohler A., Stohl A. Changes in black carbon emissions over Europe due to COVID-19 lockdowns. Atmos. Chem. Phys. Disc. 2020;2020:1–33. [Google Scholar]
- Faridi S., Niazi S., Sadeghi K., Naddafi K., Yavarian J., Shamsipour M., Jandaghi N.Z.S., Sadeghniiat K., Nabizadeh R., Yunesian M., Momeniha F., Mokamel A., Hassanvand M.S., MokhtariAzad T. A field indoor air measurement of SARS-CoV-2 in the patient rooms of the largest hospital in Iran. Sci. Total Environ. 2020;725:138401. doi: 10.1016/j.scitotenv.2020.138401. [DOI] [PMC free article] [PubMed] [Google Scholar]
- Fattorini D., Regoli F. Role of the chronic air pollution levels in the COVID-19 outbreak risk in Italy. Environ. Pollut. 2020;264:114732. doi: 10.1016/j.envpol.2020.114732. [DOI] [PMC free article] [PubMed] [Google Scholar]
- Ferguson L., Taylor J., Davies M., Shrubsole C., Symonds P., Dimitroulopoulou S. Exposure to indoor air pollution across socio-economic groups in high-income countries: a scoping review of the literature and a modelling methodology. Environ. Int. 2020;143:105748. doi: 10.1016/j.envint.2020.105748. [DOI] [PMC free article] [PubMed] [Google Scholar]
- Frontera A., Cianfanelli L., Vlachos K., Landoni G., Cremona G. Severe air pollution links to higher mortality in COVID-19 patients: the “double-hit” hypothesis. J. Infect. 2020;81:255–259. doi: 10.1016/j.jinf.2020.05.031. [DOI] [PMC free article] [PubMed] [Google Scholar]
- Fuzzi S., Baltensperger U., Carslaw K., Decesari S., Denier van der Gon H., Facchini M.C., Fowler D., Koren I., Langford B., Lohmann U. Particulate matter, air quality and climate: lessons learned and future needs. Atmos. Chem. Phys. 2015;15:8217–8299. [Google Scholar]
- Gautam S. The influence of COVID-19 on air quality in India: A boon or inutile. Bull. Environ. Contam. Toxicol. 2020;104:724–726. doi: 10.1007/s00128-020-02877-y. [DOI] [PMC free article] [PubMed] [Google Scholar]
- Georgakopoulos D., Després V., Fröhlich-Nowoisky J., Psenner R., Ariya P., Pósfai M., Ahern H., Moffett B., Hill T. Microbiology and atmospheric processes: biological, physical and chemical characterization of aerosol particles. Biogeosciences. 2009;6:721–737. [Google Scholar]
- Giani P., Castruccio S., Anav A., Howard D., Hu W., Crippa P. Short-term and long-term health impacts of air pollution reductions from COVID-19 lockdowns in China and Europe: a modelling study. Lancet Planet. Health. 2020;4:e474–e482. doi: 10.1016/S2542-5196(20)30224-2. [DOI] [PMC free article] [PubMed] [Google Scholar]
- Gordon S.B., Bruce N.G., Grigg J., Hibberd P.L., Kurmi O.P., Lam K.-b.H., Mortimer K., Asante K.P., Balakrishnan K., Balmes J. Respiratory risks from household air pollution in low and middle income countries. Lancet Respir. Med. 2014;2:823–860. doi: 10.1016/S2213-2600(14)70168-7. [DOI] [PMC free article] [PubMed] [Google Scholar]
- Guo Z.-D., Wang Z.-Y., Zhang S.-F., Li X., Li L., Li C., Cui Y., Fu R.-B., Dong Y.-Z., Chi X.-Y. Aerosol and surface distribution of severe acute respiratory syndrome coronavirus 2 in hospital wards, Wuhan, China, 2020. Emerg. Infect. Dis. 2020;26:10.3201. doi: 10.3201/eid2607.200885. [DOI] [PMC free article] [PubMed] [Google Scholar]
- Guo M., Xu P., Xiao T., He R., Dai M., Zhang Y. Review and comparison of HVAC operation guidelines in different countries during the COVID-19 pandemic. Build. Environ. 2021;187:107368. doi: 10.1016/j.buildenv.2020.107368. [DOI] [PMC free article] [PubMed] [Google Scholar]
- Hallquist M., Wenger J.C., Baltensperger U., Rudich Y., Simpson D., Claeys M., Dommen J., Donahue N.M., George C., Goldstein A. The formation, properties and impact of secondary organic aerosol: current and emerging issues. Atmos. Chem. Phys. 2009;9:5155–5236. [Google Scholar]
- Han C., Hong Y.-C. Decrease in ambient fine particulate matter during COVID-19 crisis and corresponding health benefits in Seoul, Korea. Int. J. Environ. Res. Public Health. 2020;17:5279. doi: 10.3390/ijerph17155279. [DOI] [PMC free article] [PubMed] [Google Scholar]
- Han Y., Lam J.C.K., Li V.O.K., Guo P., Zhang Q., Wang A., Crowcroft J., Wang S., Fu J., Gilani Z., Downey J. The Effects of Outdoor Air Pollution Concentrations and Lockdowns on Covid-19 Infections in Wuhan and Other Provincial Capitals in China. Preprints. 2020 doi: 10.20944/preprints202003.0364.v1. 2020030364. [DOI] [Google Scholar]
- He J., Gong S., Yu Y., Yu L., Wu L., Mao H., Song C., Zhao S., Liu H., Li X., Li R. Air pollution characteristics and their relation to meteorological conditions during 2014–2015 in major Chinese cities. Environ. Pollut. 2017;223:484–496. doi: 10.1016/j.envpol.2017.01.050. [DOI] [PubMed] [Google Scholar]
- He G., Pan Y., Tanaka T. The short-term impacts of COVID-19 lockdown on urban air pollution in China. Nat. Sustain. 2020;3:1005–1011. [Google Scholar]
- He P., Liang J., Qiu Y.L., Li Q., Xing B. Increase in domestic electricity consumption from particulate air pollution. Nat. Energy. 2020;5:985–995. [Google Scholar]
- Hopke P.K. Review of receptor modeling methods for source apportionment. J. Air Waste Manage. Assoc. 2016;66:237–259. doi: 10.1080/10962247.2016.1140693. [DOI] [PubMed] [Google Scholar]
- Huang C., Wang Y., Li X., Ren L., Zhao J., Hu Y., Zhang L., Fan G., Xu J., Gu X. Clinical features of patients infected with 2019 novel coronavirus in Wuhan, China. The Lancet. 2020;395:497–506. doi: 10.1016/S0140-6736(20)30183-5. [DOI] [PMC free article] [PubMed] [Google Scholar]
- Huang L., Sun J., Jin L., Brown N.J., Hu J. Strategies to reduce PM2.5 and O3 together during late summer and early fall in San Joaquin Valley, California. Atmos. Res. 2021;258:105633. [Google Scholar]
- Huang X., Ding A., Gao J., Zheng B., Zhou D., Qi X., Tang R., Wang J., Ren C., Nie W., Chi X., Xu Z., Chen L., Li Y., Che F., Pang N., Wang H., Tong D., Qin W., Cheng W., Liu W., Fu Q., Liu B., Chai F., Davis S.J., Zhang Q., He K. Enhanced secondary pollution offset reduction of primary emissions during COVID-19 lockdown in China. Natl. Sci. Rev. 2021;8 doi: 10.1093/nsr/nwaa137. nwaa137. [DOI] [PMC free article] [PubMed] [Google Scholar]
- Hudda N., Simon M.C., Patton A.P., Durant J.L. Reductions in traffic-related black carbon and ultrafine particle number concentrations in an urban neighborhood during the COVID-19 pandemic. Sci. Total Environ. 2020;742:140931. doi: 10.1016/j.scitotenv.2020.140931. [DOI] [PMC free article] [PubMed] [Google Scholar]
- Humbal C., Gautam S., Trivedi U. A review on recent progress in observations, and health effects of bioaerosols. Environ. Int. 2018;118:189–193. doi: 10.1016/j.envint.2018.05.053. [DOI] [PubMed] [Google Scholar]
- Hwang S.E., Chang J.H., Oh B., Heo J. Possible aerosol transmission of COVID-19 associated with an outbreak in an apartment in Seoul, South Korea, 2020. Int. J. Infect. Dis. 2021;104:73–76. doi: 10.1016/j.ijid.2020.12.035. [DOI] [PMC free article] [PubMed] [Google Scholar]
- Isaifan R.J. The dramatic impact of Coronavirus outbreak on air quality: has it saved as much as it has killed so far? Global J. Environ. Sci. Manage. 2020;6:275–288. [Google Scholar]
- Ito T., Bekki K., Fujitani Y., Hirano S. The toxicological analysis of secondary organic aerosol in human lung epithelial cells and macrophages. Environ. Sci. Pollut. Res. 2019;26:22747–22755. doi: 10.1007/s11356-019-05317-5. [DOI] [PubMed] [Google Scholar]
- James C., Bernstein D.I., Cox J., Ryan P., Wolfe C., Jandarov R., Newman N., Indugula R., Reponen T. HEPA filtration improves asthma control in children exposed to traffic-related airborne particles. Indoor Air. 2020;30:235–243. doi: 10.1111/ina.12625. [DOI] [PMC free article] [PubMed] [Google Scholar]
- Jayne J.T., Leard D.C., Zhang X., Davidovits P., Smith K.A., Kolb C.E., Worsnop D.R. Development of an aerosol mass spectrometer for size and composition analysis of submicron particles. Aerosol Sci. Tech. 2000;33:49–70. [Google Scholar]
- Jefferson T., Foxlee R., Del Mar C., Dooley L., Ferroni E., Hewak B., Prabhala A., Nair S., Rivetti A. Physical interventions to interrupt or reduce the spread of respiratory viruses: systematic review. Bmj. 2008;336:77–80. doi: 10.1136/bmj.39393.510347.BE. [DOI] [PMC free article] [PubMed] [Google Scholar]
- Jia M., Zhao T., Cheng X., Gong S., Zhang X., Tang L., Liu D., Wu X., Wang L., Chen Y. Inverse relations of PM2.5 and O3 in air compound pollution between cold and hot seasons over an urban area of east China. Atmosphere. 2017;8:59. [Google Scholar]
- Jia H., Huo J., Fu Q., Duan Y., Lin Y., Jin X., Hu X., Cheng J. Insights into chemical composition, abatement mechanisms and regional transport of atmospheric pollutants in the Yangtze River Delta region, China during the COVID-19 outbreak control period. Environ. Pollut. 2020;267:115612. doi: 10.1016/j.envpol.2020.115612. [DOI] [PMC free article] [PubMed] [Google Scholar]
- Jiang Y., Wang H., Chen Y., He J., Chen L., Liu Y., Hu X., Li A., Liu S., Zhang P., Zou H., Hua S. Clinical data on hospital environmental hygiene monitoring and medical staff protection during the coronavirus disease 2019 outbreak. medRxiv. 2020 doi: 10.1101/2020.02.25.20028043. [DOI] [Google Scholar]
- Jimenez J.L., Canagaratna M.R., Donahue N.M., Prevot A.S.H., Zhang Q., Kroll J.H., DeCarlo P.F., Allan J.D., Coe H., Ng N.L. Evolution of organic aerosols in the atmosphere. Science. 2009;326:1525–1529. doi: 10.1126/science.1180353. [DOI] [PubMed] [Google Scholar]
- Jonson J.E., Borken-Kleefeld J., Simpson D., Nyíri A., Posch M., Heyes C. Impact of excess NOx emissions from diesel cars on air quality, public health and eutrophication in Europe. Environ. Res. Lett. 2017;12 [Google Scholar]
- Kabera T., Bartington S., Uwanyirigira C., Abimana P., Pope F. Indoor PM2.5 characteristics and CO concentration in households using biomass fuel in Kigali, Rwanda. Int. J. Environ. Stud. 2020:1–14. [Google Scholar]
- Kaliszewski M., Włodarski M., Młyńczak J., Kopczyński K. Comparison of low-cost particulate matter sensors for indoor air monitoring during COVID-19 lockdown. Sensors. 2020;20:7290. doi: 10.3390/s20247290. [DOI] [PMC free article] [PubMed] [Google Scholar]
- Kanniah K.D., Kamarul Zaman N.A.F., Kaskaoutis D.G., Latif M.T. COVID-19's impact on the atmospheric environment in the Southeast Asia region. Sci. Total Environ. 2020;736:139658. doi: 10.1016/j.scitotenv.2020.139658. [DOI] [PMC free article] [PubMed] [Google Scholar]
- Kansal A. Sources and reactivity of NMHCs and VOCs in the atmosphere: a review. J. Hazard. Mater. 2009;166:17–26. doi: 10.1016/j.jhazmat.2008.11.048. [DOI] [PubMed] [Google Scholar]
- Kenarkoohi A., Noorimotlagh Z., Falahi S., Amarloei A., Mirzaee S.A., Pakzad I., Bastani E. Hospital indoor air quality monitoring for the detection of SARS-CoV-2 (COVID-19) virus. Sci. Total Environ. 2020;748:141324. doi: 10.1016/j.scitotenv.2020.141324. [DOI] [PMC free article] [PubMed] [Google Scholar]
- Kerimray A., Baimatova N., Ibragimova O.P., Bukenov B., Kenessov B., Plotitsyn P., Karaca F. Assessing air quality changes in large cities during COVID-19 lockdowns: the impacts of traffic-free urban conditions in Almaty, Kazakhstan. Sci. Total Environ. 2020;730:139179. doi: 10.1016/j.scitotenv.2020.139179. [DOI] [PMC free article] [PubMed] [Google Scholar]
- Khanh N.C., Thai P.Q., Quach H.-L., Thi N.-A.H., Dinh P.C., Duong T.N., Mai L.T.Q., Nghia N.D., Tu T.A., Quang L.N. Transmission of SARS-CoV 2 during long-haul flight. Emerg. Infect. Dis. 2020;26:2617. doi: 10.3201/eid2611.203299. [DOI] [PMC free article] [PubMed] [Google Scholar]
- Kim K.-H., Kabir E., Jahan S.A. Airborne bioaerosols and their impact on human health. J. Environ. Sci. 2018;67:23–35. doi: 10.1016/j.jes.2017.08.027. [DOI] [PMC free article] [PubMed] [Google Scholar]
- Klepeis N.E., Nelson W.C., Ott W.R., Robinson J.P., Tsang A.M., Switzer P., Behar J.V., Hern S.C., Engelmann W.H. The National Human Activity Pattern Survey (NHAPS): a resource for assessing exposure to environmental pollutants. J. Expo. Sci. Environ. Epidemiol. 2001;11:231–252. doi: 10.1038/sj.jea.7500165. [DOI] [PubMed] [Google Scholar]
- Kohanski M.A., Lo L.J., Waring M.S. Review of indoor aerosol generation, transport, and control in the context of COVID-19. Int. Forum Allergy Rhinol. 2020;10:1173–1179. doi: 10.1002/alr.22661. [DOI] [PMC free article] [PubMed] [Google Scholar]
- Krecl P., Targino A.C., Oukawa G.Y., Cassino Junior R.P. Drop in urban air pollution from COVID-19 pandemic: policy implications for the megacity of São Paulo. Environ. Pollut. 2020;265:114883. doi: 10.1016/j.envpol.2020.114883. [DOI] [PMC free article] [PubMed] [Google Scholar]
- Kroll J.H., Heald C.L., Cappa C.D., Farmer D.K., Fry J.L., Murphy J.G., Steiner A.L. The complex chemical effects of COVID-19 shutdowns on air quality. Nat. Chem. 2020;12:777–779. doi: 10.1038/s41557-020-0535-z. [DOI] [PubMed] [Google Scholar]
- Kumar P., Druckman A., Gallagher J., Gatersleben B., Allison S., Eisenman T.S., Hoang U., Hama S., Tiwari A., Sharma A. The nexus between air pollution, green infrastructure and human health. Environ. Int. 2019;133:105181. doi: 10.1016/j.envint.2019.105181. [DOI] [PubMed] [Google Scholar]
- Kumar P., Hama S., Omidvarborna H., Sharma A., Sahani J., Abhijith K.V., Debele S.E., Zavala-Reyes J.C., Barwise Y., Tiwari A. Temporary reduction in fine particulate matter due to ‘anthropogenic emissions switch-off’ during COVID-19 lockdown in Indian cities. Sustain. Cities Soc. 2020;62:102382. doi: 10.1016/j.scs.2020.102382. [DOI] [PMC free article] [PubMed] [Google Scholar]
- Le T., Wang Y., Liu L., Yang J., Yung Y.L., Li G., Seinfeld J.H. Unexpected air pollution with marked emission reductions during the COVID-19 outbreak in China. Science. 2020;369:702. doi: 10.1126/science.abb7431. [DOI] [PMC free article] [PubMed] [Google Scholar]
- Lednicky J.A., Lauzard M., Fan Z.H., Jutla A., Tilly T.B., Gangwar M., Usmani M., Shankar S.N., Mohamed K., Eiguren-Fernandez A. Viable SARS-CoV-2 in the air of a hospital room with COVID-19 patients. Int. J. Infect. Dis. 2020;100:476–482. doi: 10.1016/j.ijid.2020.09.025. [DOI] [PMC free article] [PubMed] [Google Scholar]
- Lelieveld J., Evans J.S., Fnais M., Giannadaki D., Pozzer A. The contribution of outdoor air pollution sources to premature mortality on a global scale. Nature. 2015;525:367–371. doi: 10.1038/nature15371. [DOI] [PubMed] [Google Scholar]
- Lelieveld J., Klingmüller K., Pozzer A., Burnett R., Haines A., Ramanathan V. Effects of fossil fuel and total anthropogenic emission removal on public health and climate. Proc. Natl. Acad. Sci. 2019;116:7192–7197. doi: 10.1073/pnas.1819989116. [DOI] [PMC free article] [PubMed] [Google Scholar]
- Lelieveld J., Helleis F., Borrmann S., Cheng Y., Drewnick F., Haug G., Klimach T., Sciare J., Su H., Pöschl U. Model calculations of aerosol transmission and infection risk of COVID-19 in indoor environments. Int. J. Environ. Res. Public Health. 2020;17:8114. doi: 10.3390/ijerph17218114. [DOI] [PMC free article] [PubMed] [Google Scholar]
- Leung N.H.L., Chu D.K.W., Shiu E.Y.C., Chan K.-H., McDevitt J.J., Hau B.J.P., Yen H.-L., Li Y., Ip D.K.M., Peiris J.S.M., Seto W.-H., Leung G.M., Milton D.K., Cowling B.J. Respiratory virus shedding in exhaled breath and efficacy of face masks. Nat. Med. 2020;26:676–680. doi: 10.1038/s41591-020-0843-2. [DOI] [PMC free article] [PubMed] [Google Scholar]
- Lewis D. Mounting evidence suggests coronavirus is airborne—but health advice has not caught up. Nature. 2020;583:510–513. doi: 10.1038/d41586-020-02058-1. [DOI] [PubMed] [Google Scholar]
- Lewtas J. Air pollution combustion emissions: characterization of causative agents and mechanisms associated with cancer, reproductive, and cardiovascular effects. Mutat. Res. Rev. Mutat. Res. 2007;636:95–133. doi: 10.1016/j.mrrev.2007.08.003. [DOI] [PubMed] [Google Scholar]
- Li J., Tartarini F. Changes in air quality during the COVID-19 lockdown in Singapore and associations with human mobility trends. Aerosol Air Qual. Res. 2020;20:1748–1758. [Google Scholar]
- Li Y., Huang X., Yu I., Wong T., Qian H. Role of air distribution in SARS transmission during the largest nosocomial outbreak in Hong Kong. Indoor Air. 2005;15:83–95. doi: 10.1111/j.1600-0668.2004.00317.x. [DOI] [PubMed] [Google Scholar]
- Li K., Jacob D.J., Liao H., Zhu J., Shah V., Shen L., Bates K.H., Zhang Q., Zhai S. A two-pollutant strategy for improving ozone and particulate air quality in China. Nat. Geosci. 2019;12:906–910. [Google Scholar]
- Liang X., Zhang S., Wu Y., Xing J., He X., Zhang K.M., Wang S., Hao J. Air quality and health benefits from fleet electrification in China. Nat. Sustain. 2019;2:962–971. [Google Scholar]
- Lindsley W.G., Noti J.D., Blachere F.M., Szalajda J.V., Beezhold D.H. Efficacy of face shields against cough aerosol droplets from a cough simulator. J. Occup. Environ. Hyg. 2014;11:509–518. doi: 10.1080/15459624.2013.877591. [DOI] [PMC free article] [PubMed] [Google Scholar]
- Liu T., Wang X., Hu J., Wang Q., An J., Gong K., Sun J., Li L., Qin M., Li J., Tian J., Huang Y., Liao H., Zhou M., Hu Q., Yan R., Wang H., Huang C. Driving forces of changes in air quality during the COVID-19 lockdown period in the Yangtze River Delta Region, China. Environ. Sci. Technol. Lett. 2020;7:779–786. doi: 10.1021/acs.estlett.0c00511. [DOI] [PubMed] [Google Scholar]
- Liu W., Tao Z.-W., Wang L., Yuan M.-L., Liu K., Zhou L., Wei S., Deng Y., Liu J., Liu H.-G. Analysis of factors associated with disease outcomes in hospitalized patients with 2019 novel coronavirus disease. Chin. Med. J. (Engl.) 2020;133:1032–1038. doi: 10.1097/CM9.0000000000000775. [DOI] [PMC free article] [PubMed] [Google Scholar]
- Liu Y., Ning Z., Chen Y., Guo M., Liu Y., Gali N.K., Sun L., Duan Y., Cai J., Westerdahl D., Liu X., Xu K., Ho K.-f., Kan H., Fu Q., Lan K. Aerodynamic analysis of SARS-CoV-2 in two Wuhan hospitals. Nature. 2020;582:557–560. doi: 10.1038/s41586-020-2271-3. [DOI] [PubMed] [Google Scholar]
- Lodovici M., Bigagli E. Oxidative stress and air pollution exposure. J. Toxicol. 2011;2011:487074. doi: 10.1155/2011/487074. [DOI] [PMC free article] [PubMed] [Google Scholar]
- Lu J., Gu J., Li K., Xu C., Su W., Lai Z., Zhou D., Yu C., Xu B., Yang Z. COVID-19 outbreak associated with air conditioning in restaurant, Guangzhou, China, 2020. Emerg. Infect. Dis. 2020;26:1628–1631. doi: 10.3201/eid2607.200764. [DOI] [PMC free article] [PubMed] [Google Scholar]
- MacIntyre C.R., Chughtai A.A., Rahman B., Peng Y., Zhang Y., Seale H., Wang X., Wang Q. The efficacy of medical masks and respirators against respiratory infection in healthcare workers. Influenza Other Respi. Viruses. 2017;11:511–517. doi: 10.1111/irv.12474. [DOI] [PMC free article] [PubMed] [Google Scholar]
- Mahato S., Pal S., Ghosh K.G. Effect of lockdown amid COVID-19 pandemic on air quality of the megacity Delhi, India. Sci. Total Environ. 2020;730:139086. doi: 10.1016/j.scitotenv.2020.139086. [DOI] [PMC free article] [PubMed] [Google Scholar]
- Matz C.J., Stieb D.M., Brion O. Urban-rural differences in daily time-activity patterns, occupational activity and housing characteristics. Environ. Health. 2015;14:88. doi: 10.1186/s12940-015-0075-y. [DOI] [PMC free article] [PubMed] [Google Scholar]
- Melikov A.K., Ai Z.T., Markov D.G. Intermittent occupancy combined with ventilation: an efficient strategy for the reduction of airborne transmission indoors. Sci. Total Environ. 2020;744:140908. doi: 10.1016/j.scitotenv.2020.140908. [DOI] [PMC free article] [PubMed] [Google Scholar]
- Miller S.L., Nazaroff W.W., Jimenez J.L., Boerstra A., Buonanno G., Dancer S.J., Kurnitski J., Marr L.C., Morawska L., Noakes C. Transmission of SARS-CoV-2 by inhalation of respiratory aerosol in the Skagit Valley Chorale superspreading event. Indoor Air. 2021;31:314–323. doi: 10.1111/ina.12751. [DOI] [PMC free article] [PubMed] [Google Scholar]
- Mitze T., Kosfeld R., Rode J., Wälde K. Face masks considerably reduce COVID-19 cases in Germany. Proc. Natl. Acad. Sci. 2020;117:32293–32301. doi: 10.1073/pnas.2015954117. [DOI] [PMC free article] [PubMed] [Google Scholar]
- Miyazaki K., Bowman K., Sekiya T., Jiang Z., Chen X., Eskes H., Ru M., Zhang Y., Shindell D. Air quality response in China linked to the 2019 novel coronavirus (COVID-19) lockdown. Geophys. Res. Lett. 2020;47 doi: 10.1029/2020GL089252. e2020GL089252. [DOI] [PMC free article] [PubMed] [Google Scholar]
- Mohd Nadzir M.S., Ooi M.C.G., Alhasa K.M., Bakar M.A.A., Mohtar A.A.A., Nor M.F.F.M., Latif M.T., Hamid H.H.A., Ali S.H.M., Ariff N.M., Anuar J., Ahamad F., Azhari A., Hanif N.M., Subhi M.A., Othman M., Nor M.Z.M. The impact of movement control order (MCO) during pandemic COVID-19 on local air quality in an urban area of Klang Valley, Malaysia. Aerosol Air Qual. Res. 2020;20:1237–1248. [Google Scholar]
- Monks P.S. Gas-phase radical chemistry in the troposphere. Chem. Soc. Rev. 2005;34:376–395. doi: 10.1039/b307982c. [DOI] [PubMed] [Google Scholar]
- Morawska L., Cao J. Airborne transmission of SARS-CoV-2: the world should face the reality. Environ. Int. 2020;139:105730. doi: 10.1016/j.envint.2020.105730. [DOI] [PMC free article] [PubMed] [Google Scholar]
- Morawska L., Afshari A., Bae G.N., Buonanno G., Chao C.Y.H., Hänninen O., Hofmann W., Isaxon C., Jayaratne E.R., Pasanen P. Indoor aerosols: from personal exposure to risk assessment. Indoor Air. 2013;23:462–487. doi: 10.1111/ina.12044. [DOI] [PubMed] [Google Scholar]
- Morawska L., Ayoko G.A., Bae G.N., Buonanno G., Chao C.Y.H., Clifford S., Fu S.C., Hänninen O., He C., Isaxon C. Airborne particles in indoor environment of homes, schools, offices and aged care facilities: the main routes of exposure. Environ. Int. 2017;108:75–83. doi: 10.1016/j.envint.2017.07.025. [DOI] [PubMed] [Google Scholar]
- Morawska L., Tang J.W., Bahnfleth W., Bluyssen P.M., Boerstra A., Buonanno G., Cao J., Dancer S., Floto A., Franchimon F. How can airborne transmission of COVID-19 indoors be minimised? Environ. Int. 2020;142:105832. doi: 10.1016/j.envint.2020.105832. [DOI] [PMC free article] [PubMed] [Google Scholar]
- Nakada L.Y.K., Urban R.C. COVID-19 pandemic: impacts on the air quality during the partial lockdown in Sao Paulo state, Brazil. Sci. Total Environ. 2020;730:139087. doi: 10.1016/j.scitotenv.2020.139087. [DOI] [PMC free article] [PubMed] [Google Scholar]
- Nicola M., Alsafi Z., Sohrabi C., Kerwan A., Al-Jabir A., Iosifidis C., Agha M., Agha R. The socio-economic implications of the coronavirus pandemic (COVID-19): A review. Int. J. Surg. 2020;78:185. doi: 10.1016/j.ijsu.2020.04.018. [DOI] [PMC free article] [PubMed] [Google Scholar]
- Nie D., Shen F., Wang J., Ma X., Li Z., Ge P., Ou Y., Jiang Y., Chen M., Chen M., Wang T., Ge X. Changes of air quality and its associated health and economic burden in 31 provincial capital cities in China during COVID-19 pandemic. Atmos. Res. 2021;249:105328. doi: 10.1016/j.atmosres.2020.105328. [DOI] [PMC free article] [PubMed] [Google Scholar]
- Nishiura H., Oshitani H., Kobayashi T., Saito T., Sunagawa T., Matsui T., Wakita T., MHLW COVID-19 Response Team, Suzuki M. Closed environments facilitate secondary transmission of coronavirus disease 2019 (COVID-19) medRxiv. 2020 doi: 10.1101/2020.02.28.20029272. [DOI] [Google Scholar]
- Nuvolone D., Petri D., Voller F. The effects of ozone on human health. Environ. Sci. Pollut. Res. 2018;25:8074–8088. doi: 10.1007/s11356-017-9239-3. [DOI] [PubMed] [Google Scholar]
- Nwanaji-Enwerem J.C., Allen J.G., Beamer P.I. Another invisible enemy indoors: COVID-19, human health, the home, and United States indoor air policy. J. Expo. Sci. Environ. Epidemiol. 2020;30:773–775. doi: 10.1038/s41370-020-0247-x. [DOI] [PMC free article] [PubMed] [Google Scholar]
- Ong S.W.X., Tan Y.K., Chia P.Y., Lee T.H., Ng O.T., Wong M.S.Y., Marimuthu K. Air, surface environmental, and personal protective equipment contamination by severe acute respiratory syndrome coronavirus 2 (SARS-CoV-2) from a symptomatic patient. Jama. 2020;323:1610–1612. doi: 10.1001/jama.2020.3227. [DOI] [PMC free article] [PubMed] [Google Scholar]
- Øvrevik J., Refsnes M., Låg M., Holme J.A., Schwarze P.E. Activation of proinflammatory responses in cells of the airway mucosa by particulate matter: oxidant-and non-oxidant-mediated triggering mechanisms. Biomolecules. 2015;5:1399–1440. doi: 10.3390/biom5031399. [DOI] [PMC free article] [PubMed] [Google Scholar]
- Patel S., Sankhyan S., Boedicker E.K., DeCarlo P.F., Farmer D.K., Goldstein A.H., Katz E.F., Nazaroff W.W., Tian Y., Vanhanen J., Vance M.E. Indoor particulate matter during HOMEChem: concentrations, size distributions, and exposures. Environ. Sci. Technol. 2020;54:7107–7116. doi: 10.1021/acs.est.0c00740. [DOI] [PubMed] [Google Scholar]
- Pavagadhi S., Betha R., Venkatesan S., Balasubramanian R., Hande M.P. Physicochemical and toxicological characteristics of urban aerosols during a recent Indonesian biomass burning episode. Environ. Sci. Pollut. Res. 2013;20:2569–2578. doi: 10.1007/s11356-012-1157-9. [DOI] [PubMed] [Google Scholar]
- Pei Z., Han G., Ma X., Su H., Gong W. Response of major air pollutants to COVID-19 lockdowns in China. Sci. Total Environ. 2020;743:140879. doi: 10.1016/j.scitotenv.2020.140879. [DOI] [PMC free article] [PubMed] [Google Scholar]
- Piccoli A., Agresti V., Balzarini A., Bedogni M., Bonanno R., Collino E., Colzi F., Lacavalla M., Lanzani G., Pirovano G., Riva F., Riva G.M., Toppetti A.M. Modeling the effect of COVID-19 lockdown on mobility and NO2 concentration in the Lombardy Region. Atmosphere. 2020;11:1319. [Google Scholar]
- Pollard S.L., D’Ann L.W., Breysse P.N., Baron P.A., Grajeda L.M., Gilman R.H., Miranda J.J., Checkley W. A cross-sectional study of determinants of indoor environmental exposures in households with and without chronic exposure to biomass fuel smoke. Environ. Health. 2014;13:1–12. doi: 10.1186/1476-069X-13-21. [DOI] [PMC free article] [PubMed] [Google Scholar]
- Pöschl U. Atmospheric aerosols: composition, transformation, climate and health effects. Angew. Chem. Int. Ed. 2005;44:7520–7540. doi: 10.1002/anie.200501122. [DOI] [PubMed] [Google Scholar]
- Pusede S.E., Cohen R.C. On the observed response of ozone to NOx and VOC reactivity reductions in San Joaquin Valley California 1995–present. Atmos. Chem. Phys. 2012;12:8323–8339. [Google Scholar]
- Rabl A., De Nazelle A. Benefits of shift from car to active transport. Transport Policy. 2012;19:121–131. [Google Scholar]
- Ramanathan V., Carmichael G. Global and regional climate changes due to black carbon. Nat. Geosci. 2008;1:221–227. [Google Scholar]
- Resmi C.T., Nishanth T., Kumar M.K.S., Manoj M.G., Balachandramohan M., Valsaraj K.T. Air quality improvement during triple-lockdown in the coastal city of Kannur, Kerala to combat Covid-19 transmission. PeerJ. 2020;8 doi: 10.7717/peerj.9642. [DOI] [PMC free article] [PubMed] [Google Scholar]
- Rhys-Tyler G.A., Legassick W., Bell M.C. The significance of vehicle emissions standards for levels of exhaust pollution from light vehicles in an urban area. Atmos. Environ. 2011;45:3286–3293. [Google Scholar]
- Rodríguez-Urrego D., Rodríguez-Urrego L. Air quality during the COVID-19: PM2.5 analysis in the 50 most polluted capital cities in the world. Environ. Pollut. 2020;266:115042. doi: 10.1016/j.envpol.2020.115042. [DOI] [PMC free article] [PubMed] [Google Scholar]
- Rosenthal J., Quinn A., Grieshop A.P., Pillarisetti A., Glass R.I. Clean cooking and the SDGs: integrated analytical approaches to guide energy interventions for health and environment goals. Energy Sustain. Dev. 2018;42:152–159. doi: 10.1016/j.esd.2017.11.003. [DOI] [PMC free article] [PubMed] [Google Scholar]
- Rossi R., Ceccato R., Gastaldi M. Effect of road traffic on air pollution. Experimental evidence from COVID-19 lockdown. Sustainability. 2020;12:8984. [Google Scholar]
- Saha J., Chouhan P. Indoor air pollution (IAP) and pre-existing morbidities among under-5 children in India: are risk factors of coronavirus disease (COVID-19)? Environ. Pollut. (Barking, Essex: 1987) 2020;266:115250. doi: 10.1016/j.envpol.2020.115250. [DOI] [PMC free article] [PubMed] [Google Scholar]
- Santarpia J.L., Rivera D.N., Herrera V.L., Morwitzer M.J., Creager H.M., Santarpia G.W., Crown K.K., Brett-Major D.M., Schnaubelt E.R., Broadhurst M.J. Aerosol and surface contamination of SARS-CoV-2 observed in quarantine and isolation care. Sci. Rep. 2020;10:1–8. doi: 10.1038/s41598-020-69286-3. [DOI] [PMC free article] [PubMed] [Google Scholar]
- Sathe Y., Gupta P., Bawase M., Lamsal L., Patadia F., Thipse S. Surface and satellite observations of air pollution in India during COVID-19 lockdown: implication to air quality. Sustain. Cities Soc. 2021;66:102688. doi: 10.1016/j.scs.2020.102688. [DOI] [PMC free article] [PubMed] [Google Scholar]
- See S., Balasubramanian R. Risk assessment of exposure to indoor aerosols associated with Chinese cooking. Environ. Res. 2006;102:197–204. doi: 10.1016/j.envres.2005.12.013. [DOI] [PubMed] [Google Scholar]
- See S.W., Balasubramanian R. Chemical characteristics of fine particles emitted from different gas cooking methods. Atmos. Environ. 2008;42:8852–8862. [Google Scholar]
- See S.W., Balasubramanian R., Wang W. A study of the physical, chemical, and optical properties of ambient aerosol particles in Southeast Asia during hazy and nonhazy days. J. Geophys. Res. Atmos. 2006;111 [Google Scholar]
- See S.W., Balasubramanian R., Rianawati E., Karthikeyan S., Streets D.G. Characterization and source apportionment of particulate matter≤ 2.5 μm in Sumatra, Indonesia, during a recent peat fire episode. Environ. Sci. Technol. 2007;41:3488–3494. doi: 10.1021/es061943k. [DOI] [PubMed] [Google Scholar]
- See S.W., Wang Y.H., Balasubramanian R. Contrasting reactive oxygen species and transition metal concentrations in combustion aerosols. Environ. Res. 2007;103:317–324. doi: 10.1016/j.envres.2006.08.012. [DOI] [PubMed] [Google Scholar]
- Seinfeld J.H., Pandis S.N. John Wiley & Sons; 2016. Atmospheric chemistry and physics: from air pollution to climate change. [Google Scholar]
- Setti L., Passarini F., De Gennaro G., Barbieri P., Pallavicini A., Ruscio M., Piscitelli P., Colao A., Miani A. Searching for SARS-COV-2 on particulate matter: a possible early indicator of COVID-19 epidemic recurrence. Int. J. Environ. Res. Public Health. 2020;17:2986. doi: 10.3390/ijerph17092986. [DOI] [PMC free article] [PubMed] [Google Scholar]
- Sharma R., Balasubramanian R. Indoor human exposure to size-fractionated aerosols during the 2015 Southeast Asian smoke haze and assessment of exposure mitigation strategies. Environ. Res. Lett. 2017;12:114026. [Google Scholar]
- Sharma R., Balasubramanian R. Assessment and mitigation of indoor human exposure to fine particulate matter (PM2.5) of outdoor origin in naturally ventilated residential apartments: a case study. Atmos. Environ. 2019;212:163–171. [Google Scholar]
- Sharma R., Balasubramanian R. Evaluation of the effectiveness of a portable air cleaner in mitigating indoor human exposure to cooking-derived airborne particles. Environ. Res. 2020;183:109192. doi: 10.1016/j.envres.2020.109192. [DOI] [PubMed] [Google Scholar]
- Sharma R., Hossain M.M. Household air pollution and COVID-19 risk in India: A potential concern. SocArXiv. 2020 doi: 10.31235/osf.io/4ghde. [DOI] [Google Scholar]
- Sharma S., Zhang M., Anshika, Gao J., Zhang H., Kota S.H. Effect of restricted emissions during COVID-19 on air quality in India. Sci. Total Environ. 2020;728:138878. doi: 10.1016/j.scitotenv.2020.138878. [DOI] [PMC free article] [PubMed] [Google Scholar]
- Shaughnessy R., Sextro R. What is an effective portable air cleaning device? A review. J. Occup. Environ. Hyg. 2006;3:169–181. doi: 10.1080/15459620600580129. [DOI] [PubMed] [Google Scholar]
- Shen Y., Li C., Dong H., Wang Z., Martinez L., Sun Z., Handel A., Chen Z., Chen E., Ebell M.H., Wang F., Yi B., Wang H., Wang X., Wang A., Chen B., Qi Y., Liang L., Li Y., Ling F., Chen J., Xu G. Community outbreak investigation of SARS-CoV-2 transmission among bus riders in Eastern China. JAMA Intern. Med. 2020;180:1665–1671. doi: 10.1001/jamainternmed.2020.5225. [DOI] [PMC free article] [PubMed] [Google Scholar]
- Sicard P., De Marco A., Agathokleous E., Feng Z., Xu X., Paoletti E., Rodriguez J.J.D., Calatayud V. Amplified ozone pollution in cities during the COVID-19 lockdown. Sci. Total Environ. 2020;735:139542. doi: 10.1016/j.scitotenv.2020.139542. [DOI] [PMC free article] [PubMed] [Google Scholar]
- Siciliano B., Carvalho G., da Silva C.M., Arbilla G. The impact of COVID-19 partial lockdown on primary pollutant concentrations in the atmosphere of Rio de Janeiro and Sao Paulo megacities (Brazil) Bull. Environ. Contam. Toxicol. 2020;105:2–8. doi: 10.1007/s00128-020-02907-9. [DOI] [PMC free article] [PubMed] [Google Scholar]
- Siciliano B., Dantas G., da Silva C.M., Arbilla G. Increased ozone levels during the COVID-19 lockdown: analysis for the city of Rio de Janeiro, Brazil. Sci. Total Environ. 2020;737:139765. doi: 10.1016/j.scitotenv.2020.139765. [DOI] [PMC free article] [PubMed] [Google Scholar]
- Siddiqui R., Khamis M., Ibrahim T., Khan N.A. SARS-CoV-2: disinfection strategies to prevent transmission of neuropathogens via air conditioning systems. ACS Chem. Nerosci. 2020;11:3177–3179. doi: 10.1021/acschemneuro.0c00595. [DOI] [PubMed] [Google Scholar]
- Sillman S. The relation between ozone, NOx and hydrocarbons in urban and polluted rural environments. Atmos. Environ. 1999;33:1821–1845. [Google Scholar]
- SinBerBEST . 2020. Recommendations for Singapore Buildings during COVID-19 Pandemic. [Google Scholar]
- Singer B.C., Coleman B.K., Destaillats H., Hodgson A.T., Lunden M.M., Weschler C.J., Nazaroff W.W. Indoor secondary pollutants from cleaning product and air freshener use in the presence of ozone. Atmos. Environ. 2006;40:6696–6710. doi: 10.1021/es052198z. [DOI] [PubMed] [Google Scholar]
- Singh R.P., Chauhan A. Impact of lockdown on air quality in India during COVID-19 pandemic. Air Qual. Atmos. Health. 2020;13:921–928. doi: 10.1007/s11869-020-00863-1. [DOI] [PMC free article] [PubMed] [Google Scholar]
- Snider G., Carter E., Clark S., Yang X., Ezzati M., Schauer J.J., Wiedinmyer C., Baumgartner J. Impacts of stove use patterns and outdoor air quality on household air pollution and cardiovascular mortality in southwestern China. Environ. Int. 2018;117:116–124. doi: 10.1016/j.envint.2018.04.048. [DOI] [PMC free article] [PubMed] [Google Scholar]
- Son J.-Y., Fong K.C., Heo S., Kim H., Lim C.C., Bell M.L. Reductions in mortality resulting from reduced air pollution levels due to COVID-19 mitigation measures. Sci. Total Environ. 2020;744:141012. doi: 10.1016/j.scitotenv.2020.141012. [DOI] [PMC free article] [PubMed] [Google Scholar]
- Stabile L., Buonanno G., Frattolillo A., Dell’Isola M. The effect of the ventilation retrofit in a school on CO2, airborne particles, and energy consumptions. Build. Environ. 2019;156:1–11. [Google Scholar]
- Stabile L., De Luca G., Pacitto A., Morawska L., Avino P., Buonanno G. Ultrafine particle emission from floor cleaning products. Indoor Air. 2020;31:63–73. doi: 10.1111/ina.12713. [DOI] [PubMed] [Google Scholar]
- Stadnytskyi V., Bax C.E., Bax A., Anfinrud P. The airborne lifetime of small speech droplets and their potential importance in SARS-CoV-2 transmission. Proc. Natl. Acad. Sci. 2020;117:11875–11877. doi: 10.1073/pnas.2006874117. [DOI] [PMC free article] [PubMed] [Google Scholar]
- Stewart D.R., Saunders E., Perea R.A., Fitzgerald R., Campbell D.E., Stockwell W.R. Linking air quality and human health effects models: an application to the Los Angeles air basin. Enviro. Health Insights. 2017;11:1–13. doi: 10.1177/1178630217737551. [DOI] [PMC free article] [PubMed] [Google Scholar]
- Stockwell R.E., Ballard E.L., O'Rourke P., Knibbs L.D., Morawska L., Bell S.C. Indoor hospital air and the impact of ventilation on bioaerosols: a systematic review. J. Hosp. Infect. 2019;103:175–184. doi: 10.1016/j.jhin.2019.06.016. [DOI] [PubMed] [Google Scholar]
- Stratoulias D., Nuthammachot N. Air quality development during the COVID-19 pandemic over a medium-sized urban area in Thailand. Sci. Total Environ. 2020;746:141320. doi: 10.1016/j.scitotenv.2020.141320. [DOI] [PMC free article] [PubMed] [Google Scholar]
- Sulaymon I.D., Zhang Y., Hopke P.K., Zhang Y., Hua J., Mei X. COVID-19 pandemic in Wuhan: ambient air quality and the relationships between criteria air pollutants and meteorological variables before, during, and after lockdown. Atmos. Res. 2021;250:105362. doi: 10.1016/j.atmosres.2020.105362. [DOI] [PMC free article] [PubMed] [Google Scholar]
- Sun Y., Lei L., Zhou W., Chen C., He Y., Sun J., Li Z., Xu W., Wang Q., Ji D., Fu P., Wang Z., Worsnop D.R. A chemical cocktail during the COVID-19 outbreak in Beijing, China: insights from six-year aerosol particle composition measurements during the Chinese New Year holiday. Sci. Total Environ. 2020;742:140739. doi: 10.1016/j.scitotenv.2020.140739. [DOI] [PMC free article] [PubMed] [Google Scholar]
- Tao R.-j, Cao W.-j, Li M.-h, Yang L., Dai R.-x, Luo X.-l, Liu Y., Ge B.-x, Su X., Xu J.-f. PM2.5 compromises antiviral immunity in influenza infection by inhibiting activation of NLRP3 inflammasome and expression of interferon-β. Mol. Immunol. 2020;125:178–186. doi: 10.1016/j.molimm.2020.07.001. [DOI] [PubMed] [Google Scholar]
- Thakur M., Boudewijns E.A., Babu G.R., van Schayck O.C.P. Biomass use and COVID-19: a novel concern. Environ. Res. 2020;186:109586. doi: 10.1016/j.envres.2020.109586. [DOI] [PMC free article] [PubMed] [Google Scholar]
- Tham K.W., Parshetti G.K., Balasubramanian R., Sekhar C., Cheong D.K.W. Mitigating particulate matter exposure in naturally ventilated buildings during haze episodes. Build. Environ. 2018;128:96–106. [Google Scholar]
- Tobías A., Carnerero C., Reche C., Massagué J., Via M., Minguillón M.C., Alastuey A., Querol X. Changes in air quality during the lockdown in Barcelona (Spain) one month into the SARS-CoV-2 epidemic. Sci. Total Environ. 2020;726:138540. doi: 10.1016/j.scitotenv.2020.138540. [DOI] [PMC free article] [PubMed] [Google Scholar]
- Tran P.T.M., Ngoh J.R., Balasubramanian R. Assessment of integrated personal exposure to particulate emissions in urban microenvironments: a pilot study. Aerosol Air Qual. Res. 2020;20:341–357. [Google Scholar]
- Tran P.T.M., Zhao M., Yamamoto K., Minet L., Nguyen T., Balasubramanian R. Cyclists’ personal exposure to traffic-related air pollution and its influence on bikeability. Transport. Res. Part D Transp. Environ. 2020;88:102563. [Google Scholar]
- Tran P.T.M., Adam M.G., Balasubramanian R. Assessment and mitigation of toddlers’ personal exposure to black carbon before and during the COVID-19 pandemic: a case study in Singapore. Environ. Res. 2021;202:111711. doi: 10.1016/j.envres.2021.111711. [DOI] [PMC free article] [PubMed] [Google Scholar]
- Tran P.T.M., Adam M.G., Balasubramanian R. Mitigation of indoor human exposure to airborne particles of outdoor origin in an urban environment during haze and non-haze periods. J. Hazard. Mater. 2021;403:123555. doi: 10.1016/j.jhazmat.2020.123555. [DOI] [PubMed] [Google Scholar]
- Tran P.T.M., Adam M.G., Tham K.W., Schiavon S., Pantelic J., Linden P., Sofianopoulou E., Sekhar S.C., Cheong D.K.W., Balasubramanian R. Assessment and mitigation of personal exposure to particulate air pollution in cities: an exploratory study. Sustain. Cities Soc. 2021;72:103052. [Google Scholar]
- US EPA . 2020. Air Cleaners, HVAC Filters, and Coronavirus (COVID-19) [Google Scholar]
- US EPA . 2020. Introduction to Indoor Air Quality. [Google Scholar]
- Vadrevu K.P., Eaturu A., Biswas S., Lasko K., Sahu S., Garg J.K., Justice C. Spatial and temporal variations of air pollution over 41 cities of India during the COVID-19 lockdown period. Sci. Rep. 2020;10:1–15. doi: 10.1038/s41598-020-72271-5. [DOI] [PMC free article] [PubMed] [Google Scholar]
- Van Doremalen N., Bushmaker T., Morris D.H., Holbrook M.G., Gamble A., Williamson B.N., Tamin A., Harcourt J.L., Thornburg N.J., Gerber S.I. Aerosol and surface stability of SARS-CoV-2 as compared with SARS-CoV-1. N. Engl. J. Med. 2020;382:1564–1567. doi: 10.1056/NEJMc2004973. [DOI] [PMC free article] [PubMed] [Google Scholar]
- Velraj R., Haghighat F. The contribution of dry indoor built environment on the spread of Coronavirus: data from various Indian states. Sustain. Cities Soc. 2020;62:102371. doi: 10.1016/j.scs.2020.102371. [DOI] [PMC free article] [PubMed] [Google Scholar]
- Venter Z.S., Aunan K., Chowdhury S., Lelieveld J. COVID-19 lockdowns cause global air pollution declines. Proc. Natl. Acad. Sci. 2020;117:18984–18990. doi: 10.1073/pnas.2006853117. [DOI] [PMC free article] [PubMed] [Google Scholar]
- Vitolo C., Scutari M., Ghalaieny M., Tucker A., Russell A. Modeling air pollution, climate, and health data using Bayesian networks: a case study of the English regions. Earth Space Sci. 2018;5:76–88. [Google Scholar]
- Volkamer R., Jimenez J.L., San Martini F., Dzepina K., Zhang Q., Salcedo D., Molina L.T., Worsnop D.R., Molina M.J. Secondary organic aerosol formation from anthropogenic air pollution: rapid and higher than expected. Geophys. Res. Lett. 2006;33 [Google Scholar]
- von Schneidemesser E., Monks P.S., Allan J.D., Bruhwiler L., Forster P., Fowler D., Lauer A., Morgan W.T., Paasonen P., Righi M., Sindelarova K., Sutton M.A. Chemistry and the linkages between air quality and climate change. Chem. Rev. 2015;115:3856–3897. doi: 10.1021/acs.chemrev.5b00089. [DOI] [PubMed] [Google Scholar]
- Wang J., Xu H., Guinot B., Li L., Ho S.S.H., Liu S., Li X., Cao J. Concentrations, sources and health effects of parent, oxygenated- and nitrated- polycyclic aromatic hydrocarbons (PAHs) in middle-school air in Xi'an, China. Atmos. Res. 2017;192:1–10. [Google Scholar]
- Wang Y., Gao W., Wang S., Song T., Gong Z., Ji D., Wang L., Liu Z., Tang G., Huo Y., Tian S., Li J., Li M., Yang Y., Chu B., Petäjä T., Kerminen V.-M., He H., Hao J., Kulmala M., Wang Y., Zhang Y. Contrasting trends of PM2.5 and surface-ozone concentrations in China from 2013 to 2017. Natl. Sci. Rev. 2020;7:1331–1339. doi: 10.1093/nsr/nwaa032. [DOI] [PMC free article] [PubMed] [Google Scholar]
- Wang Y., Wen Y., Wang Y., Zhang S., Zhang K.M., Zheng H., Xing J., Wu Y., Hao J. Four-month changes in air quality during and after the COVID-19 lockdown in six megacities in China. Environ. Sci. Technol. Lett. 2020;7:802–808. doi: 10.1021/acs.estlett.0c00605. [DOI] [PubMed] [Google Scholar]
- Wang H., Miao Q., Shen L., Yang Q., Wu Y., Wei H. Air pollutant variations in Suzhou during the 2019 novel coronavirus (COVID-19) lockdown of 2020: high time-resolution measurements of aerosol chemical compositions and source apportionment. Environ. Pollut. 2021;271:116298. doi: 10.1016/j.envpol.2020.116298. [DOI] [PMC free article] [PubMed] [Google Scholar]
- Wathore R., Gupta A., Bherwani H., Labhasetwar N. Understanding air and water borne transmission and survival of coronavirus: insights and way forward for SARS-CoV-2. Sci. Total Environ. 2020;749:141486. doi: 10.1016/j.scitotenv.2020.141486. [DOI] [PMC free article] [PubMed] [Google Scholar]
- Weschler C.J., Carslaw N. ACS Publications; 2018. Indoor chemistry. [DOI] [PubMed] [Google Scholar]
- WHO . WHO; Geneva, Switzerland: 2018. World Health Organization: Global Urban Ambient Air Pollution Database (update 2018)https://www.who.int/airpollution/data/cities/en/ access. [Google Scholar]
- WHO . 2020. World Health Organization: household air pollution. [Google Scholar]
- WHO World Health Organization: transmission of SARS-CoV-2: implications for infection prevention precautions. 2020. https://www.who.int/news-room/commentaries/detail/transmission-of-sars-cov-2-implications-for-infection-prevention-precautions access.
- Wolkoff P. Indoor air humidity, air quality, and health–an overview. Int. J. Hyg. Environ. Health. 2018;221:376–390. doi: 10.1016/j.ijheh.2018.01.015. [DOI] [PubMed] [Google Scholar]
- Wu C.-F., Woodward A., Li Y.-R., Kan H., Balasubramanian R., Latif M.T., Sahani M., Cheng T.-J., Chio C.-P., Taneepanichskul N. Regulation of fine particulate matter (PM2.5) in the Pacific Rim: perspectives from the APRU Global Health Program. Air Qual. Atmos. Health. 2017;10:1039–1049. [Google Scholar]
- Wu X., Nethery R.C., Sabath M.B., Braun D., Dominici F. Air pollution and COVID-19 mortality in the United States: Strengths and limitations of an ecological regression analysis. Science Advances. 2020;6(45):eabd4049. doi: 10.1126/sciadv.abd4049. [DOI] [PMC free article] [PubMed] [Google Scholar]
- Yao M., Zhang L., Ma J., Zhou L. On airborne transmission and control of SARS-Cov-2. Sci. Total Environ. 2020;731:139178. doi: 10.1016/j.scitotenv.2020.139178. [DOI] [PMC free article] [PubMed] [Google Scholar]
- Yao Y., Pan J., Liu Z., Meng X., Wang W., Kan H., Wang W. Temporal association between particulate matter pollution and case fatality rate of COVID-19 in Wuhan. Environ. Res. 2020;189:109941. doi: 10.1016/j.envres.2020.109941. [DOI] [PMC free article] [PubMed] [Google Scholar]
- Zhang L., Shao J., Lu X., Zhao Y., Hu Y., Henze D.K., Liao H., Gong S., Zhang Q. Sources and processes affecting fine particulate matter pollution over North China: an adjoint analysis of the Beijing APEC period. Environ. Sci. Technol. 2016;50:8731–8740. doi: 10.1021/acs.est.6b03010. [DOI] [PubMed] [Google Scholar]
- Zhang Q., Zheng Y., Tong D., Shao M., Wang S., Zhang Y., Xu X., Wang J., He H., Liu W., Ding Y., Lei Y., Li J., Wang Z., Zhang X., Wang Y., Cheng J., Liu Y., Shi Q., Yan L., Geng G., Hong C., Li M., Liu F., Zheng B., Cao J., Ding A., Gao J., Fu Q., Huo J., Liu B., Liu Z., Yang F., He K., Hao J. Drivers of improved PM2.5 air quality in China from 2013 to 2017. Proc. Natl. Acad. Sci. U. S. A. 2019;116:24463. doi: 10.1073/pnas.1907956116. [DOI] [PMC free article] [PubMed] [Google Scholar]
- Zhang R., Li Y., Zhang A.L., Wang Y., Molina M.J. Identifying airborne transmission as the dominant route for the spread of COVID-19. Proc. Natl. Acad. Sci. 2020;117:14857–14863. doi: 10.1073/pnas.2009637117. [DOI] [PMC free article] [PubMed] [Google Scholar]
- Zhang Y., Liu X., Fang Y., Liu D., Tang A., Collett J.L. Atmospheric ammonia in Beijing during the COVID-19 outbreak: concentrations, sources, and implications. Environ. Sci. Technol. Lett. 2021;8:32–38. doi: 10.1021/acs.estlett.0c00756. [DOI] [PubMed] [Google Scholar]
- Zhao Y., Zhao B. Emissions of air pollutants from Chinese cooking: a literature review, Building simulation. Springer. 2018:977–995. [Google Scholar]
- Zheng H., Kong S., Chen N., Yan Y., Liu D., Zhu B., Xu K., Cao W., Ding Q., Lan B., Zhang Z., Zheng M., Fan Z., Cheng Y., Zheng S., Yao L., Bai Y., Zhao T., Qi S. Significant changes in the chemical compositions and sources of PM2.5 in Wuhan since the city lockdown as COVID-19. Sci. Total Environ. 2020;739:140000. doi: 10.1016/j.scitotenv.2020.140000. [DOI] [PMC free article] [PubMed] [Google Scholar]
- Zhu Y., Xie J., Huang F., Cao L. Association between short-term exposure to air pollution and COVID-19 infection: evidence from China. Sci. Total Environ. 2020;727:138704. doi: 10.1016/j.scitotenv.2020.138704. [DOI] [PMC free article] [PubMed] [Google Scholar]
- Zoran M.A., Savastru R.S., Savastru D.M., Tautan M.N. Assessing the relationship between ground levels of ozone (O3) and nitrogen dioxide (NO2) with coronavirus (COVID-19) in Milan, Italy. Sci. Total Environ. 2020;740:140005. doi: 10.1016/j.scitotenv.2020.140005. [DOI] [PMC free article] [PubMed] [Google Scholar]
- Zou Z., Yao M. Airflow resistance and bio-filtering performance of carbon nanotube filters and current facepiece respirators. J. Aerosol Sci. 2015;79:61–71. [Google Scholar]
Associated Data
This section collects any data citations, data availability statements, or supplementary materials included in this article.
Supplementary Materials
Supplementary material