

Summary
To feed an ever‐increasing population we must leverage advances in genomics and phenotyping to harness the variation in wheat breeding populations for traits like photosynthetic capacity which remains unoptimized. Here we survey a diverse set of wheat germplasm containing elite, introgression and synthetic derivative lines uncovering previously uncharacterized variation. We demonstrate how strategic integration of exotic material alleviates the D genome genetic bottleneck in wheat, increasing SNP rate by 62% largely due to Ae. tauschii synthetic wheat donors. Across the panel, 67% of the Ae. tauschii donor genome is represented as introgressions in elite backgrounds. We show how observed genetic variation together with hyperspectral reflectance data can be used to identify candidate genes for traits relating to photosynthetic capacity using association analysis. This demonstrates the value of genomic methods in uncovering hidden variation in wheat and how that variation can assist breeding efforts and increase our understanding of complex traits.
Keywords: Aegilops Tauschii, Triticum aestivum, hyperspectral reflectance, exotic material, GWAS, capture sequencing
Introduction
Bread wheat occurred through hybridization of domesticated emmer with diploid goat grass, Ae. tauschii (D) (Haas et al., 2019). This event is thought to have occurred very few times in nature, integrating very few tauschii donors and resulting in a genetic bottleneck in D genome diversity (Dvorak et al., 1998). This lack of diversity has been identified in multiple populations, using capture enrichment (Gardiner et al. 2018) and whole genome resequencing (Rimbert et al., 2018) where variation rate in the A/B genomes was >4‐fold higher than the D genome. In an attempt to relieve this genetic bottleneck CIMMYT has created >1200 synthetic hexaploid wheat lines through interspecific crosses of durum wheat (T. turgidum ssp. durum, AABB) and diverse Ae tauschii (=Ae. squarrosa) D genome donors (Das et al., 2016; Jafarzadeh et al., 2016). Many have been used as parents in pre‐breeding and breeding programmes, being crossed with elite material producing synthetic‐derived lines (Li et al., 2018; Rosyara et al., 2019). These lines are attributed to have favourable effects on yield under irrigated conditions (Manès et al., 2012), drought stress (Lopes and Reynolds, 2011), heat stress (Cossani and Reynolds, 2015), salinity (Colmer et al., 2006), biofortification (Velu et al., 2018), pre‐harvest sprouting resistance (Imtiaz et al., 2008) and resistance to several pests and diseases (Kishii, 2019). In addition, introgression of wild relatives has been used to introduce novel diversity with well documented examples such as Rye (Secale cereale) and Thinopyrum ponticum (Niu et al., 2014; Ren et al., 2009). Despite the broad range of contributions of both synthetic wheat and introgressions to CIMMYTs breeding efforts, little work has been done to characterize the variation in these populations that is hidden to microarray‐based techniques that rely on pre‐existing knowledge of the variation assayed. Leading to much of this novel genetic variation that has been introduced being overlooked.
In addition to providing diversity for wheat breeders, this genetic diversity can be used to unpick the genetic basis of the traits measured at CIMMYT year on year. We demonstrate this by investigating phenotypic variation in spectral indices that are related to three classes of traits: (i) thermal/hydration properties measured in the infrared part of the electromagnetic spectrum, (ii) pigment related indices assessed in visible bands (Araus and Cairns, 2014) and (iii) photosynthesis related indices derived from the whole spectra (Coast et al., 2019; Silva‐Perez et al., 2017) in the High Biomass Association Panel (HiBAP). Few studies have attempted to determine these traits' contribution to a plant’s efficiency in utilization of incident solar radiation (or radiation use efficiency, RUE), which determines crop productivity (Zhu et al., 2010). Our mechanistic understanding of the genes and pathways involved in RUE is therefore limited, especially under field conditions (Molero et al., 2019).
Exploiting existing variation in RUE related traits through identification of the genetic mechanisms responsible could be a straightforward strategy for increasing RUE. A phenotypic range in photosynthetic rates of 33% was observed across 64 winter wheat varieties in UK field conditions (Driever et al., 2014) and 50% for 55 spring wheat varieties in Mexico and Australia(Silva‐Perez et al., 2019). To understand the genetic causes of this variation, traits contributing to RUE must be studied. Molero et al., 2019 proposed the use of exotic material (landrace and synthetic derivative lines) as a resource to increase RUE. Previous work using the same panel of wheat as this study has uncovered multiple marker‐trait associations (MTAs) related to RUE and biomass accumulation at various phenological stages (Molero et al., 2019) and demonstrated a link between RUE and photoprotection.
This suggests that photoprotective pigments could contribute to RUE throughout the crop cycle by preventing the propagation of free radicals that damage photosynthetic machinery. In addition, photosynthetic potential may differ depending on the content of individual leaf pigments (Blackburn, 2006) as the amount of solar radiation absorbed depends on pigment content (Filella et al., 1995) which in turn relates to photosynthetic capacity (Evans and Clarke, 2018). Chlorophyll a (chla) is the primary pigment of photosynthesis while chlorophyll b (chlb) is an accessory pigment. In a study of Australian wheat varieties released through time, a decrease in the Chl a/b ratio was associated with a decrease in electron transport capacity per unit of chlorophyll, but because total Chl content per unit leaf area increased, electron transport capacity per unit leaf area increased (Watanabe et al., 1994). Assessment of the contribution to RUE from pigment composition and its underpinning genetic basis is, therefore, of great interest for enhancing photosynthetic potential of wheat.
In this study we build on the work of Molero et al. (2019), by utilizing the same germplasm to assess novel traits including leaf pigment composition, hydration and model‐based prediction of overall photosynthetic capacity derived from hyperspectral reflectance measurements taken in field conditions. Here we also improve on the genotyping of the germplasm through leveraging enrichment capture sequencing and de novo SNP discovery we are able to gain an unprecedented insight into the overall levels of genetic diversity within CIMMYT breeding material. This methodology does not rely on prior knowledge of observed variation as is the case for array‐based techniques used previously. We have utilized this novel genetic information to further investigate the link between photoprotection and RUE through genome‐wide association of leaf pigment compositions of 149 wheat lines using high‐throughput hyperspectral reflectance measurements taken over 2 growing seasons. This uncovered novel MTAs for >20 traits relating to leaf pigmentation and water content along with candidate genes containing possible causative non‐synonymous variants that could be leveraged for trait improvement. We have also leveraged this data to determine the contribution of Ae. tauschii, S. secale and T. ponticum donors to increasing diversity in exotic derived lines, a process which would have been impossible using the array‐based genotyping that has previously been reported for the panels used in this study.
Results
Genotyping and SNP effects
To investigate genetic variation across the HiBAP panel we used a de novo SNP discovery strategy using a bespoke target sequence capture design. We developed a 12‐Mb target sequence using the MyBaits system based on that described by Gardiner et al., 2018, where underperforming baits were replaced with baits targeting genes associated with photosynthesis and biomass accumulation. A schematic of this capture design can be seen in Figure S1.
In total, 18.6 billion reads were sequenced between 149 lines, an average of 124 million per line. Of these, 86% mapped uniquely, covering on average 420 Mbp of the genome to 5x or greater and 172 Mbp at 10x or greater. A breakdown of mapping efficiency and variant calling can be found in Table S1. Variant calling yielded an average of 764 825 homozygous SNPs per line, producing a marker density of 45 SNPs/Mb. Of these, 96.9% of SNPs were in intergenic regions and 3.1% in the genic regions. Of the SNPs in gene bodies, 49% resulted in synonymous substitutions and 51% in non‐synonymous substitutions (Table S2). The average number of SNPs for the panel members containing exotic pedigree history was 11% higher than that of the elite subpopulation overall. The exotic population showed an increased SNP rate in all subgenomes, 5%, 10% and 62% for the A, B and D genomes respectively. A T‐test comparing the elite and exotic subpopulation showed no significant differences between the number of reads nor the number of bp that were mapped to ≥5x coverage between populations. After filtering for SNP loci with <10% missing data for MAF of >5%, 241,907 shared loci were retained. Overall marker density across the shared variants was 17 SNPs/Mbp with the highest density in the B genome followed by the A and D with 25, 16 and 9 SNPs/Mbp respectively (Table S3). Genome‐wide SNP subset density can be seen in Figures 1 and S2.
Figure 1.
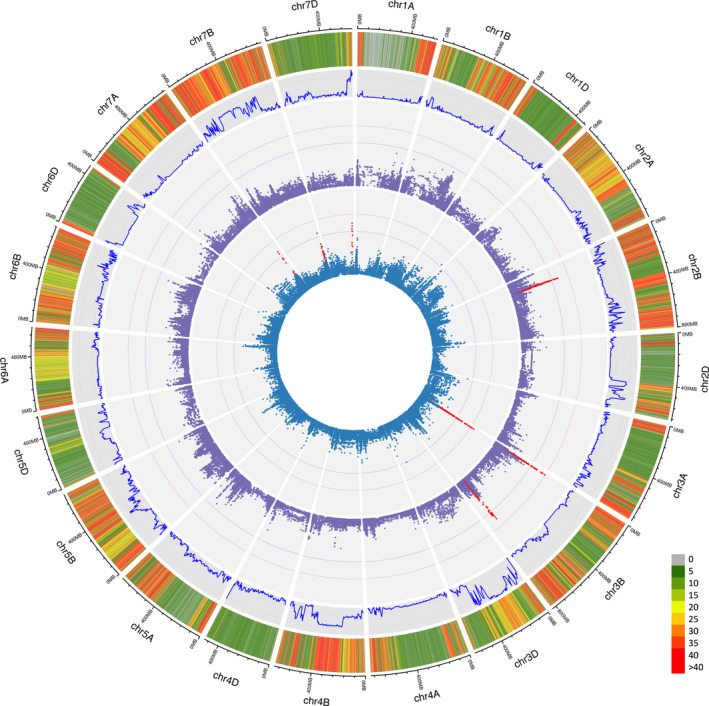
Genetic analysis of the HiBAP panel. (From outside to inside) (a) SNP density heatmap across the genome of loci containing < 10% missing data and >5% MAF within the HiBAP panel in 100 Kbp bins. (b) Fixation index calculated between elite background and exotic background subpopulations. (c) Genome‐wide association of flag leaf chlorophyll b content (c) Genome‐wide association of carotenoid content. Significance cut‐offs for ‐log10p of 5 and FDR correction are shown as blue and red lines respectively. SNPs in an interval above significance thresholds are shown in red.
Population structure analysis
Model‐based Bayesian clustering methods were used to deduce the population structure of the panel. The Evanno method revealed evidence for 2 subpopulations and some evidence for as many as 8 subpopulations (Figure S3). Where 2 subpopulations are assumed, population 1 and 2 comprise 114 and 35 respectively (Figure S4). Of population 2 members, 88.5% had synthetic/landrace parents in their pedigree history whereas only 16% of population 1 had any exotic background (Figure 2). Multiple lines also demonstrated significant admixture between populations. Admixture was seen to a lesser extent in the elite backgrounds (4%) compared with exotic backgrounds (25%). Fst analysis demonstrated genome‐wide effects of integration of exotic material with large regions of chromosomes showing differences between the elite background and exotic background panel members. Most notably in chromosomes 2D, 3D, 4B and 7B with regions spanning >300 Mbp (Figures 1/S5‐A). When the elite population was split randomly into two pseudo‐populations, Fst was negligibly small across every chromosome (Figure S5‐B).
Figure 2.
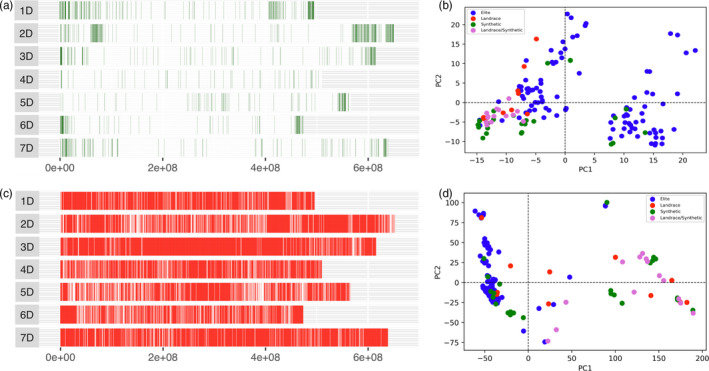
Enrichment capture reveals hidden variation contributed by exotic material. Distribution of D genome polymorphic SNP markers in the HiBAP panel from (a) The 35K wheat breeders’ array and (b) PCA demonstrating the identified genetic variation using the 35K array SNPs (c) De novo SNP distribution from enrichment capture data after filtering the combined panel data for <10% missing data and a minor allele frequency (MAF) of >5%. (d) PCA demonstrating the identified genetic variation using the de novo called enrichment capture genotyping SNPs.
Synthetic wheat introduces substantial increase in D genome variation
Comparison of SNP density in the D genome within the elite and exotic subpopulations revealed an increase of 62% in variation in the exotic subpopulation (Table 1). The largest increase was seen on chromosome 3D, with an increase of ~200%. However, these increases were not universal, with 1D showing no notable increase in SNP numbers between populations. Comparison of the elite and exotic subpopulation members highlights that these increases in D genome SNP density is localized into blocks (Figure 3), a result of the low crossover rate of 1‐2 per chromosome per cross in wheat (Gardiner et al. 2019), with regions as large as 343Mb showing notable SNP density increases. Within these regions a large proportion of the SNPs matched variation called for modern Ae. tauschii, confirming the origin of this variation is the Ae. tauschii donor used in synthetic creation (Figure 3b). The overall size of donor regions varied widely across the synthetic subpopulation, spanning from 43% to as little as 0.5% of the D subgenome and differed from the theoretical D contribution to pedigree range (1.6–25%) estimated from a dilution factor associated with the number of crosses after the original cross with the primary synthetic (Table S4). In 13 members with synthetic backgrounds negligible levels of donor were identified (0.5‐5%), suggesting donor loss during subsequent crosses and selections for agronomic traits/ideotypes. This loss was not necessarily correlated with the theoretical D pedigree contribution. For example, lines HiBAP_49 and HiBAP_51 are sister lines derived from the same cross (SOKOLL//PUB94.15.1.12/WBLL1) with a common selection history and a theoretical pedigree contribution of 6.3% from Ae. tauschii, but they contain 12.7% and 26.0%, respectively of Ae. tauschii regions in their D subgenome (Figure S6 and Table S4). Elite members showed almost no regions of increased diversity to the extent seen in those with synthetic history when compared to the Chinese Spring Refseq reference genome (CS) (Figure 3a). All D subgenome chromosomes are seen to contain regions of greatly increased SNP density in at least one member of the synthetic history subpopulation. Across all panel members with synthetic pedigree history 5301 non‐redundant 500 kbp bins were identified with a 5‐fold increase in variation when compared to the average number of SNPs for each bin across the elite subpopulation. This equates to ~2.65 Gbp (67.1%) of D genome sequence within the synthetic subpopulation that are likely to originate from donor Ae. tauschii. These regions encompass 22 583 high confidence genes in the CS reference annotation.
Table 1.
The average number of de novo SNP calls per chromosome for the elite and exotic subpopulations
| Elite | Exotic background | Percentage difference † | |
|---|---|---|---|
| chr1A | 45734 | 47865 | 4.66% |
| chr1B | 49306 | 55034 | 11.62% |
| chr1D | 9372 | 9423 | 0.54% |
| chr2A | 46243 | 53899 | 16.56% |
| chr2B | 60874 | 62237 | 2.24% |
| chr2D | 9284 | 12458 | 34.19% |
| chr3A | 33536 | 35550 | 6.01% |
| chr3B | 97429 | 97734 | 0.31% |
| chr3D | 7892 | 23853 | 202.24% |
| chr4A | 35341 | 34540 | ‐2.27% |
| chr4B | 12840 | 30796 | 139.84% |
| chr4D | 3597 | 4099 | 13.96% |
| chr5A | 36687 | 38698 | 5.48% |
| chr5B | 56866 | 57567 | 1.23% |
| chr5D | 5850 | 8960 | 53.16% |
| chr6A | 40510 | 41888 | 3.40% |
| chr6B | 63171 | 65299 | 3.37% |
| chr6D | 5684 | 8218 | 44.58% |
| chr7A | 53058 | 54033 | 1.84% |
| chr7B | 44757 | 55862 | 24.81% |
| chr7D | 7872 | 13268 | 68.55% |
| A Genome | 291110 | 306473 | 5.28% |
| B Genome | 385242 | 424530 | 10.20% |
| D Genome | 49550 | 80280 | 62.02% |
where difference = (exotic‐elite)/elite.
Figure 3.
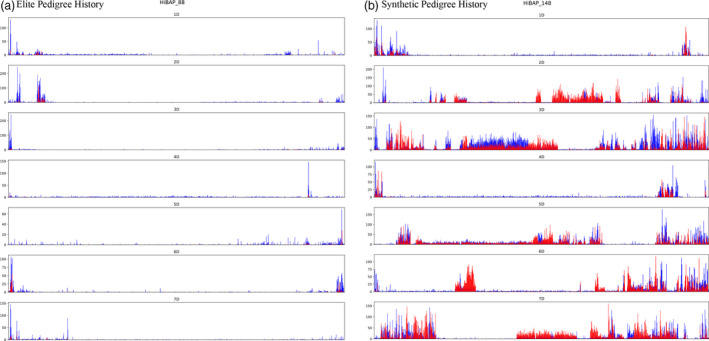
Synthetic wheat donor introgression identification in the D genome. D genome SNP density plots for (a) a representative example of HiBAP elite population and (b) an example of a member of the synthetically derived subpopulation. SNPs were binned into 500 kbp bins, demonstrating the number of SNPs that matched in position and allele of those seen in Ae. Tauschii against Chinese Spring reference genome (red) and the number of SNPs that did not match (blue).
Wild relative introgressions can be tracked using de novo SNP calls
To identify introgressions from Rye (Secale cereale), SNPs from each line were separated into 500 kbp bins for all subgenomes and the number of variants that match Rye in both position and allele were counted. SNPs between Rye and CS were generated by mapping and variant calling Lo7 Rye Illumina sequencing reads (ERS446995) against the CS reference genome. This revealed the 1B/1Rs introgressions in 6 panel members spanning the first 239 Mb in each line (Figure S7). This region contains 1507 high confidence genes in the CS reference genome annotation (v1.1). An introgression on the long arm of chromosome 7D was also identified in 3 panel members that spans a 300 Mb region from 344 Mb to the end of the chromosome (Figure S8); this interval contains 2563 genes in the CS reference annotation. The pedigree history of these lines suggests this is an introgression from Thinopyrum ponticum. Panel members containing S. secale/T. ponticum introgressions can be seen in Table S5.
Phenotypic variation for N content, and spectral indices
The results from analysis of variance (ANOVA) for N content, vegetation indices, pigment composition, senescence, water indices and traits estimated from wheat physiology predictor indicated significant variation among genotypes, environments, and genotype × environment interactions with few exceptions (Table 2). Broad sense heritability (H 2) was high for NLamA7, medium for SPADA7, low to medium for vegetation indices, pigment composition and senescence/degradation indices, high to medium for water indices and low for LMA and RDM (Table 2). Broad phenotypic variation among genotypes in spectral reflectance between the visible spectrum and the distribution of values for carotenoid, chla/b content was observed (Figure 4).
Table 2.
Descriptive statistics, broad sense heritability (H 2) and ANOVA for phenology, nitrogen content and hyperspectral indices of HiBAP grown for two years (Y15‐16 and Y16‐17) in northwest Mexico under full irrigated conditions
| Trait† | ANOVA ‡ | |||||||
|---|---|---|---|---|---|---|---|---|
| Mean | Min. | Max. | LSD | H 2 | G | Y | G × Y | |
| Phenology | ||||||||
| DTA (days) | 76.4 | 68.4 | 85.2 | 3.2 | 0.87 | *** | *** | *** |
| DTM (days) | 114.9 | 104.7 | 123.8 | 3.4 | 0.85 | *** | *** | *** |
| Nitrogen | ||||||||
| NLamA7 (%) | 3.6 | 3.3 | 4 | 0.2 | 0.62 | *** | ** | *** |
| SPADA7 | 49.7 | 42.9 | 56 | 4.2 | 0.52 | *** | ns | *** |
| Vegetation Indices | ||||||||
| GNDVI(R780‐R550)/(R780+R550) | 0.61 | 0.56 | 0.64 | 0.031 | 0.40 | *** | ** | *** |
| RNDVI(R780‐R670)/(R780+R670) | 0.76 | 0.72 | 0.79 | 0.031 | 0.19 | 0.06 | ** | *** |
| NDII(R850‐R1650)/(R850+R1650) | 0.163 | 0.136 | 0.185 | 0.018 | 0.59 | *** | ** | * |
| NDMI(R1649‐R1722)/(R1649+R1722) | 0.021 | 0.017 | 0.023 | 0.002 | 0.28 | *** | ** | ** |
| EVI2.5*((R900‐R680)/(R900+6*R680‐7.5*R475+1)) | 0.80 | 0.75 | 0.86 | 0.04 | 0.47 | *** | * | ns |
| Pigment composition | ||||||||
| Chl a (RARSa)R675/R700 | 0.59 | 0.53 | 0.65 | 0.05 | 0.44 | *** | ** | *** |
| Chl a (PSSRa)R800/R675 | 7.46 | 6.35 | 8.75 | 1.06 | 0.14 | ns | ** | *** |
| Chl b (RARSb)R675/(R650*R700) | 8.17 | 7.12 | 9.55 | 1.1 | 0.20 | 0.06 | ** | *** |
| Carotenoids (RARSc)R760/R500 | 6.61 | 5.64 | 7.83 | 0.73 | 0.46 | *** | ** | *** |
| Carotenoids:Chla ratio (SIPI)(R800‐R435)/(R415+R435) | 0.73 | 0.71 | 0.77 | 0.025 | 0.38 | *** | ** | *** |
| Total ChlR750/550 | 3.98 | 3.48 | 4.45 | 0.39 | 0.38 | *** | ** | *** |
| Total ChlR750/700 | 4.11 | 3.73 | 4.52 | 0.4 | 0.24 | ** | ** | *** |
| Senescence/degradation indices | ||||||||
| NPQI(R415‐R435)/(R415+R435) | ‐0.048 | ‐0.069 | ‐0.028 | 0.021 | 0.30 | ** | ** | ns |
| PSRI(R680‐R570)/(R531‐R570) | ‐0.007 | ‐0.018 | 0.004 | 0.009 | 0.32 | ** | * | *** |
| Water Indices | ||||||||
| Water Index (WI2)R1100/1200 | 1.073 | 1.059 | 1.084 | 0.007 | 0.71 | *** | 0.07 | ns |
| Water Index (WI3)R1300/1450 | 2.706 | 2.412 | 2.95 | 0.211 | 0.46 | *** | ** | *** |
| Water Index (WI4)R1300/1200 | 0.995 | 0.992 | 0.998 | 0.002 | 0.4 | *** | ** | *** |
| Physiology predictor | ||||||||
| Leaf Mass Area (LMA) | 57.3 | 49.7 | 66.8 | 6.1 | 0.37 | *** | ** | * |
| Respiration rate per Dry Matter (R_DM) | 60.3 | 55.1 | 65.8 | 6.2 | 0.00 | ns | * | ns |
DTA: days to anthesis, DTM: days to maturity, NLamA7: nitrogen concentration measured in leaf laminas seven days after anthesis, SPAD: chlorophyll content per unit flag leaf area, Chl: chlorophyll, NDVI: Normalized Difference Vegetation Index, GNDVI: Green Normalized difference vegetation index based on the difference between near‐infrared and green light reflectance; RDNVI: Red Normalized difference vegetation index based on the difference between near‐infrared and red reflectance; NDII: Normalized difference infrared index; NDMI: Normalized difference matter index; EVI: Enhanced vegetation index; RARSa and PSSRa: chlorophyll a; RARSb: chlorophyll b; RARSc: carotenoids; SIPI: Structural independent pigment index; Total Chl: total chlorophyll content; NPQI: Normalized Pheophytinization Index; PSRI: Plant senescence reflectance index; WI: water index.
*P < 0.05, **P < 0.01, ***P < 0.001 and not significant (ns). Italic numbers are significant at P < 0.1.
Figure 4.
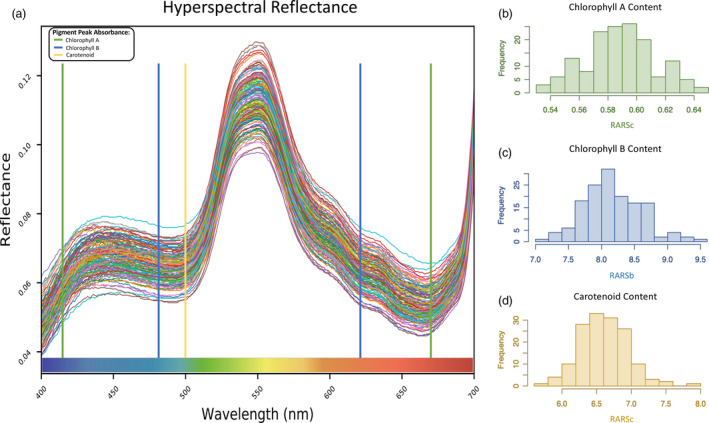
Phenotypic variation in Spectral reflectance from the 149 lines: (a) The level of variation in reflectance of the visible portion of the hyperspectral reflectance data for each member of the HiBAP panel. The distribution of observed values derived from spectral indices (b) flag leaf chlorophyll a (c) flag leaf chlorophyll b and (d) flag leaf carotenoid content across all panel members where frequency relates to the number of panel members within each bin in each histogram.
Association between spectral indices and agronomic traits
Multiple regression analysis (stepwise) was conducted to determine if the combination of traits presented in Table 2 (excluding phenology) were able to explain a percentage of variation of BM_PM, HI, TGW, GM2, RUE_E40InB, RUE) InBA7, RUE_GF and RUET (Table 3). In total, 13.2% of the variation in final biomass (BM_PM) was explained by the combination of water index 2 (WI_2) and plant senescence reflectance index (PRSI). For HI, 18% of the variation was explained by the combination of LMA and chla (RARSa) and 27.7% of the variation was explained when the model also considered chlbb (RARSb) and total chlorophyll content (R750_700.) In the case of TGW and GM2, the combination of enhanced vegetation index (EVI) and Plant Senescence Reflectance Index (PSRI) explained 13.3% and 16.5% of the variation, respectively, with opposite effects. RARSb explained 7.7% of the total variation observed in RUE_E40InB. However, the combination of LMA, Green Normalized Difference Vegetation Index (GNDVI), R750_700 and PSRI explained 25.6% of the variation in RUE_E40InB. For RUE_InBA7and RUE_GF, only 8.3% and 4% of the variation was explained by the combination of chlorophyll content in the flag leaf (SPAD_A7) and water index 4 (WI_4) or WI_2, respectively. Carotenoid content (RARSc) was the first component selected in the model and explained 3% of the variation in RUET. When structural independent pigment index (SIPI), WI_2 and NLamA7 were added to the model, 13.5% of RUET was explained.
Table 3.
Stepwise analysis with biomass at physiological maturity (BM_PM), harvest index (HI), thousand grain weight (TGW), grain number (GM2), Radiation Use Efficiency measured between 40 days after emergence and initiation of booting (RUE_E40InB), RUE between initiation of booting and seven days after anthesis (RUE_InBA7), RUE between seven days after anthesis and physiological maturity (RUE_GF) and RUE between 40 days after emergence and physiological maturity (RUET) as dependent variables and nitrogen content and hyperspectral indices as independent variables
| Trait | Variable chosen | r | R 2 | Significance |
|---|---|---|---|---|
| BM_PM | WI_2 | 0.343a | 0.112 | <0.001 |
| WI_2, PSRI | 0.379b | 0.132 | <0.001 | |
| HI | LMA(—) | 0.309a | 0.089 | <0.001 |
| LMA(—), RARSa | 0.437b | 0.180 | <0.001 | |
| LMA(—), RARSa, RARSb | 0.502c | 0.236 | <0.001 | |
| LMA(—), RARSa, RARSb, R750_700(—) | 0.544d | 0.277 | <0.001 | |
| LMA(—), RARSa, RARSb, R750_700(—), RNDVI | 0.594e | 0.330 | <0.001 | |
| TGW | EVI | 0.234a | 0.048 | <0.01 |
| EVI, PSRI | 0.380b | 0.133 | <0.001 | |
| GM2 | EVI(—) | 0.304a | 0.086 | <0.001 |
| EVI(—), PSRI(—) | 0.420b | 0.165 | <0.001 | |
| RUE_E40InB | RARSb | 0.289a | 0.077 | <0.001 |
| RARSb, LMA(—) | 0.345b | 0.107 | <0.001 | |
| RARSb, LMA(—), GNDVI | 0.386c | 0.131 | <0.001 | |
| LMA(—), GNDVI | 0.384d | 0.136 | <0.001 | |
| LMA(—), GNDVI, R750_700(—) | 0.429e | 0.168 | <0.001 | |
| LMA(—), GNDVI, R750_700(—), PSRI(—) | 0.525f | 0.256 | <0.001 | |
| RUE_InBA7 | SPAD_A7(—) | 0.262a | 0.062 | 0.001 |
| SPAD_A7(—), WI_4 | 0.309b | 0.083 | 0.001 | |
| RUE_GF | WI_2 | 0.214a | 0.039 | <0.01 |
| RUET | RARSc | 0.190a | 0.030 | <0.05 |
| RARSc, SIPI(—) | 0.270b | 0.060 | <0.01 | |
| RARSc, SIPI(—), WI_2 | 0.341c | 0.098 | <0.001 | |
| RARSc, SIPI(—), WI_2, NLamA7(—) | 0.397d | 0.135 | <0.001 |
Genome‐wide association
Marker‐trait association analyses carried out using best linear unbiased estimators (BLUEs) from two repetitions for each measured trait over two years. From across 23 traits 47 MTAs were identified with a ‐Log P value of 5 (P < 0.00001) of which 10 passed FDR threshold determined in GAPIT (‐Log P 7.12) for traits including total chlorophyll content (Figure 5), chlorophyll b content and carotenoid content (Figure 1). A full list of MTAs and plots can be found in Table 4 and Figure S9 respectively. Subgenome B had the most MTAs with 24 followed by the A and D genome with 11 found on each. The highest number of MTAs on a single chromosome were seen on 2B and 3B. The size of associated intervals varied greatly, ranging from less than 1 Mbp to greater than 100 Mbp with associations towards the centromere often being larger, consistent with the increase in centromeric linkage group size in wheat.
Figure 5.
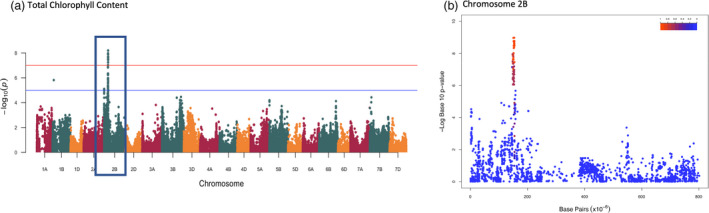
Genome‐wide association results for total chlorophyll content. Manhattan plot showing (a) the GWA output for total chlorophyll content (R750/700), significance cut‐offs for ‐log10p of 5 and FDR correction are shown as blue and red lines respectively. (b) The same GWA output for chromosome 2B, the level of genetic linkage to the most associated SNP is depicted by a heatmap.
Table 4.
Summary of Marker‐Trait Associations (MTAs) identified. MTAs from common intervals are indicated by the same colour
| Trait | Chromosome | MTA ID | Position | P‐value | Interval |
|---|---|---|---|---|---|
| Phenology | |||||
| DTA | chr5B | chr5B‐27404243 | 27404243 | 8.12E‐06 | 25–28 Mbp |
| chr6B | chr6B‐189683325 | 189683325 | 7.45E‐07 | 188–189 Mbp | |
| Nitrogen content | |||||
| SPAD | chr2B | chr2B‐106930486 | 106930486 | 7.54E‐06 | 105–140 Mbp |
| chr2D | chr2D‐16845994 | 16845994 | 1.96E‐06 | 15.3–16.9 Mbp | |
| chr5A | chr5A‐3550988 | 3550988 | 4.72E‐07 | 3–4 Mbp | |
| chr6D | chr6D‐456495062 | 456495062 | 8.69E‐07 | 455–462 Mbp | |
| Vegetation Index | |||||
| NDVI | chr7D | chr7D‐608810464 | 608810464 | 2.56E‐07 | 608.8–610 Mbp |
| GNDVI | chr2B | chr2B‐153275048 | 153275048 | 7.03E‐10 | 148–157 Mbp |
| chr3B | chr3B‐723108033 | 723108033 | 2.11E‐06 | 721–725 Mbp | |
| RNDVI | chr7A | chr7A‐711982572 | 711982572 | 2.30E‐06 | 711–712.5 Mbp |
| chr7D | chr7D‐608810464 | 608810464 | 9.92E‐08 | 604–611 Mbp | |
| NDII | chr6A | chr6A‐497983531 | 497983531 | 6.33E‐06 | 497.8–498.5 Mbp |
| NDMI | chr2B | chr2B‐669669845 | 669669845 | 2.73E‐07 | 530–670 Mb |
| EVI | chr6B | chr6B‐174740483 | 174740483 | 1.10E‐06 | 17–19 Mbp |
| chr3D | chr3D‐523811772 | 523811772 | 1.50E‐06 | 51–52 Mbp | |
| Pigmentation composition | |||||
| RARSa | chr2A | chr2A‐16347452 | 16347452 | 7.35E‐08 | 500 kb–26 Mbp |
| chr2B | chr2B‐20043565 | 20043565 | 8.67E‐07 | 15–21 Mbp | |
| chr2B | chr2B‐149018684 | 149018684 | 4.08E‐08 | 148–154 Mbp | |
| chr7B | chr7B‐135775607 | 135775607 | 5.78E‐06 | 135–136 Mbp | |
| PSSa | chr2A | chr2A‐17001351 | 17001351 | 7.13E‐07 | 500 kb–20 Mbp |
| RARSb | chr2B | chr2B‐153898371 | 153898371 | 1.83E‐06 | 150–154 Mbp |
| chr3B | chr3B‐20186940 | 20186940 | 1.27E‐07 | 18.4–21 Mbp | |
| chr3B | chr3B‐715184359 | 715184359 | 9.06E‐07 | 713–728 Mbp | |
| RARSc | chr3B | chr3B‐20358957 | 20358957 | 1.25E‐08 | 19–21.5 Mbp |
| chr7A | chr7A‐676592398 | 676592398 | 1.84E‐06 | 675–677 Mbp | |
| chr7B | chr7B‐722589303 | 722589303 | 4.66E‐06 | 722–725 Mbp | |
| chr7D | chr7D‐608810464 | 608810464 | 1.05E‐06 | 608–609 Mbp | |
| SIPI | chr3B | chr3B‐711119921 | 711119921 | 2.87E‐06 | 690–712 Mbp |
| chr7D | chr7D‐610551080 | 610551080 | 3.74E‐06 | 608–611 Mbp | |
| R750550 | chr2B | chr2B‐2619111 | 2619111 | 9.55E‐06 | 2.4–3.2 Mbp |
| chr2B | chr2B‐153275048 | 153275048 | 6.29E‐09 | 150–155 Mbp | |
| R750700 | chr2B | chr2B‐153275048 | 153275048 | 1.04E‐09 | 150–155 Mbp |
| chr3B | chr3B‐736709296 | 736709296 | 2.72E‐07 | 722–737 Mbp | |
| Senescence/degradation indices | |||||
| NPQI | chr7A | chr7A‐539405222 | 539405222 | 2.31E‐07 | 523–564 Mbp |
| PSRI | chr3B | chr3B‐718670251 | 718670251 | 3.43E‐07 | 715.7–718.6 |
| Water Indices | |||||
| WI2 | chr3A | chr3A‐616891767 | 616891767 | 9.04E‐07 | 616–625 Mbp |
| WI3 | chr1B | chr1B‐572799923 | 572799923 | 1.09E‐07 | 567–573 Mbp |
| chr7A | chr7A‐34727282 | 34727282 | 7.30E‐06 | 34.5–35 Mbp | |
| WI4 | chr3A | chr3A‐616891767 | 616891767 | 2.87E‐08 | 616–628 Mbp |
| chr3D | chr3D‐611549913 | 611549913 | 1.24E‐07 | 612–620 Mbp | |
| Physiology predictor | |||||
| LMA | chr3D | chr3D‐336170196 | 336170196 | 3.29E‐07 | 307–336 Mbp |
| chr1B | chr1B‐65889406 | 65889406 | 5.71E‐07 | 65–83 Mbp | |
| R_DM | chr1D | chr1D‐397474458 | 397474458 | 1.27E‐06 | 396–399 Mbp |
Putative Candidate Genes and Haplotype Phased Non‐Synonymous Variation
Candidate gene searches were carried out using Knetminer (Hassani‐Pak et al. 2020) to identify genes within MTA intervals with phenotype/ontology terms associated with each trait alongside literature searches. Candidates were identified with ontology terms relating chlorophyll content and chlorophyll biosynthesis within multiple MTA intervals including Genome Uncoupled 5 (GUN5) in SPAD‐2B, Early Chloroplast Biogenesis 2 (ECB1)/Vanilla Cream 1 (VAC1) in the shared interval RARSa‐2b, RARSb‐2b, R750/700‐2B and R750/500‐2B, SWEET4/5 bi‐directional sugar transporter and Ethylene‐responsive element binding factor 1 (ERF1) within 1Mbp of the MTA in RARSa‐2A and PSSRa‐2A. We also identified multiple candidates chlorophyll breakdown and senescence: protein phosphatase 2A (PP2A) and HY5 a bZIP transcription factor that binds to the promoters of light‐inducible genes in NPQI‐7A, TCP20 and HK3 cytokinin receptor in PSRA‐3B. Along with candidates that link to carotenoid biosynthesis and distribution: SYTF and TRAESCS3B02G039600 in RARSc‐3B, TRAESCS7D02G503400 in RARSc‐7D and also Small ubiquitin‐related modifier 1 (SUMO1) in SIPI‐3B and KNAT3/KNOTTED1‐like in SIPI‐7D, both of which have also been implicated in chlorophyll levels in the leaf.
The SWEET bi‐directional sugar transporter was identified in the interval for chla content (RARSa) on chromosome 2A, whose closest orthologues are ATSWEET4/5. These genes have been observed to have an effect on chlorophyll content in both Arabidopsis thaliana (Liu et al., 2016) and in rice (Zhou et al., 2014). A search was carried out for non‐synonymous SNP calls within SNP calls that were removed prior to GWA, including many resulting from ‘off target’ sequencing that did not have coverage in >90% panel members. This search identified a non‐synonymous SNP at the start of the SWEET gene causing a substitution of Serine to Threonine. This variation was identified in 15 of 26 members with the minor allele of the MTA, suggesting this non‐synonymous SNP is in phase with the MTA. No candidate genes that had any link to measured traits were identified for 4 MTAs. A full list of candidate genes and gene identifiers can be seen in Table S7.
Discussion
‘De novo’ SNP discovery
The size of the wheat genome means it is not yet economically viable to perform whole genome sequencing for large populations. Much of our understanding of the genetic diversity of wheat has come from array‐based genotyping (Allen et al., 2016; Wang et al., 2014). An alternative is enrichment capture, that has uncovered ‘hidden variation’ across world diversity panels (Pont et al., 2019) and landraces (Gardiner et al., 2018). Here we utilize capture sequencing and de novo SNP discovery to assess the contribution of strategically integrated exotic germplasm to overall CIMMYT germplasm diversity, to identify and track wild relative introgressions and demonstrate how this novel diversity can be exploited to identify candidate genes for agriculturally important traits. We also show a clear improvement in our ability to assess diversity within the HiBAP panel when comparing de novo methods to the previously available array‐based genotyping for the panel. This included demonstrating the extent to which introgression of exotic material has increased genetic variation throughout the panel which was previously masked because the predesigned nature of array‐based methods limit discovery of truly novel variation (Figures 2 and 3) along with leveraging the ~100 fold increase in SNP density to identify non‐synonymous SNPs within a candidate genes.
Recent synthetic wheat contribution to D genome variation and identification of wild relative introgressions
HiBAP panel members containing exotic pedigree history were found to have a 62% increase in genetic variation when compared to elite lines. Since this variation is present in wheat lines that have been demonstrated to have no yield penalty, it could be deployed rapidly into breeding programmes to alleviate the genetic bottleneck on the D genome which may be hindering genetic gains in wheat (Lopes et al., 2015). A large contribution to this variation is made by the synthetic derivatives in which the proportion of Ae. tauschii was observed to be as high as 43% of the D genome with an average of 16% across the synthetic‐derived subpopulation (Table S4). Contribution of synthetic material to advanced lines has been theoretically predicted utilizing genetic inference from pedigree history and allele frequency variation of markers at low resolution, determining a likely average of 17.5% contribution (Rosyara et al., 2019). Here we are able to confirm these predictions and build on this by identifying regions to high resolution and through SNP identity utilizing the Ae. tauschii reference genome. Across this whole subpopulation a total of 2.65 Gb (67.2%) of the D genome was identified to be of synthetic donor origin, demonstrating the value of the HiBAP panel as a resource that could be utilized to study the effects of the presence of some of the ~22 000 genes found in these regions that are already introgressed into agronomically favourable backgrounds. We also identify that the proportion of Ae. tauschii donors in the synthetic subpopulation can vary substantially, from as little as 0.5% to as high as 43% of the D subgenome, a larger range than identified in studies using synthetic octoploids as primary Ae. tauschii donors (0.075%–13.5%) (Nyine et al., 2020). Through comparison of sister lines within the panel we also show that the content of the donor genome is not necessarily linked to the number of subsequent crosses post introduction of primary synthetic material (Figure S6, Table S4).
By utilizing genome‐wide variation in conjunction with pedigree history and genetic resources for wheat wild relatives we are able to track introgressions from other common donors including Rye and T. ponticum. Using identification by genetic identity we tracked the once common CIMMYT 1BL/1RS introgression to 6 HiBAP panel members (Table S5). We also confirm that this original introgression remains intact in each instance, demonstrating the inability of homologous recombination when the effect of ph mutants is negated, restricting breakage of alien introgressions (Hao et al., 2020). We also identified a region of increased SNP density on chromosome 7DL in 3 panel members, pedigree history examination determined this to be of T. ponticum origin. This introgression, inferring resistance to both stem rust (Sr25) and leaf rust (Lr19) (Niu et al., 2014) can be tracked through CIMMYT breeding material. The agronomic advantages these introgressions infer highlight the importance of tracking their presence in breeding programmes and for making selections for future crosses.
Using high density genotyping and high‐throughput phenotyping to uncover novel markers and putative candidate genes associated with photosynthetic efficiency
Recent developments in high‐throughput phenotyping have already made significant contributions to physiological breeding (Araus and Cairns, 2014; Chapman et al., 2014; Tattaris et al., 2016) and breeding programmes (Reynolds et al., 2020). Assessment of photosynthetic related traits using high‐throughput surrogates based on spectral profiles has allowed the identification of genetic variation in wheat for photosynthetic capacity and efficiency(Silva‐Perez et al., 2019) and respiration(Coast et al., 2019) at leaf level along with pigmentation composition and water content at canopy level allowing the identification of QTLs associated with spectral indices (Gizaw et al., 2018; Liu et al., 2019). In the present study, we aimed to identify genetic variation at leaf level from the spectral profiles reflected by green tissue. Our GWAS analysis identified 47 novel MTAs (Table 4) that, after a validation process, could be deployed into CIMMYT marker‐assisted breeding programmes to track favourable alleles for traits that have important agronomic implications. One such trait is the chlorophyll content of leaves that has significant effect on photosynthetic efficiency, water use efficiency and yield in multiple crop species in field environments (Gu et al., 2017; Slattery et al., 2017). MTAs were identified for chla and chlb separately and also for total chlorophyll content on chromosomes 2BS and 3BL with the main association on 2BS at ~150 Mbp being present in all measurements which could be a result of the mostly overlapping absorbance spectra of the two pigments (Huang et al., 2015). A QTL has been identified for chlorophyll content on 2BS under heat stress, spanning nearly the entire short arm of the chromosome (Bhusal et al., 2018), using ultra‐high density genotyping we are able to reduce this to an interval of <5 Mbp. Within this interval we identify Early Chloroplast Biogenesis 2 (ECB1)/Vanilla Cream 1 (VAC1), a pentatricopeptide repeat protein with arabidopsis mutants in the gene reducing chlorophyll content by 10 fold (He et al., 2019; Yu et al., 2009). SPAD measurements in the flag leaf (a surrogate of total chl content), uncovered MTAs on chromosomes 2B, 2D, 5A and 6D. Candidate gene search within the 2B interval showed the Genome Uncoupled 5 gene (GUN5). GUN5 encodes a magnesium chelatase (Davison and Hunter, 2011), mutations in the gene in Arabidopsis result in the disruption of chlorophyll synthesis. This can be explained because GUN 5 sits in the retrograde signalling pathway linking chlorophyll biosynthesis to sugar signalling (McCormac and Terry, 2004).
This makes GUN5 a possible target for future study in relation to chlorophyll variation in the HiBAP panel. We also identified a pigment specific MTA for chla on 2A and 7B and an MTA specific to chlb on chromosome 3BL. Of these, we believe that 3BL association has been identified previously in a QTL spanning over a fifth of 3B (Czyczyło‐Mysza et al., 2013), here we refine that to a region of less than 2Mbp. Within 1Mbp of MTA for chla in 2A two candidate genes were identified: an ERF1 gene associated with biotic/abiotic stress tolerance, which when overexpressed in wheat has demonstrated a 50% increase in chla content under normal growing conditions (Xing et al., 2017). Also a SWEET bi‐directional sugar transporter related to Arabidopsis SWEET4/5, with mutants in SWEET4/5affecting leaf chlorophyll content in Arabidopsis (Liu et al., 2016) and rice (Zhou et al., 2014), although the mechanism for this effect is still unclear. SWEET transporters catalyse the passive efflux of sucrose down the gradient from the mesophyll to the apoplast where it is taken up by sucrose transporters (SUTs) into the phloem (Chen et al., 2012). Within this gene, a non‐synonymous mutation was identified in the prefiltered SNPs set that is in phase with the top SNP for this MTA, the SNP was called in 15 of the 25 lines containing the minor allele for this MTA. When taken together this evidence makes the SWEET gene a strong candidate for further study. The fact that both SWEET and GUN5 genes were associated with chlorophyll traits suggests that the two may be working together to control chlorophyll content in wheat leaves. Through the index NPQI we can also make inference about the level of chlorophyll degradation happening in the leaves (Lowe et al., 2017) which can be indicative of plant senescence. We detected an association for NPQI in chromosome 7AL that contains HY5, an antagonist of PIF that controls the accumulation of chlorophyll in the leaves in response to phytochrome photoreceptor signalling (Toledo‐Ortiz et al., 2014), which also causes delayed senescence in rice transgenic plants (Burman et al., 2018). We also observed an association on 3BL for plant senescence itself through calculation of PSRI, this interval contains AHK2 a cytokinin receptor which controls leaf longevity in Arabidopsis and knockouts demonstrate a delayed senescence phenotype. Another gene in this interval found >180 kbp from this MTA is transcription factor TCP20 which causes early senescence phenotypes in Arabidopsis but only in a double mutant including TCP9 due to predicted redundancy in signalling roles (Danisman et al., 2012).
Increasing RUE is a major target for achieving yield potential (Zhu et al., 2010). However, under field conditions like the ones experienced in Cd. Obregon, leaves are exposed to high irradiance absorbing more light they can use. This leads to photooxidative damage and reduces photosynthetic efficiency in a process known as photoinhibition. To avoid oxidative stress and photoinhibition, photoprotective mechanisms can be activated in response to high irradiance. There is evidence that photoinhibition has a large impact on biomass production in crops exposed to high light levels (Murchie et al., 2015) and photoprotective mechanisms can increase yield and canopy RUE in rice (Hubbart et al., 2018). Previous studies identified photoprotective genes associated with RUE (Molero et al., 2019) indicating that protection of photosynthetic machinery has an impact in wheat. However, we also need to consider that in some cases, photoprotective mechanisms could also dissipate too much energy that could be used in photosynthetic processes. Therefore, the trade‐off of photoprotective mechanisms needs to be considered.
In this study, the photoprotective mechanisms that were detected are related with non‐photochemical processes happening before photolysis in PSII, such as the xanthophyll cycle, where xanthophyll carotenoid plays an important role(Murchie et al., 2015). In our analysis, carotenoid content in the flag leaf (RARSc) was the first trait explaining 3% of RUET variation and together with carotenoids:chla ratio (SIPI) 6% of variation was explained. Carotenoids play an important role protecting the photosynthetic machinery from excessive light (Cazzonelli, 2011; Demmig‐Adams, 1990). Also, the ratio of carotenoids to chlorophyll is associated with senescence triggered by ageing or stress (Bort et al., 2005). An MTA for carotenoid content was identified on chromosome 3B, along with three others on homeologous regions of 7A, B and D. Two genes in the 3B interval were denoted as being involved in carotenoid biosynthesis by Knetminer, SYTF and TRAESCS3B02G039600.
Reduced total chlorophyll content in the flag leaf is associated with enhanced RUE in elite cultivars
Total chlorophyll content was negatively correlated with RUE (Table 3) and it is mainly determined by chla concentration since the ratio between chla:chlb in wheat non‐stressed plants is ~3:1(Watanabe et al., 1994). In the present study, chla (RARSa) explained a significant part of HI variation while chlb (RARSb) explained variation for RUE_E40InB. In wheat canopies, the uppermost layer including the flag leaf measured in this study receives the highest irradiance. However, photosynthetic machinery in wheat is saturated at 1200 μmol/m2/s (Blum, 1990). Considering the high irradiance in Obregon when the measurements were taken (>1800 μmol/m2/s), flag leaves absorb more light than they can use and need to engage photoprotective mechanisms. Lower chlorophyll content per unit area in the upper leaves facilitates light penetration in the canopy decreasing canopy extinction coefficient and therefore mitigating efficiency losses associated with light saturation (Hamblin et al., 2014; Ort et al., 2011) This is in agreement with the negative effect observed here between total chl content and RUE, suggesting that less chlorophyll content in upper leaves has a positive effect on biomass production as observed for rice or soybean (Gu et al., 2017; Slattery et al., 2017).
Implications in physiological breeding
Here we uncover the contribution of exotic material to variation in CIMMYT wheat lines, confirming the value of strategic incorporation of primary synthetics to ease genetic bottlenecks in the D genome. The HiBAP panel now represents an unprecedented resource of characterized genetic diversity, containing ~67% of the Ae. tauschii genome across the panel already in agronomically viable backgrounds. Identification of Ae. tauschii introgressions at such resolution allows breeders to select lines for strategic crossing to increase overall genetic variation using agronomically favourable material. The HiBAP panel has also been extensively phenotyped including yield traits, biomass accumulation, RUE and respiratory rates, in both yield potential and under abiotic stress. The results presented here highlight the possibilities created when phenotyping and genotyping efforts are coordinated in consortiums such as the International Wheat Yield Partnership (www.iwyp.org) to boost wheat genetic gains.
The use of hyperspectral reflectance (ASD Field Spec) measured on leaves in the field is independent of sunlight (due to the light source of the device) and one leaf can be measured in less than 30 s (Silva‐Perez et al., 2017). From the reflectance spectrum produced, multiple indices were derived which when combined with high density genotyping, facilitated the identification of candidate genes/traits integral to photosynthetic improvement. This protocol facilitates measurement of hundreds of genotypes per day to explore genetic variation of photosynthesis (Silva‐Perez et al., 2019) making association analysis feasible. The new MTAs for traits that contributed to RUE, HI and other traits of interest can be further used to identify allelic variation in other mapping populations or introgressed into elite lines through conventional and strategic crossing.
The current study was conducted on the flag leaf and scaling leaf‐level data to the canopy can be complicated as leaf age and leaf angle can play a crucial role when integrating leaf‐level photosynthetic traits at the canopy scale (Furbank et al., 2019). However, leaf‐level measurements have been previously associated with higher yields (Carmo‐Silva et al., 2017; Fischer et al., 1998; Tang et al., 2017) and in the present study, traits measured at leaf level explained a significant proportion of the variation of BM_PM, HI, TGW, GM2 and RUE measured at different growth stages. Nevertheless, further experiments expanding measurements at the flag leaf to other canopy levels and at more time points across the whole growth cycle may be worthwhile (Murchie et al., 2018).
The identification of new sources of variation that contribute to increased photosynthetic potential in wheat together with the identification of markers associated with them could help to identify better donors that can provide superior combinations of alleles of useful genes.
Methods
Plant material
The High Biomass Association Mapping Panel (HiBAP) consists of 149 bread wheat spring types (Table S6) that are agronomically acceptable including elite high yielding lines, pre‐breeding lines that have been selected for high yield and/or biomass, including lines that have ‘exotic’ material such as landraces or synthetic primary hexaploids in their recent pedigree history along with appropriate local check lines. The panel contains members that show broad variation of both RUE and biomass at multiple growth stages as described in (Molero et al., 2019), and are controlled for the confounding effects of the extremes of height and phenology.
DNA extraction and capture enrichment
Flag leaf tissue was obtained from plants used in field trials after anthesis. Material from 10 individuals was taken per line and pooled for DNA extraction using a standard CTAB based method. DNA purity was assessed using a NanoDrop 2000 (Thermofisher Scientific) and quantified fluorometrically using the Quant‐iTTM assay kit (Life Technologies). Dual indexed DNA libraries were constructed with a modal insert size of 450 bp using TruSeq DNA library preparation kit (Illumina). Capture enrichment was carried out using the MyBaits targeted capture kit (Arbor Bioscience, Michigan USA) incorporating 100 000 custom 120‐mer RNA bait sequences with 8x pre‐capture multiplexing following standard protocols. In total, 90 000 probes were designed in an island strategy distributed to facilitate enrichment and subsequent variant calling from regions spanning the entire genome. Probe sequences were designed based on a subgenome‐collapsed reference, allowing probes to target homeologous regions, increasing the genomic design space with the fewest probes possible. 10 000 probes were designed to target selected gene sequences using an end‐to‐end tiling strategy covering the gene body and the promoter region (~2000 bp). The 2 kb distance was based on the median distance between the TSS and the first transposable element, 1.52 kb to allow a high likelihood of full promoter sequence capture (Wicker et al. 2018). Enriched libraries were then sequenced on a NovaSeq6000 (Illumina) S4 flowcell producing 2 × 150 bp paired end sequences.
Genotyping and imputation
Sequencing quality was assessed with FastQC and low‐quality reads removed/trimmed. The paired end sequencing data for each accession was mapped to the Refseq‐v1.0 reference sequence (IWGSC et al., 2018) using BWA MEM version 0.7.13 (Li and Durbin, 2009). Mapping results were filtered using SAMtools v1.4 (Li et al., 2009); any non‐uniquely mapping reads, unmapped reads, and/or poor‐quality reads were removed. PCR duplicates were identified and removed using Picard Tools MarkDuplicates. Variant calling was carried out using bcftools and were filtered using GATK (McKenna et al., 2010), using the standard GATK recommended parameters of minimum quality of 30, a minimum depth of 5. The likely functional effect of each variant was annotated using SnpEff 4.3 (Cingolani et al., 2012) using a custom database generated using Refseq v1.1 annotation (IWGSC et al., 2018) (All gene identifiers listed relate to this annotation). For each SNP loci found in the panel as a whole, if no alternative allele was found for an individual but mapping depth of ≥5 was observed, the individual was designated as homozygous reference for that loci, else it was designated as missing data. SNP loci that had <10% missing data and a minor allele frequency of ≥5% were then subjected to imputation using Beagle 5.0 (Browning and Browning, 2016).
Population structure analysis
Genetic inference into the population structure of the panel was made using STRUCTURE 2.3.4 (Pritchard et al., 2000) using model‐based Bayesian approaches along with Hierarchical clustering to deduce similarity between lines. An admixture model was selected in STRUCTURE and run using 30 000 burn‐in iterations and 50 000 repetitions of the Markov Chain Monte Carlo (MCMC) model for the assumed subpopulations of k (2‐10) for 10 independent, randomly seeded iterations of the analysis per assumed subpopulation. To identify the statistically most likely number of definable subpopulations, the delta k method of (Evanno et al., 2005) was applied to all 10 replicates, where the Dk statistic is deduced from the rate of change in the probability of likelihood [LnP(D)] value between each k value. The Evanno method was implemented through STRUCTURE HARVESTER Python script (Earl and von Holdt, 2012). CLUMPP 1.1.2 was used to produce a consensus Q matrix using 10 independent STRUCTURE replicates for each assumed subpopulation number (Jakobsson and Rosenberg, 2007). To assess the overall level of genetic variation in the panel PCA analysis was carried out using the Scikit‐Learn machine learning package in Python. PCA was applied to genotyping data from the 35K wheat breeders array used in the study of Molero et al. 2019 and capture enrichment sequencing derived genotyping data for all subgenomes combined and for the D genome separately to assess the level of variation that could be observed when using pre‐known SNP loci and using de novo methods. To determine genomic regions most greatly affected by the incorporation of exotic material, fixation index (F st) was calculated in windows of 500 kbp in pairwise comparisons of the elite subpopulation with the exotic subpopulations that included landrace, synthetic and landrace + synthetic and the introgression lines subpopulation as a whole. As a control measure, the elite population was randomly split and F st was calculated between the pseudo‐subpopulations.
Identification of Ae. tauschii synthetic D genome donor regions and S. cereale introgressions
To identify genomic regions originating from Ae. tauschii donors used in the creation of primary synthetics present in the pedigree history of 40 HiBAP panel members, SNPs called for each HiBAP member were compared to SNPs called between the CS wheat reference and the Ae. tauschii reference genome (Luo et al., 2017) to determine identity. Paired end 150 bp reads were simulated from the Ae. tauschii reference genome to a depth of 20x using WGSim. Reads were mapped and variant called using the same methods outlined for the capture sequencing of the HiBAP panel members. To remove noise created by varietal SNPs between CIMMYT germplasm and the CS reference, Weebil1 SNPs were generated using trimmed sequencing reads used to create the contig assembly of Weeblil1 (project PRJEB35709 accession SAMEA6374024) and SNPs from the panel matching in location and allele we removed from further analysis. SNPs across each panel member were binned into 500 kbp bins and within each bin the number of SNPs showing identity by state to Ae. tauschii were counted. To estimate the contribution of Ae. tauschii within the entirety of the HiBAP panel the maximum number of SNPs within every 500 kbp window was assessed for both the elite background and synthetic background subpopulations. Where the value for a bin in any synthetic line was 5‐fold higher than the average value for each bin from the whole elite population this was classed as a modern Ae. tauschii region. Additionally, the theoretical contribution to pedigree from Ae. tauschii was estimated using the available pedigree and selection history information from the International Wheat Information System (IWIS), curated by CIMMYT.
To determine the presence of Rye introgressions in the panel SNPs between Rye and CS were generated by mapping and variant calling Lo7 Rye Illumina sequencing reads (ERS446995) against CS as previously described. Genetic identification of regions of Rye was carried out using the same identity by state methods for Ae. tauschii outlined previously.
Field experimental conditions
The 149 lines were grown in two consecutive growing seasons (2015/16 and 2016/17, which will be referred to as Y16 and Y17 respectively). Field experiments were carried out at the IWYP‐Hub (International Wheat Yield Partnership Phenotyping Platform) at CENEB in the Yaqui Valley, near Ciudad Obregón, Sonora, México (27°24′ N, 109°56′ W, 38 masl), under fully irrigated conditions. The soil type was a coarse sandy clay, mixed montmorillonitic typic caliciorthid, low in organic matter, and slightly alkaline (pH 7.7) in nature(Sayre et al., 1997). Experimental design was a α‐lattice with four replications in raised beds (2 beds per plot each 0.8 m wide) with four (Y16) and two (Y17) rows per bed (0.1 m and 0.24 m between rows respectively) and 4 m long. The emergence dates were 7 Dec. 2015 and 30 Nov. 2016 for each year. The seeding rate was 102 kg/ha. Appropriate fertilization, weed disease and pest control were implemented to avoid yield limitations. Plots were fertilized with 50 kg N/ha (urea) and 50 kg P/ha at soil preparation, 50 kg N/ha with the first irrigation and another 150 kg N/ha with the second irrigation. Growing conditions and main agronomic characteristics of the trial grown for two years are detailed in (Molero et al., 2019).
Chlorophyll content, N composition and reflectance measurements
Chlorophyll content in the flag leaf was measured with a SPAD‐502 Minolta (Spectrum Technologies Inc., Plainfield, IL, USA) in five flag leaves per plot seven days after anthesis (SPADA7).
Nitrogen concentration of the leaf lamina (NlamA7) was measured using the Kjeldahl digestion method putting together all green leaf laminas from 12 random stems harvested seven days after anthesis after drying (oven dried at 70°C for 48 h), milling and digestion with concentrated sulphuric acid.
The hyperspectral reflectance of flag leaves was measured between 11.00 to 14.00 h approximately seven days after anthesis following the protocol described by(Silva‐Perez et al., 2017). A FieldSpec®3 (Analytical Spectral Devices, Boulder, CO, USA) full range spectroradiometer (350–2500 nm) was coupled via a fibre optic cable to a leaf. A mask was used to reduce the leaf‐clip aperture and a black circular gasket was pasted to the mask to avoid leaf damage and to eliminate potential entry of external light through the edges. One reflectance measurement was made per leaf lamina, and two measurements per plot in two plots per entry. Different spectral reflectance indices were calculated (Peñuelas and Filella, 1998). The formulas for index calculations are presented in Table 2. Leaf mass area (LMA) and respiration on a dry matter basis (RDM) were estimated using a web‐application to predict wheat physiological traits from hyperspectral reflectance spectra known as the Wheat Physiology Predictor [https://www.metabolome‐express.org/pheno/] based on (Silva‐Perez et al., 2017) and (Coast et al., 2019) prediction models.
Genome‐wide association analysis
Association analysis was carried out using GAPIT(Lipka et al., 2012) on 149 HiBAP lines. A model based on the unified mixed linear model approach, the SUPER algorithm, was applied to the genotype/phenotype data. The model was adjusted using membership coefficient matrices produced by STRUCTURE assuming between 2–8 subpopulations (Q2‐8) or the first 10 eigenvectors from principal component analysis (PC1‐10) along with a kinship matrix (K) as covariates to limit the confounding effects of population structure effects and therefore reducing false positives. The EMMA method proposed by Kang et al. (2008) to create a positive semidefinite kinship matrix (K) was followed, implemented in GAPIT. Interval size was determined by taking the flanking SNPs from each association that were greater than the lower ‐Log P 5 threshold. To identify possible causative candidates, genes within the associated intervals were submitted to Knetminer. The resultant information networks were assessed and if adequate evidence was available to suggest the gene or its orthologous genes may be involved in a mechanism linking to the trait to which it was associated, the gene was selected as a possible candidate. Interval genes were also mined for non‐synonymous variants in both the high confidence SNP calls along with those falling below depth filters.
Statistical analysis of phenotypic data
In order to deduce the combinatorial contribution of the leaf pigment, hydration and predicted photosynthetic capacity traits described in this study to overarching agronomically important traits, multiple linear regression analysis was applied. For this analysis we utilize data for agronomic traits including biomass, HI, TGW, GM2 and RUE at various growth stages along with DTA and DTM from the study by Molero et al. (2019). Agronomic trait data was analysed by using a mixed model for computing the least square means (LSMEANS) for each genotype across both years using the program Multi Environment Trial Analysis with R for Windows (METAR, (Alvarado et al., 2019)). DTA was used as covariate (fixed effect) when its effect was significant with the exception of phenology and RUE. Broad sense heritability (H 2) was estimated for each trait across both years as:
where r = number of repetitions, e = number of environments (years), σ 2 = error variance, = genotypic variance and = G × Y variance.
In this study, we define low broad sense heritability when H 2 < 0.30, medium when 0.30 ≤ H 2 < 0.60 and high when H 2 ≥ 0.60 (Johnson et al. 1955).
Multiple linear regression analysis (stepwise) was used to analyse the relationship between the studied variables using the SPSS statistical package (SPSS Inc., Chicago, IL, USA).
Conflict of interest
The authors declare that the research was conducted in the absence of any commercial or financial relationships that could be construed as a potential conflict of interest.
Author contributions
AH, MR, JRE, RTF and GM conceptualized the project. RJ, BC and LJG carried out genotyping and genetic analyses. GM, CRA and FJPC carried out phenotypic measurements. RJ and GM wrote the manuscript. All authors edited and approved the manuscript.
Supporting information
Figure S1 Depiction of genotyping capture probe set design/tiling strategy including (A) collapsing the reference genome (B) the ‘genotyping’ portion as probes scattered across the genome (C) with the ‘gene of interest’ portion in which probes were arranged almost end‐to‐end across the gene body and promoter region.
Figure S2 A heatmap ideogram demonstrating genome‐wide SNP density across the HiBAP panel after all called SNPs were combined and subsequently filtered to remove loci with >10% missing data and a minor allele frequency of less than 5%.
Figure S3 Estimation of the most likely number of true subpopulations (K_number) within the HiBAP panel estimated using the Evanno Method demonstrating the presence of 2 main subpopulations.
Figure S4 Principal component analysis showing genetic variation in the HiBAP panel. A) Panel members when coloured by subpopulation membership deduced using STRUCTURE software. B) Panel members coloured by presence of landrace, synthetic or a combination in their pedigree history.
Figure S5 Genome‐wide Fst calculations between (A) the Elite and Exotic subpopulations and (B) two pseudo‐subpopulations of elite background wheat created by randomly splitting the elite subpopulation into two groups.
Figure S6 SNP density plot of two synthetically derived sister lines where SNPs are in 500 kbp bins. Red bars indicate number of SNPs identified to match modern Ae. Tauschii, blue bars show all other SNPs. Demonstrating the altering levels of introgressed regions, even between members of the same cross and selection history.
Figure S7 SNP density plots for chromosome 1B from each member of the HiBAP panel found to contain the 1BS/1RL Rye introgression. Orange bars indicate the number of SNPs per 500 kbp bin that match the position and allele with those found in between Rye and the wheat reference genome. Blue bars show number of SNPs per bin that do not match Rye genetic variation.
Figure S8 SNP density plots for chromosome 7D from each member of the HiBAP panel found to contain the 7DL/7EL Thinopyrum ponticum introgression. Blue bars show number of SNPs per 500 kbp bin.
Figure S9 Manhattan plots showing GWA results for 23 traits. Blue line depicts the significance threshold of ‐Log10 P 5 and the red line depicts the FDR threshold.
Table S1 DNA sequencing and mapping statistics
Table S2 The distribution of SNPs called against the Refseq1.0 Chinese Spring wheat reference genome.
Table S3 Genome‐wide distribution of SNPs used for GWA analysis
Table S4 Identification of regions of Ae. Tauschii origin in HiBAP lines with Synthetic pedigree history
Table S5 A list of lines found to contain S. cereale/T. ponticum introgressions
Table S6 Pedigree history information for the HiBAP panel
Table S7 Potential candidate genes identified for each association using Knetminer
Acknowledgements
RJ, BC, LG and AH were supported by funding from the BBSRC and IWYP. RJ, LG and AH were supported by funding from the BBSRC and IWYP (BB/N020871/1; BB/P016855/1) and Designing Future Wheat. Part of this work was delivered via the BBSRC National Capability in Genomics and Single Cell Analysis (BBS/E/T/000PR9816) at Earlham Institute by members of the Genomics Pipelines. The work also supported by the NBI Computing infrastructure for Science (CiS) group and the Earlham Institute e‐infrastructure (BBS/E/T/000PR9814). GM, FJPC, CRA and MR were supported by the Sustainable Modernization of Traditional Agriculture (MasAgro) initiative from the Secretariat of Agriculture and Rural Development (SADER) and the International Wheat Yield Partnership (IWYP) project. RTF and JRE were funded by the Grains Research and Development Corporation (GRDC). We acknowledge the GWP Physiology team in Obregon for supporting field experiments management and data collection and Jacob Enk at Arbor Bioscience for assistance with capture development.
Joynson, R. , Molero, G. , Coombes, B. , Gardiner, L.‐J. , Rivera‐Amado, C. , Piñera‐Chávez, F. J. , Evans, J. R. , Furbank, R. T. , Reynolds, M. P. and Hall, A. (2021) Uncovering candidate genes involved in photosynthetic capacity using unexplored genetic variation in Spring Wheat. Plant Biotechnol J, 10.1111/pbi.13568
Contributor Information
Matthew P. Reynolds, Email: m.reynolds@cgiar.org.
Anthony Hall, Email: Anthony.Hall@earlham.ac.uk.
Data Availability Statement
The datasets generated during this study are available in the European Nucleotide Archive repository (www.ebi.ac.uk/ena/) under study name PRJEB38874.
References
- Allen, A.M. , Winfield, M.O. , Burridge, A.J. , Downie, R.C. , Benbow, H.R. , Barker, G.L.A. , Wilkinson, P.A. et al. (2016) Characterization of a Wheat Breeders’ Array suitable for high‐throughput SNP genotyping of global accessions of hexaploid bread wheat (Triticum aestivum). Plant Biotechnol. J. 15, 390–401. [DOI] [PMC free article] [PubMed] [Google Scholar]
- Alvarado, G. , López, M. , Vargas, M. , Pacheco, Á. , Rodríguez, F. , Burgueño, J. and Crossa, J. (2019). META‐R (Multi Environment Trail Analysis with R for Windows) Version 6.04. [Google Scholar]
- Araus, J.‐L. and Cairns, J.E. (2014) Field high‐throughput phenotyping: the new crop breeding frontier. Trends Plant Sci. 19, 52–61. [DOI] [PubMed] [Google Scholar]
- Bhusal, N. , Sharma, P. , Sareen, S. and Sarial, A.K. (2018) Mapping QTLs for chlorophyll content and chlorophyll fluorescence in wheat under heat stress. Biol. Plant. 62, 721–731. [Google Scholar]
- Blackburn, G.A. (2006) Hyperspectral remote sensing of plant pigments. J. Exp. Bot. 58, 855–867. [DOI] [PubMed] [Google Scholar]
- Blum, A. (1990) Variation among wheat cultivars in the response of leaf gas exchange to light. J. Agric. Sci. 115, 305–311. [Google Scholar]
- Bort, J. , Araus, J.L. and Casadesus, J. (2005) Physiologically related tools for the assessment of irrigation systems performance monitoring water status in crop plants. In Irrigation systems performance, Options Méditerranéennes: Série B. Etudes et Recherches, ( Lamaddalena, N. , Lebdi, F. , Todorovic, M. and Bogliotti, C. , eds), pp.251–253. Hammamet (Tunisia): Bari: CIHEAM. https://om.ciheam.org [Google Scholar]
- Browning, B.L. and Browning, S.R. (2016) Genotype imputation with millions of reference samples. Am. J. Human Genet. 98, 116–126. [DOI] [PMC free article] [PubMed] [Google Scholar]
- Burman, N. , Bhatnagar, A. and Khurana, J.P. (2018) OsbZIP48, a HY5 transcription factor ortholog, exerts pleiotropic effects in light‐regulated development. Plant Physiol. 176, 1262–1285. [DOI] [PMC free article] [PubMed] [Google Scholar]
- Carmo‐Silva, E. , Andralojc, P.J. , Scales, J.C. , Driever, S.M. , Mead, A. , Lawson, T. , Raines, C.A. et al. (2017) Phenotyping of field‐grown wheat in the UK highlights contribution of light response of photosynthesis and flag leaf longevity to grain yield. J. Exp. Bot. 68, 3473–3486. [DOI] [PMC free article] [PubMed] [Google Scholar]
- Cazzonelli, C.I. (2011) Carotenoids in nature: insights from plants and beyond. Funct. Plant Biol. 38, 833–847. [DOI] [PubMed] [Google Scholar]
- Chapman, S.C. , Merz, T. , Chan, A. , Jackway, P. , Hrabar, S. , Dreccer, M.F. , Holland, E. et al. (2014) Pheno‐copter: a low‐altitude, autonomous remote‐sensing robotic helicopter for high‐throughput field‐based phenotyping. Agronomy, 4, 279–301. [Google Scholar]
- Chen, L.‐Q. , Qu, X.‐Q. , Hou, B.‐H. , Sosso, D. , Osorio, S. , Fernie, A.R. and Frommer, W.B. (2012) Sucrose efflux mediated by SWEET proteins as a key step for phloem transport. Science (New York, NY), 335, 207–211. [DOI] [PubMed] [Google Scholar]
- Cingolani, P. , Platts, A. , Wang, L.L. , Coon, M. , Nguyen, T. , Wang, L. , Land, S.J. et al. (2012) A program for annotating and predicting the effects of single nucleotide polymorphisms, SnpEff. Fly, 6, 80–92. [DOI] [PMC free article] [PubMed] [Google Scholar]
- Coast, O. , Shah, S. , Ivakov, A. , Gaju, O. , Wilson, P.B. , Posch, B.C. , Bryant, C.J. et al. (2019) Predicting dark respiration rates of wheat leaves from hyperspectral reflectance. Plant, Cell Environ. 42, 2133–2150. [DOI] [PubMed] [Google Scholar]
- Colmer, T.D. , Flowers, T.J. and Munns, R. (2006) Use of wild relatives to improve salt tolerance in wheat. J. Exp. Bot. 57, 1059–1078. [DOI] [PubMed] [Google Scholar]
- Cossani, C.M. and Reynolds, M.P. (2015) Heat stress adaptation in elite lines derived from synthetic hexaploid wheat. Crop Sci. 55, 2719–2735. [Google Scholar]
- Czyczyło‐Mysza, I. , Tyrka, M. , Marcińska, I. , Skrzypek, E. , Karbarz, M. , Dziurka, M. , Hura, T. et al. (2013) Quantitative trait loci for leaf chlorophyll fluorescence parameters, chlorophyll and carotenoid contents in relation to biomass and yield in bread wheat and their chromosome deletion bin assignments. Mol. Breed. 32, 189–210. [DOI] [PMC free article] [PubMed] [Google Scholar]
- Danisman, S. , van der Wal, F. , Dhondt, S. , Waites, R. , de Folter, S. , Bimbo, A. , van Dijk, A.D. et al. (2012) Arabidopsis Class I and Class II TCP transcription factors regulate Jasmonic acid metabolism and leaf development antagonistically. Plant Physiol. 159, 1511–1523. [DOI] [PMC free article] [PubMed] [Google Scholar]
- Das, M.K. , Bai, G. , Mujeeb‐Kazi, A. and Rajaram, S. (2016) Genetic diversity among synthetic hexaploid wheat accessions (Triticum aestivum) with resistance to several fungal diseases. Genet. Resour. Crop Evol. 63, 1285–1296. [Google Scholar]
- Davison, P.A. and Hunter, C.N. (2011) Abolition of magnesium chelatase activity by the gun5 mutation and reversal by Gun4. FEBS Lett. 585, 183–186. [DOI] [PubMed] [Google Scholar]
- Demmig‐Adams, B. (1990). Carotenoids and photoprotection in plants: A role for the xanthophyll zeaxanthin. Biochimica et Biophysica Acta (BBA) – Bioenerget. 1020, 1–24. [Google Scholar]
- Driever, S.M. , Lawson, T. , Andralojc, P.J. , Raines, C.A. and Parry, M.A.J. (2014) Natural variation in photosynthetic capacity, growth, and yield in 64 field‐grown wheat genotypes. J. Exp. Bot. 65, 4959–4973. [DOI] [PMC free article] [PubMed] [Google Scholar]
- Dvorak, J. , Luo, M.C. , Yang, Z.L. and Zhang, H.B. (1998) The structure of the Aegilops tauschii genepool and the evolution of hexaploid wheat. Theoret. Appl. Genet. 97, 657–670. [Google Scholar]
- Earl, D.A. and vonHoldt, B.M. (2012) STRUCTURE HARVESTER: a website and program for visualizing STRUCTURE output and implementing the Evanno method. Conserv. Genet. Resourc. 4, 359–361. [Google Scholar]
- Evanno, G. , Regnaut, S. and Goudet, J. (2005) Detecting the number of clusters of individuals using the software structure: a simulation study. Mol. Ecol. 14, 2611–2620. [DOI] [PubMed] [Google Scholar]
- Evans, J.R. and Clarke, V.C. (2018) The nitrogen cost of photosynthesis. J. Exp. Bot. 70, 7–15. [DOI] [PubMed] [Google Scholar]
- Filella, I. , Serrano, L. , Serra, J. and Peñuelas, J. (1995) Evaluating wheat nitrogen status with canopy reflectance indices and discriminant analysis. Crop Sci. 35, 1400–1405. [Google Scholar]
- Fischer, R.A. , Rees, D. , Sayre, K.D. , Lu, Z.M. , Condon, A.G. and Saavedra, A.L. (1998) Wheat yield progress associated with higher stomatal conductance and photosynthetic rate, and cooler canopies. Crop Sci. 38, 1467–1475. [Google Scholar]
- Furbank, R.T. , Berni, J.A.J. , Jaeggli, B.G. , Potgieter, A.B. and Deery, D.M. (2019) Field crop phenomics: enabling breeding for radiation use efficiency and biomass in cereal crops. New Phytol. 223, 1714–1727. [DOI] [PubMed] [Google Scholar]
- Gardiner, L.‐J. , Joynson, R. , Omony, J. , Rusholme‐Pilcher, R. , Olohan, L. , Lang, D. , Bai, C. et al. (2018) Hidden variation in polyploid wheat drives local adaptation. Genome Res. 28, 1319–1332. [DOI] [PMC free article] [PubMed] [Google Scholar]
- Gardiner, L.‐J. , Wingen, L.U. , Bailey, P. , Joynson, R. , Brabbs, T. , Wright, J. , Higgins, J.D. et al. (2019) Analysis of the recombination landscape of hexaploid bread wheat reveals genes controlling recombination and gene conversion frequency. Genome Biol. 20, 69. [DOI] [PMC free article] [PubMed] [Google Scholar]
- Gizaw, S.A. , Godoy, J.G.V. , Pumphrey, M.O. and Carter, A.H. (2018) Spectral reflectance for indirect selection and genome‐wide association analyses of grain yield and drought tolerance in North American spring wheat. Crop Sci. 58, 2289–2301. [Google Scholar]
- Gu, J. , Zhou, Z. , Li, Z. , Chen, Y. , Wang, Z. and Zhang, H. (2017) Rice (Oryza sativa L.) with reduced chlorophyll content exhibit higher photosynthetic rate and efficiency, improved canopy light distribution, and greater yields than normally pigmented plants. Field. Crop. Res. 200, 58–70. [Google Scholar]
- Haas, M. , Schreiber, M. and Mascher, M. (2019) Domestication and crop evolution of wheat and barley: Genes, genomics, and future directions. J. Integr. Plant Biol. 61, 204–225. [DOI] [PubMed] [Google Scholar]
- Hamblin, J. , Stefanova, K. and Angessa, T.T. (2014) Variation in chlorophyll content per unit leaf area in spring wheat and implications for selection in segregating material. PLoS One, 9, e92529. [DOI] [PMC free article] [PubMed] [Google Scholar]
- Hao, M. , Zhang, L. , Ning, S. , Huang, L. , Yuan, Z. , Wu, B. , Yan, Z. et al. (2020) The Resurgence of introgression breeding, as exemplified in wheat improvement. Front. Plant Sci. 11, 396. [DOI] [PMC free article] [PubMed] [Google Scholar]
- Hassani‐Pak, K. , Singh, A. , Brandizi, M. , Hearnshaw, J. , Amberkar, S. , Phillips, A.L. , Doonan, J.H. et al. (2020). KnetMiner: a comprehensive approach for supporting evidence‐based gene discovery and complex trait analysis across species. bioRxiv, 10 (17), 2020.04.02.017004. [DOI] [PMC free article] [PubMed] [Google Scholar]
- He, P. , Wu, S. , Jiang, Y. , Zhang, L. , Tang, M. , Xiao, G. and Yu, J. (2019) GhYGL1d, a pentatricopeptide repeat protein, is required for chloroplast development in cotton. BMC Plant Biol. 19, 1–12. [DOI] [PMC free article] [PubMed] [Google Scholar]
- Huang, J. , Wei, C. , Zhang, Y. , Blackburn, G.A. , Wang, X. , Wei, C. and Wang, J. (2015) Meta‐analysis of the detection of plant pigment concentrations using hyperspectral remotely sensed data. PLoS One, 10, e0137029. [DOI] [PMC free article] [PubMed] [Google Scholar]
- Hubbart, S. , Smillie, I.R.A. , Heatley, M. , Swarup, R. , Foo, C.C. , Zhao, L. and Murchie, E.H. (2018) Enhanced thylakoid photoprotection can increase yield and canopy radiation use efficiency in rice. Commun. Biol. 1, 1–12. [DOI] [PMC free article] [PubMed] [Google Scholar]
- Imtiaz, M. , Ogbonnaya, F.C. , Oman, J. and van Ginkel, M. (2008) Characterization of quantitative trait loci controlling genetic variation for preharvest sprouting in synthetic backcross‐derived wheat lines. Genetics, 178, 1725–1736. [DOI] [PMC free article] [PubMed] [Google Scholar]
- IWGSC, T.I.W.G.S.C. , Appels, R. , Eversole, K. , Stein, N. , Feuillet, C. , Keller, B. , Rogers, J. et al. (2018). Shifting the limits in wheat research and breeding using a fully annotated reference genome. Science (New York, NY), 361(6403), eaar7191. [DOI] [PubMed] [Google Scholar]
- Jafarzadeh, J. , Bonnett, D. , Jannink, J.‐L. , Akdemir, D. , Dreisigacker, S. and Sorrells, M.E. (2016) Breeding value of primary synthetic wheat genotypes for grain yield. PLoS One, 11, e0162860. [DOI] [PMC free article] [PubMed] [Google Scholar]
- Jakobsson, M. and Rosenberg, N.A. (2007) CLUMPP: a cluster matching and permutation program for dealing with label switching and multimodality in analysis of population structure. Bioinformatics (Oxford, England), 23, 1801–1806. [DOI] [PubMed] [Google Scholar]
- Johnson, H.W. , Robinson, H.F. and Comstock, R.E. (1955) Estimates of genetic and environmental variability in soybeans1. Agron. J. 47, 314–318. [Google Scholar]
- Kang, H.M. , Ye, C. and Eskin, E. (2008) Accurate discovery of expression quantitative trait loci under confounding from spurious and genuine regulatory hotspots. Genetics, 180, 1909–1925. [DOI] [PMC free article] [PubMed] [Google Scholar]
- Kishii, M. (2019) An update of recent use of aegilops species in wheat breeding. Front. Plant Sci. 10, 417. [DOI] [PMC free article] [PubMed] [Google Scholar]
- Li, A. , Liu, D. , Yang, W. , Kishii, M. and Mao, L. (2018) Synthetic hexaploid wheat: yesterday, today, and tomorrow. Engineering, 4, 552–558. [Google Scholar]
- Li, H. and Durbin, R. (2009) Fast and accurate short read alignment with Burrows‐Wheeler transform. Bioinformatics (Oxford, England), 25, 1754–1760. [DOI] [PMC free article] [PubMed] [Google Scholar]
- Li, H. , Handsaker, B. , Wysoker, A. , Fennell, T. , Ruan, J. , Homer, N. , Marth, G. et al. (2009) The sequence alignment/map format and SAMtools. Bioinformatics (Oxford, England), 25, 2078–2079. [DOI] [PMC free article] [PubMed] [Google Scholar]
- Lipka, A.E. , Tian, F. , Wang, Q. , Peiffer, J. , Li, M. , Bradbury, P.J. , Gore, M.A. et al. (2012) GAPIT: genome association and prediction integrated tool. Bioinformatics (Oxford, England), 28, 2397–2399. [DOI] [PubMed] [Google Scholar]
- Liu, C. , Pinto, F. , Cossani, C.M. , Sukumaran, S. and Reynolds, M.P. (2019) Spectral reflectance indices as proxies for yield potential and heat stress tolerance in spring wheat: heritability estimates and marker‐trait associations. Front. Agric. Sci.Eng. 6, 296–308. [Google Scholar]
- Liu, X. , Zhang, Y. , Yang, C. , Tian, Z. and Li, J. (2016) AtSWEET4, a hexose facilitator, mediates sugar transport to axial sinks and affects plant development. Sci. Rep. 6, 1–12. [DOI] [PMC free article] [PubMed] [Google Scholar]
- Lopes, M.S. , El‐Basyoni, I. , Baenziger, P.S. , Singh, S. , Royo, C. , Ozbek, K. , Aktas, H. et al. (2015) Exploiting genetic diversity from landraces in wheat breeding for adaptation to climate change. J. Exp. Bot. 66, 3477–3486. [DOI] [PubMed] [Google Scholar]
- Lopes, M.S. and Reynolds, M.P. (2011) Drought adaptive traits and wide adaptation in elite lines derived from resynthesized hexaploid wheat. Crop Sci. 51, 1617–1626. [Google Scholar]
- Lowe, A. , Harrison, N. and French, A.P. (2017) Hyperspectral image analysis techniques for the detection and classification of the early onset of plant disease and stress. Plant Methods, 13, 1–12. [DOI] [PMC free article] [PubMed] [Google Scholar]
- Luo, M.‐C. , Gu, Y.Q. , Puiu, D. , Wang, H. , Twardziok, S.O. , Deal, K.R. , Huo, N. et al. (2017) Genome sequence of the progenitor of the wheat D genome Aegilops tauschii . Nature, 551, 498. [DOI] [PMC free article] [PubMed] [Google Scholar]
- Manès, Y. , Gomez, H.F. , Puhl, L. , Reynolds, M. , Braun, H.J. and Trethowan, R. (2012) Genetic yield gains of the CIMMYT international semi‐arid wheat yield trials from 1994 to 2010. Crop Sci. 52, 1543–1552. [Google Scholar]
- McCormac, A.C. and Terry, M.J. (2004) The nuclear genes Lhcb and HEMA1 are differentially sensitive to plastid signals and suggest distinct roles for the GUN1 and GUN5 plastid‐signalling pathways during de‐etiolation. Plant J. 40, 672–685. [DOI] [PubMed] [Google Scholar]
- McKenna, A. , Hanna, M. , Banks, E. , Sivachenko, A. , Cibulskis, K. , Kernytsky, A. , Garimella, K. et al. (2010) The Genome Analysis Toolkit: A MapReduce framework for analyzing next‐generation DNA sequencing data. Genome Res. 20, 1297–1303. [DOI] [PMC free article] [PubMed] [Google Scholar]
- Molero, G. , Joynson, R. , Pinera‐Chavez, F.J. , Gardiner, L.‐J. , Rivera‐Amado, C. , Hall, A. and Reynolds, M.P. (2019) Elucidating the genetic basis of biomass accumulation and radiation use efficiency in spring wheat and its role in yield potential. Plant Biotechnol. J. 17, 1276–1288. [DOI] [PMC free article] [PubMed] [Google Scholar]
- Murchie, E.H. , Ali, A. and Herman, T. (2015) Photoprotection as a trait for rice yield improvement: status and prospects. Rice, 8, 1–9. [DOI] [PMC free article] [PubMed] [Google Scholar]
- Murchie, E.H. , Kefauver, S. , Araus, J.‐L. , Muller, O. , Rascher, U. , Flood, P.J. and Lawson, T. (2018) Measuring the dynamic photosynthome. Ann. Bot. 122, 207–220. [DOI] [PMC free article] [PubMed] [Google Scholar]
- Niu, Z. , Klindworth, D.L. , Yu, G. , Friesen, T.L. , Chao, S. , Jin, Y. , Cai, X. et al. (2014) Development and characterization of wheat lines carrying stem rust resistance gene Sr43 derived from Thinopyrum ponticum. Theor. Appl. Genet. 127, 969–980. [DOI] [PubMed] [Google Scholar]
- Nyine, M. , Adhikari, E. , Clinesmith, M. , Jordan, K.W. , Fritz, A.K. and Akhunov, E. (2020) Genomic patterns of introgression in interspecific populations created by crossing wheat with its wild relative. bioRxiv, 97, 855106. [DOI] [PMC free article] [PubMed] [Google Scholar]
- Ort, D.R. , Zhu, X. and Melis, A. (2011) Optimizing antenna size to maximize photosynthetic efficiency. Plant Physiol. 155, 79–85. [DOI] [PMC free article] [PubMed] [Google Scholar]
- Peñuelas, J. and Filella, I. (1998) Visible and near‐infrared reflectance techniques for diagnosing plant physiological status. Trends Plant Sci. 3, 151–156. [Google Scholar]
- Pont, C. , Leroy, T. , Seidel, M. , Tondelli, A. , Duchemin, W. , Armisen, D. , Lang, D. et al. (2019) Tracing the ancestry of modern bread wheats. Nat. Genet. 51, 905–911. [DOI] [PubMed] [Google Scholar]
- Pritchard, J.K. , Stephens, M. and Donnelly, P. (2000) Inference of population structure using multilocus genotype data. Genetics, 155, 945–959. [DOI] [PMC free article] [PubMed] [Google Scholar]
- Ren, T.‐H. , Yang, Z.‐J. , Yan, B.‐J. , Zhang, H.‐Q. , Fu, S.‐L. and Ren, Z.‐L. (2009) Development and characterization of a new 1BL.1RS translocation line with resistance to stripe rust and powdery mildew of wheat. Euphytica, 169, 207–213. [Google Scholar]
- Reynolds, M. , Chapman, S. , Crespo‐Herrera, L. , Molero, G. , Mondal, S. , Pequeno, D.N.L. , Pinto, F. et al. (2020) Breeder friendly phenotyping. Plant Sci. 295, 110396. [DOI] [PubMed] [Google Scholar]
- Rimbert, H. , Darrier, B. , Navarro, J. , Kitt, J. , Choulet, F. , Leveugle, M. and Duarte, J. et al. (2018) High throughput SNP discovery and genotyping in hexaploid wheat. PLoS One, 13, e0186329. [DOI] [PMC free article] [PubMed] [Google Scholar]
- Rosyara, U. , Kishii, M. , Payne, T. , Sansaloni, C.P. , Singh, R.P. , Braun, H.‐J. and Dreisigacker, S. (2019) Genetic contribution of synthetic hexaploid wheat to CIMMYT’s spring bread wheat breeding germplasm. Sci. Rep. 9, 1862. [DOI] [PMC free article] [PubMed] [Google Scholar]
- Sayre, K.D. , Rajaram, S. and Fischer, R.A. (1997) Yield potential progress in short bread wheats in Northwest Mexico. Crop Sci. 37, 36–42. [Google Scholar]
- Silva‐Perez, V. , De Faveri, J. , Molero, G. , Deery, D.M. , Condon, A.G. , Reynolds, M.P. , Evans, J.R. et al. (2019) Genetic variation for photosynthetic capacity and efficiency in spring wheat. J. Exp. Bot. 71, 2299–2311. [DOI] [PMC free article] [PubMed] [Google Scholar]
- Silva‐Perez, V. , Molero, G. , Serbin, S.P. , Condon, A.G. , Reynolds, M.P. , Furbank, R.T. and Evans, J.R. (2017) Hyperspectral reflectance as a tool to measure biochemical and physiological traits in wheat. J. Exp. Bot. 69, 483–496. [DOI] [PMC free article] [PubMed] [Google Scholar]
- Slattery, R.A. , VanLoocke, A. , Bernacchi, C.J. , Zhu, X.‐G. and Ort, D.R. (2017) Photosynthesis, light use efficiency, and yield of reduced‐chlorophyll soybean mutants in field conditions. Front. Plant Sci. 8, 526. [DOI] [PMC free article] [PubMed] [Google Scholar]
- Tang, Y. , Wu, X. , Li, C. , Yang, W. , Huang, M. , Ma, X. and Li, S. (2017) Yield, growth, canopy traits and photosynthesis in high‐yielding, synthetic hexaploid‐derived wheats cultivars compared with non‐synthetic wheats. Crop Pasture Sci. 68, 115–125. [Google Scholar]
- Tattaris, M. , Reynolds, M.P. and Chapman, S.C. (2016) A direct comparison of remote sensing approaches for high‐throughput phenotyping in plant breeding. Front. Plant Sci. 7, 61. [DOI] [PMC free article] [PubMed] [Google Scholar]
- Toledo‐Ortiz, G. , Johansson, H. , Lee, K.P. , Bou‐Torrent, J. , Stewart, K. , Steel, G. , Rodríguez‐Concepción, M. et al. (2014) The HY5‐PIF regulatory module coordinates light and temperature control of photosynthetic gene transcription. PLoS Genet. 10, e1004416. [DOI] [PMC free article] [PubMed] [Google Scholar]
- Velu, G. , Singh, R.P. , Crespo‐Herrera, L. , Juliana, P. , Dreisigacker, S. , Valluru, R. , Stangoulis, J. et al. (2018) Genetic dissection of grain zinc concentration in spring wheat for mainstreaming biofortification in CIMMYT wheat breeding. Sci. Rep. 8, 1–10. [DOI] [PMC free article] [PubMed] [Google Scholar]
- Wang, S. , Wong, D. , Forrest, K. , Allen, A. , Chao, S. , Huang, B.E. , Maccaferri, M. et al. (2014) Characterization of polyploid wheat genomic diversity using a high‐density 90 000 single nucleotide polymorphism array. Plant Biotechnol. J. 12, 787–796. [DOI] [PMC free article] [PubMed] [Google Scholar]
- Watanabe, N. , Evans, J.R. and Chow, W.S. (1994) Changes in the photosynthetic properties of Australian wheat cultivars over the last century. Funct. Plant Biol. 21(2), 169–183. [Google Scholar]
- Wicker, T. , Gundlach, H. , Spannagl, M. , Uauy, C. , Borrill, P. , Ramirez‐Gonzalez, R.H. , De Oliveira, R. et al. (2018) Impact of transposable elements on genome structure and evolution in bread wheat. Genome Biol. 19, 103. [DOI] [PMC free article] [PubMed] [Google Scholar]
- Xing, L. , Di, Z. , Yang, W. , Liu, J. , Li, M. , Wang, X. , Cui, C. et al. (2017) Overexpression of ERF1‐V from Haynaldia villosa can enhance the resistance of wheat to powdery mildew and increase the tolerance to salt and drought stresses. Front. Plant Sci. 8, 169. [DOI] [PMC free article] [PubMed] [Google Scholar]
- Yu, Q.‐B. , Jiang, Y. , Chong, K. and Yang, Z.‐N. (2009) AtECB2, a pentatricopeptide repeat protein, is required for chloroplast transcript accDRNA editing and early chloroplast biogenesis in Arabidopsis thaliana . Plant J. 59, 1011–1023. [DOI] [PubMed] [Google Scholar]
- Zhou, Y. , Liu, L. , Huang, W. , Yuan, M. , Zhou, F. , Li, X. and Lin, Y. (2014) Overexpression of OsSWEET5 in rice causes growth retardation and precocious senescence. PLoS One, 9, e94210. [DOI] [PMC free article] [PubMed] [Google Scholar]
- Zhu, X.‐G. , Long, S.P. and Ort, D.R. (2010) Improving photosynthetic efficiency for greater yield. Annu. Rev. Plant Biol. 61, 235–261. [DOI] [PubMed] [Google Scholar]
Associated Data
This section collects any data citations, data availability statements, or supplementary materials included in this article.
Supplementary Materials
Figure S1 Depiction of genotyping capture probe set design/tiling strategy including (A) collapsing the reference genome (B) the ‘genotyping’ portion as probes scattered across the genome (C) with the ‘gene of interest’ portion in which probes were arranged almost end‐to‐end across the gene body and promoter region.
Figure S2 A heatmap ideogram demonstrating genome‐wide SNP density across the HiBAP panel after all called SNPs were combined and subsequently filtered to remove loci with >10% missing data and a minor allele frequency of less than 5%.
Figure S3 Estimation of the most likely number of true subpopulations (K_number) within the HiBAP panel estimated using the Evanno Method demonstrating the presence of 2 main subpopulations.
Figure S4 Principal component analysis showing genetic variation in the HiBAP panel. A) Panel members when coloured by subpopulation membership deduced using STRUCTURE software. B) Panel members coloured by presence of landrace, synthetic or a combination in their pedigree history.
Figure S5 Genome‐wide Fst calculations between (A) the Elite and Exotic subpopulations and (B) two pseudo‐subpopulations of elite background wheat created by randomly splitting the elite subpopulation into two groups.
Figure S6 SNP density plot of two synthetically derived sister lines where SNPs are in 500 kbp bins. Red bars indicate number of SNPs identified to match modern Ae. Tauschii, blue bars show all other SNPs. Demonstrating the altering levels of introgressed regions, even between members of the same cross and selection history.
Figure S7 SNP density plots for chromosome 1B from each member of the HiBAP panel found to contain the 1BS/1RL Rye introgression. Orange bars indicate the number of SNPs per 500 kbp bin that match the position and allele with those found in between Rye and the wheat reference genome. Blue bars show number of SNPs per bin that do not match Rye genetic variation.
Figure S8 SNP density plots for chromosome 7D from each member of the HiBAP panel found to contain the 7DL/7EL Thinopyrum ponticum introgression. Blue bars show number of SNPs per 500 kbp bin.
Figure S9 Manhattan plots showing GWA results for 23 traits. Blue line depicts the significance threshold of ‐Log10 P 5 and the red line depicts the FDR threshold.
Table S1 DNA sequencing and mapping statistics
Table S2 The distribution of SNPs called against the Refseq1.0 Chinese Spring wheat reference genome.
Table S3 Genome‐wide distribution of SNPs used for GWA analysis
Table S4 Identification of regions of Ae. Tauschii origin in HiBAP lines with Synthetic pedigree history
Table S5 A list of lines found to contain S. cereale/T. ponticum introgressions
Table S6 Pedigree history information for the HiBAP panel
Table S7 Potential candidate genes identified for each association using Knetminer
Data Availability Statement
The datasets generated during this study are available in the European Nucleotide Archive repository (www.ebi.ac.uk/ena/) under study name PRJEB38874.