Abstract
The advent of cisplatin as a cancer drug in the late 1960s generated considerable interest in the use of transition metal complexes as cancer therapy agents. Despite enhanced research in this area, there has yet to be any non-platinum-based transition metal complex cancer drugs approved by the Food and Drug Administration (FDA). Recently a Ru(II) metal-organic dyad (TLD1433) has provided promising results as a photodynamic therapy (PDT) agent for some types of cancer. This particularly effective PDT compound has an oligothiophene chain appended to an imidazophenanthroline ligand which chelates Ru(II). The entire complex is chiral and is synthesized as a racemate. Five such chiral Ru(II) and Os(II) PDT agents were synthesized and their enantiomers separated for the first time. The enantiomers of these compounds are not easily crystalized. However, preparative LC provided sufficient amounts of these novel PDT agents to determine their absolute configurations by vibrational circular dichroism (VCD). The synthesis, separation and absolute configuration determinations are described and discussed in detail.
Keywords: Cancer drugs, Enantiomeric separations, Vibrational Circular Dichroism (VCD), Ru and Os dyads
I. Introduction
Metals are essential components of all cells and are frequently found in enzymes which catalyze reactions that are necessary for all living systems [2]. Rosenberg’s 1969 report on the effect of cisplatin as a potent antitumor agent started a new era of metal-based cancer drugs [2]. Over time, resistance to cisplatin developed and other related platinum-based drugs (e.g. oxaliplatin and carboplatin) were designed, some of which had better safety profiles in patients [3]. Given this potential, research on metal-based cancer drugs has increased substantially [1–4]. However, there has not been a concurrent increase in FDA approved metal-based compounds for cancer therapies, for a variety of reasons, including: toxicity, efficacy or lack of significant advantage over current approved drugs. Many think this scenario is about to change due to a combination of factors. First, different types of transition metal compounds are being developed that previously had not been considered as candidates for cancer therapeutic agents. For example, certain ruthenium (Ru) and osmium (Os) compounds appear to have attractive cytotoxic and anticancer attributes. Second, the type of cancers treated and the manner in which the therapy is administered has broadened. One such highly important area is photodynamic therapy (PDT). PDT is a light-dependent form of cancer therapy that uses photosensitizers, photons and oxygen to destroy tumors and also has shown to induce an immune response that can protect against recurrence [5,6]. Activation of the photosensitizers by specific wavelengths of light produces triplet excited states that interact with oxygen to generate reactive oxygen species (ROS) such as singlet oxygen, which is thought to be the most important species. ROS are implicated in a wide variety of physiological processes, both deleterious and if properly utilized, beneficial (vide infra) [7]. Currently, the only FDA approved photosensitizer for the treatment of cancer is Photofrin, which functions exclusively through ROS generation [8,9]. Photofrin (or Porfimer sodium) is a mixture of oligomers or heamatoporphyria (up to eight porphyrin units). Unfortunately, some of the most aggressive and drug resistant cancer tumors are hypoxic [10]. Consequently, there is considerable interest in the design of photosensitizers that act through oxygen independent mechanisms or that are effective in trace-oxygen environments, thereby maintaining activity in hypoxia [11–13].
Photocytoxicity in hypoxia has proven to be very difficult to achieve [14,15]. We have shown that it is possible to obtain potent photocytotoxic effects in such environments by using Ru(II) or Os(II) metal-organic dyads, where the metal center is chelated to an imidazo[4,5-f][1,10] phenanthroline ligand that is appended to an oligothiophene chain (Fig. 1) [4,15,16]. The role of the metal is to facilitate the formation of triplet states through intersystem crossing. The role of the ligand is to establish an “organic” triplet state that is lower in energy than the metal-to-ligand charge transfer states that usually dominate Ru(II) and Os(II) polypyridyl photophysics. The oligothiophene moiety (Fig. 1) is particularly important because it introduces charge transfer character to otherwise nonpolar intraligand excited states. The resulting intraligand charge transfer excited states are capable of sensitizing singlet oxygen even in hypoxia [13,14]. Further, they may also facilitate oxygen-independent photoredox reactions that contribute to the overall phototoxicity. This scaffold is the basis for the first Ru(II)-based photosensitizer to advance to human clinical trials [17]. Indeed, racemic compound A, known as TLD1433, (Fig. 1) is currently in phase 2 clinical trials for treating nonmuscle invasive bladder cancer (NMIBC) [4,17].
Fig. 1.
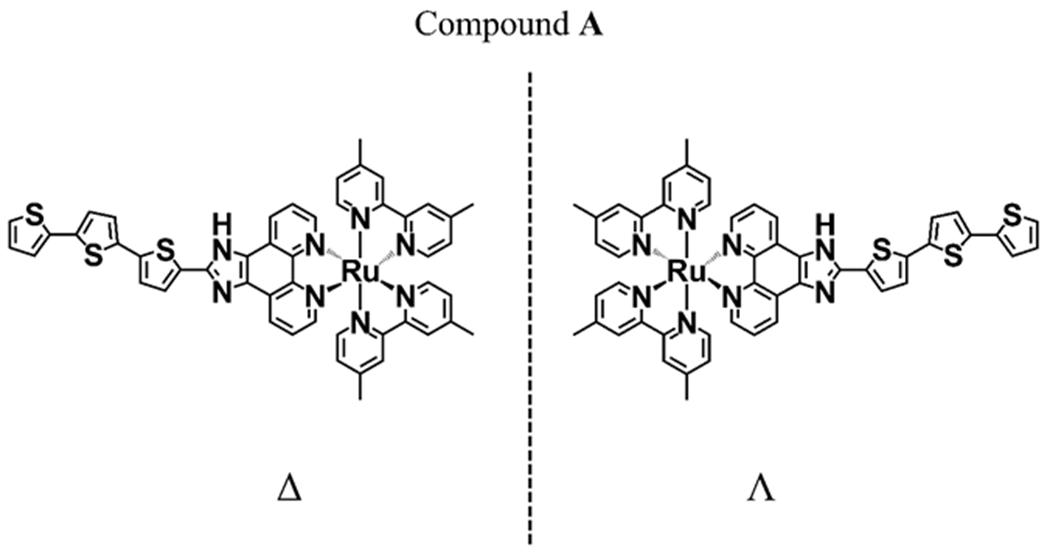
Structure of Compound A enantiomers
It must be noted that all octahedral complexes of Ru(II) and Os(II) with bidentate ligands, as in Fig. 1, are chiral and can exist as delta (Δ) and lambda (Ʌ) enantiomers. The procedures used to synthesize them (see Materials and methods) produce racemates. The FDA requires that both enantiomers of new active pharmaceutical ingredients (APIs) must be thoroughly tested because they could have different potencies, toxicities, side effects, etc. [18–22]. To our knowledge there has never been a chiral octahedral transitional metal complex approved as a drug by the FDA. Further, racemates of compound A (Fig. 1) and related compounds have not been enantiomerically resolved, stereochemically synthesized or had their absolute configuration determined by any means. A necessary first step toward understanding the mechanism of action of compound A (TLD1433) as a racemate and related Ru(II) and Os(II) metal-organic dyads is to understand any differences in the biological properties and phototoxic activities of the enantiopure metal complexes. While the photophysical properties of enantiomers should be identical, their association with biological targets may, in fact, lead to differences not only in their physicochemical properties, but also their photophysical properties in the chiral environment of cells and tumors. These factors would, in turn, have implications for the development of next-generation transition metal complexes as photosensitizers for PDT.
Herein, we report the first enantiomeric separation and absolute configuration determinations of five chiral oligothiophene-containing transition metal complex photosensitizers for use in cancer PDT. Compound A was included because it is the transition metal complex racemate currently in Phase 2 clinical trials. Compound B (Fig. 2) is of interest to probe the influence of the oligothienyl chain length on any differences in the phototoxic properties of the enantiomers compared to those of compound A. Compounds C and D (Fig. 2) will determine if fluorination of the coligands has any effect on these properties, given that these derivatives are of interest as radioisotope relatives of TLD1433. While compounds B-D were selected for their relationship to A, compound E (Fig. 2) represents the parent transition metal complex for a parallel pipeline of hypoxia-active phototoxic compounds and was included in this study for that reason.
Fig. 2.
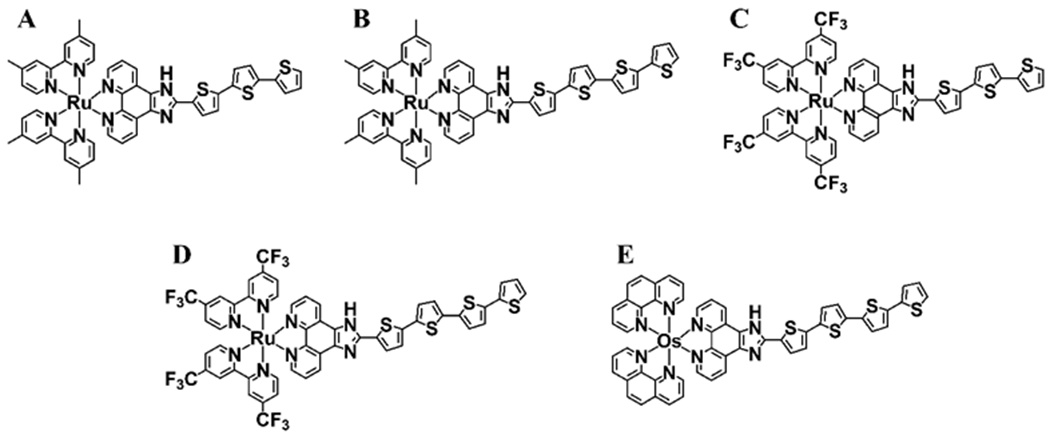
Structures of five Ru and Os transition metal compounds used in this study.
2. Materials and methods
2.1. Chemicals
Solvents and additives including HPLC grade acetonitrile (ACN), methanol (MeOH), methylene chloride (CH2Cl2), acetic acid (AA), formic acid (FA), trifluoroacetic acid (TFA), triethylamine (TEA), potassium hexafluorophosphate (KPF6), potassium nitrate (KNO3.), hydrochloric acid (HCl), Amberlite IRA-410 resin and Sephadex LH-20 were obtained from Sigma Aldrich (St. Louis, MO, USA). 5-Bromo-5’’-formyl-2,2’:5’,2’’-terthiophene and 2-(tributylstannyl) thiophene, were obtained from Alfa Aesar (Ward Hill, MA, USA) and Fisher Scientific (Waltham, MA, USA) respectively.
2.2. Synthesis and characterization
The structures of racemic transition metal compounds A, B, C, D and E are shown in Fig. 2. Compounds A, B and E were synthesized as per previously reported methods [14,16]. The syntheses of compounds C and D are as follows. The general procedure for preparing metal complexes of the type [Ru(LL)2(IP-nT)]Cl2 (LL=4,4′-dmb, 4,4′-dtfmb, or phen; n=3,4) involves the independent synthesis of the Ru(LL)2Cl2 precursor [23] and the IP-nT ligands [14,24] and their subsequent complexation as we have described previously. Briefly, Ru(LL)2Cl2 and IP-nT were combined in ethylene glycol and stirred under microwave irradiation at 180 °C for 15 minutes. The metal complexes were precipitated as their PF6− salts using KPF6 and purified via silica gel flash column chromatography using a gradient of ACN to 10% water in ACN, followed by 7.5% water in ACN with 0.5% KNO3. The PF6− salts of the complexes were then converted to their corresponding Cl− salts via anion metathesis on HCl-treated Amberlite IRA-410 resin with methanol as the eluent and purified further via size exclusion chromatography on Sephadex LH-20 with methanol as the eluent. The structures and purities of C and D were confirmed by 1H NMR and 1H–1H COSY NMR see Appendix A-Supplementary material (Figures S1–S4), HPLC (Figures S5–S6) and high-resolution ESI+–MS (Figures S7–S8). NMR assignments were made from these data and in consultation with the literature [14,25]. The Cl− salts of the metal complexes were used for enantiomeric separations, and the PF6− salts were used for determining the absolute configurations as outlined in the following Sections 2.3–2.6.
[Ru(4,4′-dtfmb)2(IP-3T)]Cl2 (compound C) Ru(4,4′-dtfmb)2Cl2 (151 mg, 0.2 mmol) and IP-3T (76 mg, 0.167 mmol) were added to a microwave vessel containing argon-purged ethylene glycol (4 mL) and subjected to microwave irradiation at 180°C for 15 minutes. The resulting dark red solution was then transferred to a separatory funnel with deionized water (25 mL) and CH2Cl2 (25 mL). After gentle agitation, the CH2Cl2 was drained and the remaining aqueous layer was washed with CH2Cl2 (25 mL) until the CH2Cl2 layer was colorless. Then, CH2Cl2 (25 mL) and saturated aqueous KPF6 (5 mL) were added, and the mixture was shaken gently. The CH2Cl2 layer was drained and the product was further extracted from the aqueous layer with CH2Cl2 (25 mL) until the aqueous layer was colorless. The CH2Cl2 extracts were then combined and concentrated under reduced pressure via rotary evaporation. The crude product was then purified using silica gel flash column chromatography with a gradient of ACN to 10% water in ACN, followed by 7.5% water in ACN with 0.5% KNO3. The product-containing fractions were then combined and concentrated under vacuum, then transferred to a separatory funnel with CH2Cl2 (25 mL), deionized water (25 mL), and saturated aqueous KPF6 (1 mL). The resulting mixture was gently agitated and the CH2Cl2 layer was drained. Additional CH2Cl2 (25 mL) was used to extract the remaining product until the aqueous layer was colorless. The CH2Cl2 layers were then combined and concentrated via rotary evaporation. The resulting product was then further dried under vacuum to yield [Ru(4,4′-dtfmb)2(IP-3T)](PF6)2. The PF6− salt was then converted to the corresponding Cl− salt in quantitative yield using Amberlite IRA-410 with MeOH as the eluent, followed by further purification using Sephadex LH-20 with MeOH as the eluent, yielding the desired product C as a dark red solid (55 mg, 27%). 1H NMR (700 MHz, MeOD-d3, ppm): δ 9.40 (d, J = 2.0 Hz, 2H), 9.37 (d, J = 1.9 Hz, 2H), 9.26 (s, 1H), 9.11 (s, 1H), 8.29 (d, J = 5.8 Hz, 2H), 8.14 (dd, J = 5.2, 1.3 Hz, 2H), 7.99 (s, 2H), 7.95 – 7.90 (m, 3H), 7.88 (dd, J = 6.0, 1.9 Hz, 2H), 7.69 (dd, J = 6.1, 1.9 Hz, 2H), 7.40 (d, J = 3.8 Hz, 1H), 7.35 (d, J = 3.8 Hz, 1H), 7.31 (dd, J = 3.5, 1.1 Hz, 1H), 7.23 (d, J = 3.8 Hz, 1H), 7.09 (dd, J = 5.1, 3.6 Hz, 1H). 13C NMR (175 MHz, MeOD-d3, ppm): δ 163.28, 163.08, 162.89, 159.60, 159.43, 155.07, 154.53, 150.34, 141.88, 140.97, 140.81, 140.77, 140.60, 139.10, 137.67, 135.97, 131.57, 129.82, 129.20, 126.94, 126.39, 125.84, 125.75, 125.40, 125.33, 125.23, 124.45, 124.34, 123.11, 123.02, 122.89, 122.79, 119.88. HRMS (ESI+) m/z: [M2Cl−]2+ calcd for C49H26F12N8RuS3 576.0142; Found: 576.0141. [M2ClH]+ calcd for C49H25F12N8RuS3 1151.0211; Found: 1151.0232. HPLC retention time 23.80 min (99% purity by peak area).
[Ru(4,4′-dtfmb)2(IP-4T)]Cl2 (compound D) Ru(4,4′-dtfmb)2Cl2 (151 mg, 0.20 mmol) and IP-4T (90 mg, 0.167 mmol) were added to a microwave vessel containing argon-purged ethylene glycol (4 mL) and subjected to microwave irradiation at 180°C for 15 minutes. The resulting dark red mixture was then isolated and purified in the same manner as described for compound C, yielding the desired product D as a dark red solid (77 mg, 35%). 1H NMR (700 MHz, MeOD-d3, ppm): δ 9.40 (d, J = 2.0 Hz, 1H), 9.37 (d, J = 1.9 Hz, 1H), 9.18 (s, 1H), 8.29 (d, J = 5.9 Hz, 1H), 8.14 (dd, J = 5.2, 1.2 Hz, 1H), 7.99 (d, J = 6.1 Hz, 1H), 7.96 – 7.91 (m, 2H), 7.88 (dd, J = 5.9, 1.9 Hz, 1H), 7.69 (dd, J = 6.1, 1.9 Hz, 1H), 7.44 (d, J = 3.9 Hz, 1H), 7.39 – 7.35 (m, 1H), 7.29 – 7.22 (m, 2H), 7.18 (d, J = 3.7 Hz, 1H), 7.06 (dd, J = 5.1, 3.6 Hz, 1H). HRMS (ESI+) m/z: [M-2Cl]2+ calcd for C53H28F12N8RuS4 617.0080; Found: 617.0110. [M2ClH]+ calcd for 1233.0088. Found: 1233.0035. HPLC retention time 24.99 min (99% purity by peak area).
2.3. General chromatographic conditions
All experiments were performed on an Agilent HPLC series 1260 system (Agilent Technologies, Palo Alto, CA) consisting of a diode array detector, an autosampler and a quaternary pump. The mobile phases consisting of mixtures of ACN, MeOH and additives were prepared as volume ratios. All the mobile phases were stirred for 10 minutes and degassed by ultrasonication under vacuum before use. All separations were carried out at ambient temperature. The R-napthylethylcarbamate cyclofructan 6 (LARIHC CF6-RN) columns in this study were obtained, in three different lengths (250 mm x 4.6 mm, 150 mm x 4.6 mm and 50 mm x 4.6 mm), from AZYP, LLC (Arlington, TX, USA).
2.4. Analytical methods
All samples were prepared at 1 mg/mL in MeOH and 1 μL was injected for each run. The mobile phase conditions for five samples were optimized with different length of columns in addition to changing the ratio of the ACN/MeOH/additives. The Fig. 2 compounds A, B and E were separated on a 150 mm x 4.6 mm LARIHC CF6-RN column and compounds C and D were separated on a 250 mm x 4.6 mm LARIHC CF6-RN column. The separation condition for compounds A and B was 60/40/0.1/0.15, ACN/MeOH/TFA/TEA, 1.0 ml/min. λ = 420 nm. Separations of compounds C and D were obtained from 100/0.2/0.3, MeOH/FA/TEA, 0.7 ml/min. λ = 400 nm. The condition for sample E was 60/40/0.1/0.05, ACN/MeOH/TFA/TEA, 1.0 ml/min. λ = 280 nm.
The effect of mobile phase composition was investigated on a 50 mm x 4.6 mm LARIHC CF6-RN column with sample E which had the longest retention time of the five racemic analytes. To show the change in the chromatographic parameters related to the ratio of ACN/MeOH in the mobile phase, as well as the acid additives, were varied as will be discussed in Section 3. The effect of the ratio of TFA/TEA in the mobile phase was compared using compounds A and E, see: Results and discussion.
2.5. Preparative methods
All samples were prepared at 2 mg/mL in MeOH and 300-500 μL was injected for each run. Preparative purifications were done with a 250 mm x 10.0 mm LARIHC CF6-RN column for compounds A, B, C and D. For compound E, a 250 mm x 4.6 mm LARIHC CF6-RN column was used for the purification. The conditions for compounds A, B and E were 40/60/0.2/0.3, ACN/MeOH/FA/TEA, 2 mL/min. Compounds C and D were prepared using 100/0.2/0.3, MeOH/FA/TEA, 1.0 mL/min. In all cases, injections were stacked in order to increase throughput. Examples are shown in the Supplementary material, Fig. S9. The purified enantiomers for all compounds were > 99.8 % ee (enantiomeric excess) except for the first peak of compound C which had an ee of 99.1 %.
2.6. Absolute configuration determination by vibrational circular dichroism (VCD)
VCD Measurements:
1-2 mg of the PF6 salts were dissolved in 100 μL CD3CN and transferred to a BaF2 IR cell with path length of 100 μm. Instrumentation was a BioTools (Jupiter, FL) ChiralIR 2X DualPEM FT-VCD spectrometer, resolution 4 cm−1. The photoelastic modulator (PEM) maximum frequency is the setting for which the PEM yields maximum intensity, which was 1400 cm−1. IR and VCD spectra were collected simultaneously for 24 hours, then the IR spectra were solvent subtracted and the VCD spectra corrected using the half-difference method.
VCD Calculations:
The Ʌ isomer of each complex was constructed using the ComputeVOA software from BioTools. A conformational search was conducted using MM and only one conformer was found for each complex within a 5 kcal / mol range. We concluded therefore that only one conformer was dominating the solution and calculated this accordingly. Both the ion and the PF6 salt structures were minimized in Gaussian ‘09 using a split basis set of 6-31Gd (H, C, N, F, P, S) and ECP lanl2tz(f) for Ru or Os. The solvent shell CPCM method (acetonitrile) was used in each case. IR and VCD frequencies were calculated at the same level, then scaled and plotted with a line width of 6 cm−1 for comparison to the experimental data. High neighborhood similarity (Sfg) was calculated, using CompareVOA software from BioTools, for both IR and VCD of peak 2 in each case, leading to the conclusion that chromatographic peak 2 was the Ʌ isomer. The values were as follows: compound A: NS(IR) = 72.8, NS(VCD) = 57.5, compound B: NS(IR) = 76.7, NS(VCD) = 72.1, compound C: NS(IR) = 72.5, NS(VCD) = 56.4, compound D: NS(IR) = 71.2, NS(VCD) = 55.9 and compound E: NS(IR) = 70.0, NS(VCD) = 56.1. Both the ion and salt calculations yielded reasonable results with the ion slightly better for complexes A, B and E and the salt for complexes C and D.
3. Results and discussion
The separation of transition metal complex enantiomers by HPLC was reported early-on using a native B-cyclodextrin bonded chiral stationary phase (CSP) [26]. Over two decades later, racemic Ru(II) polypyridyl complexes were resolved on a derivatized cyclodextrin CSP [27], a macrocyclic glycopeptide CSP [28] and by capillary electrophoresis [29]. These few specific compounds had no medicinal value and also were easily crystallized so that determination of their absolute configuration was straight forward by using single crystal X-ray diffraction. Enantiomers of oligothiophene appended Ru(II) and Os(II) dyads that can be used in PDT (Fig. 2) have never been isolated, had their absolute configuration determined or been pharmacologically tested. Further, they are not easily crystallized.
3.1. Analytical separation of enantiomers
The LARIHC CF6-RN CSP has good enantioselectivity for most Ru(II) and Os(II) octahedral complexes with mobile phase mixtures of ACN and MeOH (see Fig. 3). They also separate under reversed phase conditions (data not shown) but since the ultimate goal was to obtain preparative separations, organic solvents were preferable and easier to remove. As seen in Fig. 3, the largest retention times occur either with a mobile phase of 100% MeOH or at high ACN concentrations. In all cases the peaks are relatively broad and show tailing.
Fig. 3.
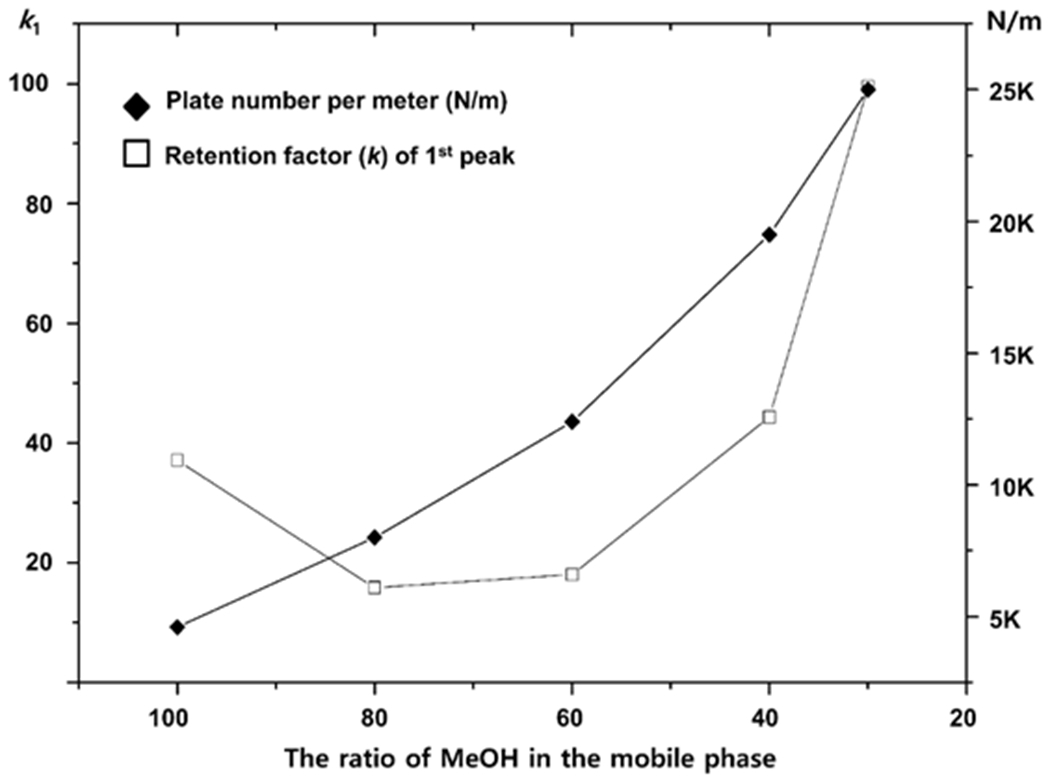
Plot indicating the effect of different mobile phase ACN/MeOH mixtures on retention factor and efficiency for the enantiomeric separation of Compound E on a 50 mm x 4.6 mm LARIHC CF6-RN column.
Fig. 4 shows the effect of MeOH-ACN ratios on retention, selectivity and efficiency. Clearly, intermediate ratios of ACN and MeOH produce the best compromise by providing short retention times with reasonable selectivity and efficiency values. Different mobile phase acid-base additives were examined to see if peak shapes and retention times could be further improved (Fig. 5). Trifluoroacetic acid (TFA) paired with triethylamine (TEA) greatly enhanced peak symmetry while decreasing retention. However, in the case of compounds C and D, which contain ligands with trifluoroacetyl moieties, the TFA mobile phase additive reduced retention to such an extent that baseline resolution was compromised. In these two cases, a longer column was used (see Materials and methods, section 2.4) and formic acid (FA) was the preferred acidic additive. This increased retention and produced a greater than baseline separation (see Figs. 5 & 6). The effect of different ratios of acid and base additives on the separation of compounds A and E are shown in the Supplementary material, Fig. S10. The optimized analytical separations for all five racemic transition metal PDT agents are shown in Fig. 6.
Fig. 4.
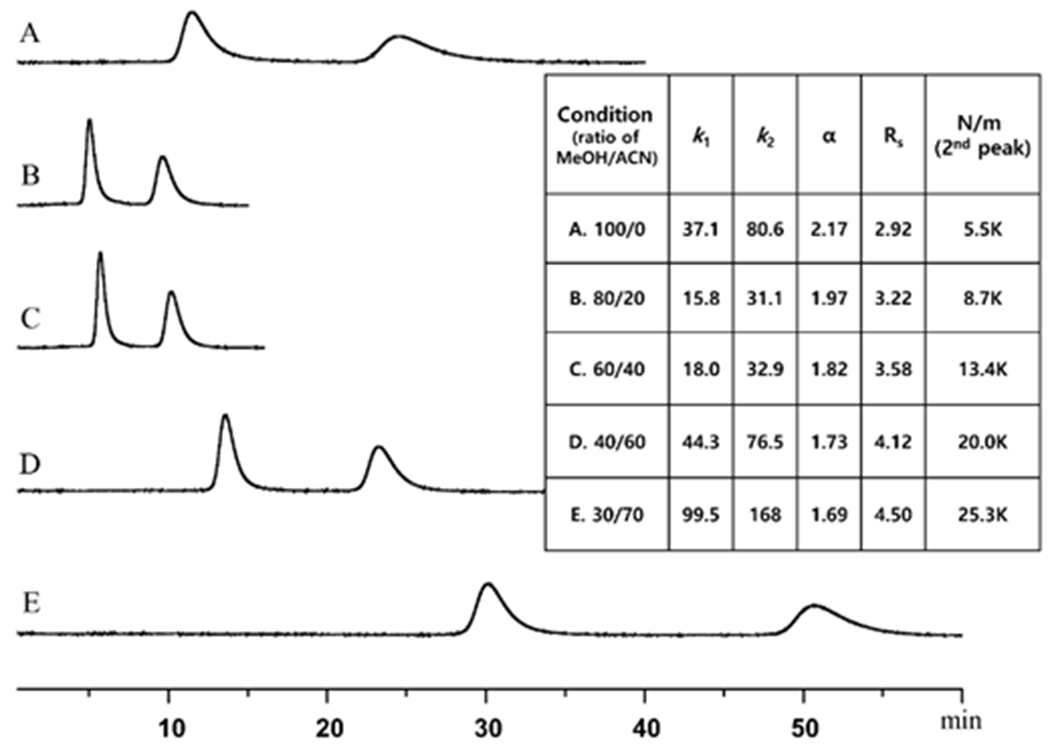
Effect of different mobile phase ACN/MeOH compositions on the separation and chromatographic figures of merit for osmium Compound E on a 50 mm x 4.6 mm LARIHC CF6-RN column. Conditions; A; 100, MeOH, B: 80/20, MeOH/ACN, C: 60/40, MeOH/ACN, D: 40/60, MeOH/ACN, E: 30/70, MeOH/ACN. The mobile phases contained 0.2/0/3 ratio of FA/TEA additive, flow rate = 2.0 ml/min., detection λ = 280 nm.
Fig. 5.
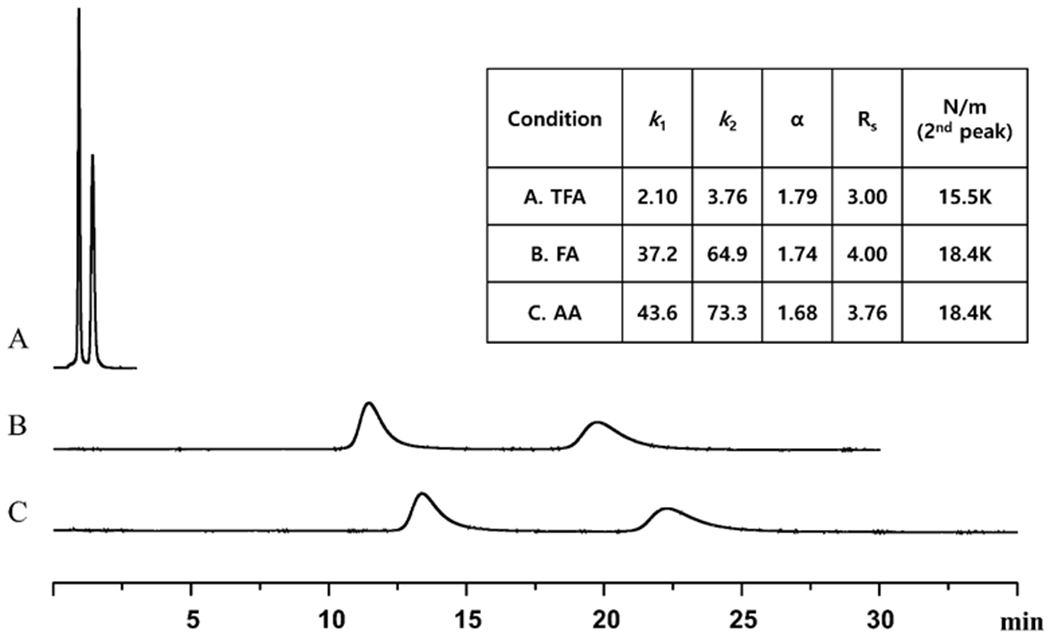
Effect of three different mobile phase acid additives on the separation of Compound E and the chromatographic figures of merit on a 50 mm x 4.6 mm LARIHC CF6-RN column. Conditions: 60/40/0.2/0.3, MeOH/ACN/acid additive/TEA, acid additive in the mobile phase condition A; trifluoroacetic acid, B; formic acid, C; acetic acid, flow rate = 2.0 ml/min., detection λ = 280 nm.
Fig. 6.
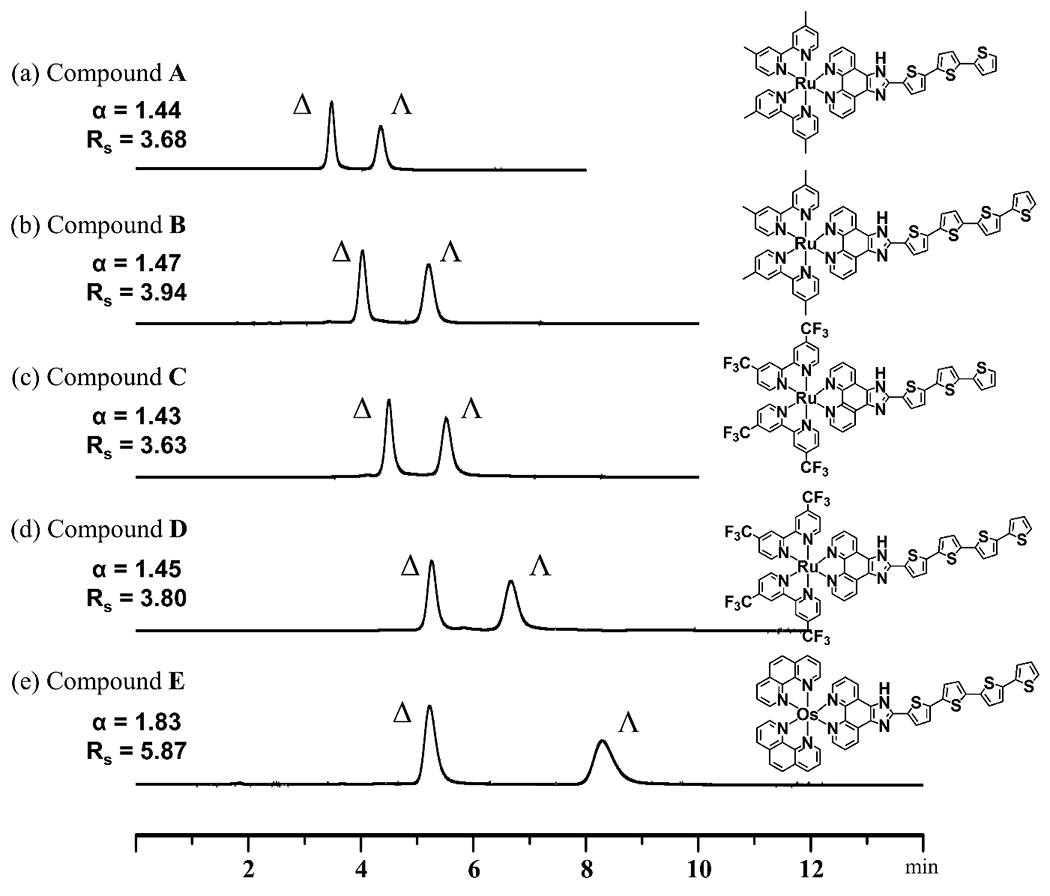
Optimized enantiomeric separations of five Ru and Os transition metal compounds on the LARIHC CF6-RN column. Conditions; A & B: 60/40/0.1/0.15, ACN/MeOH/TFA/TEA, flow rate = 1.0 ml/min, detection λ = 420 nm on a 150 mm x 4.6 mm LARIHC CF6-RN column. C & D: 100/0.2/0.3, MeOH/FA/TEA, flow rate = 0.7 ml/min, detection λ = 400 nm on a 250 mm x 4.6 mm LARIHC CF6-RN column. E: 60/40/0.1/0.05, ACN/MeOH/TFA/TEA, flow rate = 1.0 ml/min, detection λ = 280 nm on a 150 mm x 4.6 mm LARIHC CF6-RN column.
3.2. Absolute configurations by vibrational circular dichroism (VCD)
VCD has become an established and reliable technique for the determination of absolute configuration and for studies on molecular conformation [29–32]. It is a particularly powerful approach for enantiomers in the solution phase that are difficult to crystalize. Determining the absolute configurations of transition metal compounds A-E (Fig. 2) by VCD were attractive from a calculation standpoint as they were found to exist predominately in one conformation, simplifying the process. In general, a split basis approach was employed utilizing effective core potential basis sets for the metals and the more traditional 6-31G(d) for the rest of the atoms [32–35]. Two separate calculations were performed for each complex, one as a free (+2) ion and one as the PF6 salt which reflected the measurements. Both of these approaches yielded similar results indicating a definitive stereochemistry with the free ion a slightly better match for complexes A, B and E and the salt for complexes C and D.
The experimental and calculated VCD spectra for compound A and compound B were nearly identical. This was not a surprise, as the structures differed only by one thiophene group remote from the chiral core of the molecule. The most notable feature in the experimental was the positive VCD band at 1241 cm−1 which results from aromatic ring stretching/deformation of the bipyridyl ligands. The rest of the calculation tracks reasonably well with the experimental with some small offsets in frequency. Likewise, spectra for compound C and compound D were nearly identical to each other, as was expected. The notable VCD features were bands at 1412, 1343, 1325 and 1183 cm−1. These vibrations are mostly from aromatic ligand stretching and deformation, with the 1343 and 1325 cm−1 bands including contribution from C-F stretching. All of these bands correlate to the calculated quite well making the assignment unambiguous. The VCD spectra for compound E was not dominated by any particular features, but appeared more balanced with respect to intensities. There were several groups of bands which could be easily correlated to the calculation by pattern. The regions 1615 – 1475, 1460 – 1315 and 1310 – 1150 cm−1 all had corresponding bands appearing in the DFT spectra. The vibrations responsible for these peaks were mostly coming from aromatic ring deformation, C-C and C-H stretching of the ligands and some contributions from the thiophene tail.
The VCD spectrum of compound E peak 2 (Fig. 6) matches the calculated spectrum for the lambda (Ʌ) enantiomer (see Fig. 7). Fig. 8 shows two views of the optimized structure and absolute configuration of the Ʌ-enantiomer of the PF6− salt of compound E. The Os (II), in pink, is easily seen in the “tilted” bottom view. Likewise, The VCD spectra of peak 2 and the calculated spectra for the Ʌ enantiomers for compounds A-D are provided in the Supplementary material (Fig. S11–S14). Overlays of the VCD spectra and IR spectra of compounds A-D are provided in the Supplementary material, Figs. S15–S19. The same elution order was found for all five photosensitizers investigated in this study (i.e., compounds A, B, C, D and E in Fig. 6). Hence it appears that the chromatographic retention order of analogous transition metal compounds on the LARIHC CF6-RN CSP and under similar separation conditions could provide circumstantial evidence as to absolute configuration.
Fig. 7.
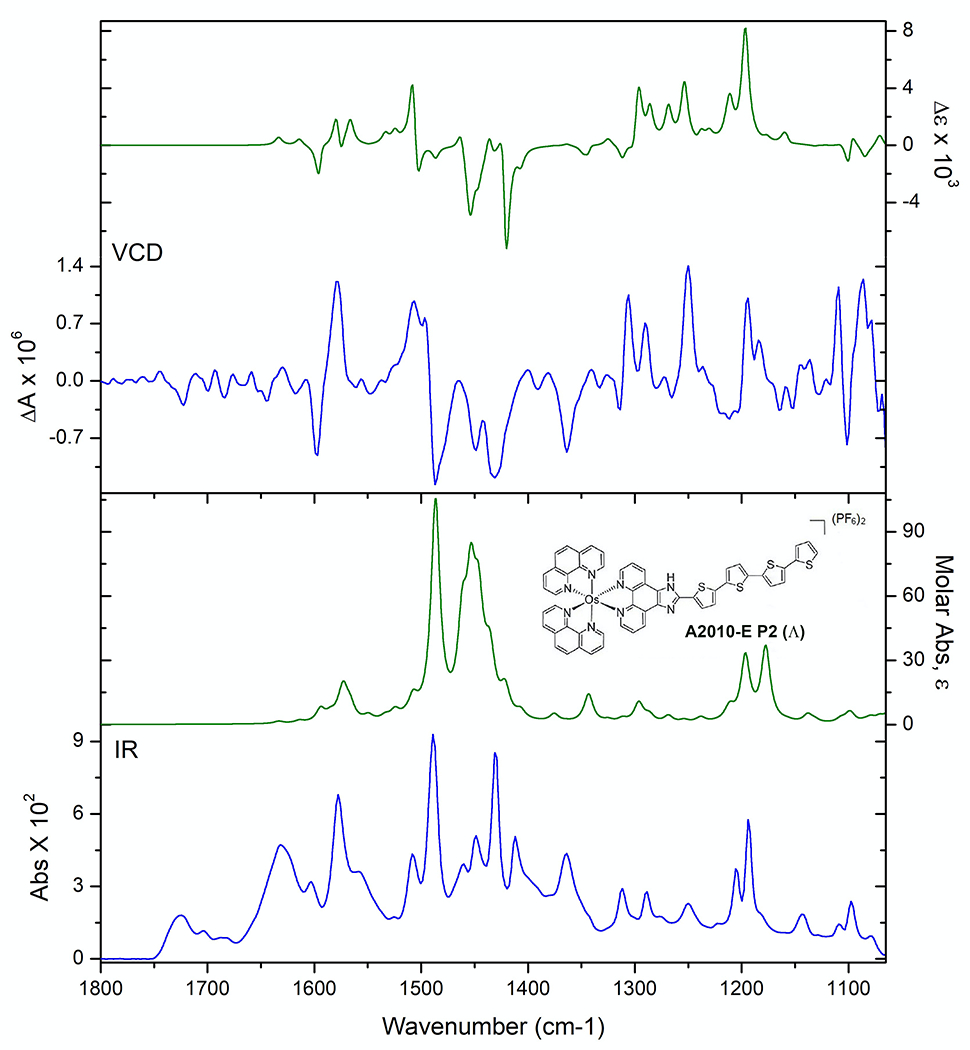
Comparison of experimental (blue lines) and theoretical DFT (green lines) IR (lower frame) VCD (upper frame) spectra for compound E. Peak 2 (left axis) compared with the spectrum of the (Ʌ) configuration (right axis).
Fig. 8.
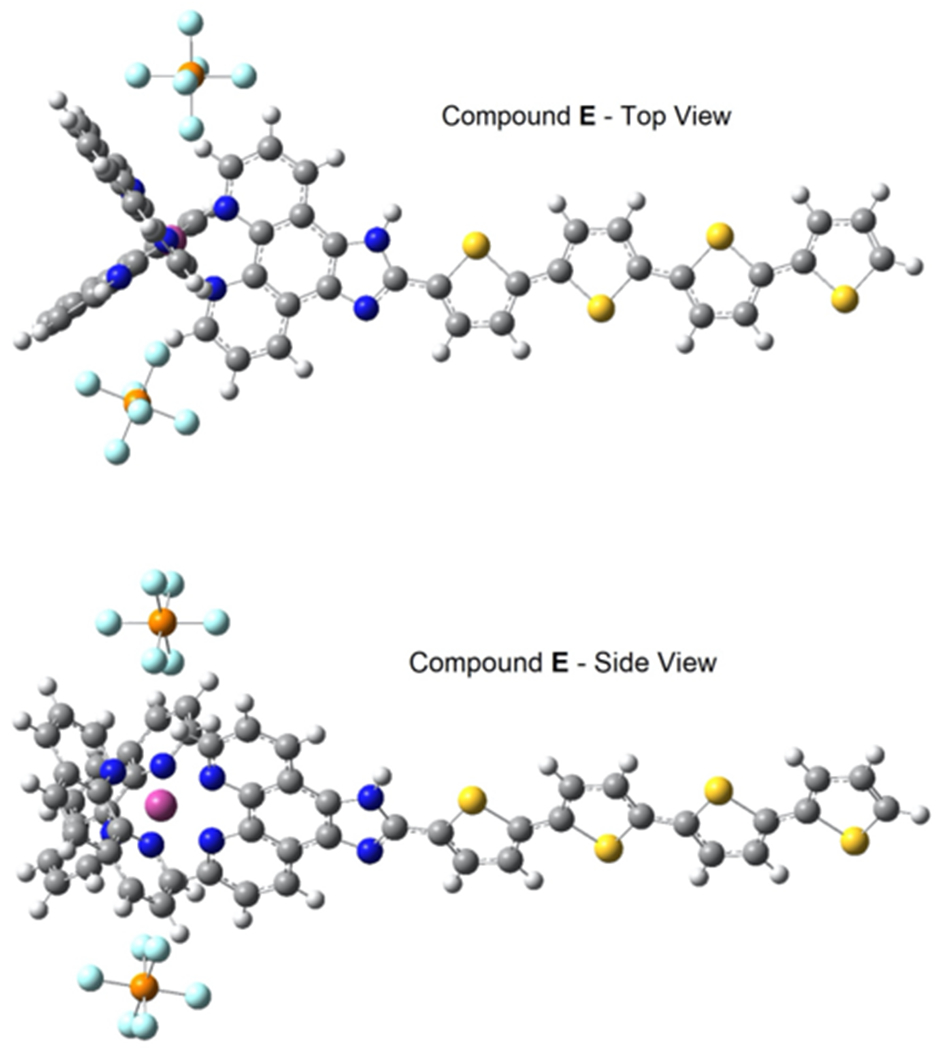
Two views of the optimized structure of the PF6 salt of Compound E, showing the Ʌ configuration of the second eluting peak. The same retention order was found for all five compounds (A, B, C, D and E) in this study. Color coding of atoms: C = dark grey, N = blue, S = yellow, P = orange, F = light blue, Os = pink.
Conclusions
A racemic Ru(II) metal organic dyad, that incorporates a function-determining oligothiophene chain, currently under investigation as a PDT antitumor agent, and four additional racemic Ru (II) and Os (II) compounds were enantiomerically resolved. Both analytical and preparative chromatographic separations of all five racemates were developed using a derivatized cyclofructan chiral stationary phase. The absolute configuration of the eluted compounds was determined using vibrational circular dichroism. In all cases, the first eluted peak was the Δ enantiomer and the second eluted peak was the Ʌ enantiomer. Pharmacological studies on the pure enantiomers can now be done for the first time.
Supplementary Material
Acknowledgments
This work was supported by the Robert A. Welch Foundation for DWA (Y-0026) and the National Institutes of Health for SAM (Award Number R01CA222227). The content is solely the responsibility of the authors and does not necessarily represent the official views of the National Institutes of Health. We thank Jim Cheeseman (Gaussian, Wallingford, CT) for assistance in setting up calculations.
Footnotes
Conflict of interest
The authors declare the following competing financial interest(s): S.A.M. has a potential research conflict of interest due to a financial interest with Theralase Technologies, Inc. and PhotoDynamic, Inc. A management plan has been created to preserve objectivity in research in accordance with UTA policy.
Appendix A. Supplementary material
Supplementary material related to this can be found attached.
References
- [1].Frezza M, Hindo S, Chen D, Davenport A, Schmitt S, Dajena D, Ping Dou Q, Novel metals and metal complexes as platforms for cancer therapy, Curr. Pharm. Des., 16 (2010) 1813–1825, 10.2174/138161210791209009. [DOI] [PMC free article] [PubMed] [Google Scholar]
- [2].Rosenberg B, VanCamp L, Trosko JE, Mansour VH, Platinum compounds: a new class of potent antitumour agents, Nature, 222 (1969) 385–386, 10.1038/222385a0. [DOI] [PubMed] [Google Scholar]
- [3].Ndagi U, Mhlongo N, E Soliman M, Metal complexes in cancer therapy – an update from drug design perspective, Drug Des. Devel. Therap., 11 (2017) 599–616, 10.2147/DDDT.S119488 [DOI] [PMC free article] [PubMed] [Google Scholar]
- [4].Monro S, Colón KL, Yin H, Roque J, Konda P, Gujar S, Thummel RP, Lilge L, Cameron CG, McFarland SA, Transition metal complexes and photodynamic therapy from a tumor-centered approach: challenges, opportunities, and highlights from the development of TLD1433, Chem. Rev. 119 (2019) 797–828, 10.1021/acs.chemrev.8b00211 [DOI] [PMC free article] [PubMed] [Google Scholar]
- [5].Gollnick SO, Vaughan L, Henderson BW, Generation of effective antitumor vaccines using photodynamic therapy, Cancer Res. 62 (2002) 1604–1608, https://cancerres.aacrjournals.org/content/62/6/1604 [PubMed] [Google Scholar]
- [6].Shams M, Owczarczak B, Manderscheid-Kern P, Bellnier DA, Gollnick SO, Development of photodynamic therapy regimens that control primary tumor growth and inhibit secondary disease, Cancer Immunol. Immunother. 64 (2015) 287–297. 10.1007/s00262-014-1633-9 [DOI] [PMC free article] [PubMed] [Google Scholar]
- [7].Yildiz D, Ercal N, Armstrong DW, Nicotine enantiomers and oxidative stress, Toxicology, 130 (1998) 155–165. 10.1016/S0300-483X(98)00105-X [DOI] [PubMed] [Google Scholar]
- [8].Dougherty TJ, The roswell park history of PDT: 1972 to the present: a personal perspective, in Biel MA, [ Ed.] Photodynamic therapy of diseases of the head and neck; Plural Publishing Inc, 1st Ed. (San Diego, CA: ) (2008) p.1–18. [Google Scholar]
- [9].Levy J, Levy E, Photofrin-PDT from bench to bedside: some lessons learned. In Pandey RK, Kessel D, Dougherty TJ, [Eds.] Handbook of photodynamic therapy: updates on recent applications of porphyrin-based compounds; World Scientific, 1st Ed. (Hackensack, NJ: ) (2016) 531–548. [Google Scholar]
- [10].Muz B, de la Puente P, Azab F, Azab AK, The role of hypoxia in cancer progression, angiogenesis, metastasis, and resistance to therapy, Hypoxia (Auckl) 3 (2015) 83–92. 10.2147/HP.S93413. [DOI] [PMC free article] [PubMed] [Google Scholar]
- [11].Lameijer LN, Ernst D, Hopkins SL, Meijer MS, Askes SHC, Le Dévédec SE, Bonnet S, A red-light-activated ruthenium-caged NAMPT inhibitor remains phototoxic in hypoxic cancer cells, Angew. Chem. Int. 56 (2017) 11549–11553. 10.1002/anie.201703890. [DOI] [PMC free article] [PubMed] [Google Scholar]
- [12].Bevernaegie R, Doix B, Bastien E, Diman A, Decottignies A, Feron O, Elias B, Exploring the phototoxicity of hypoxic active iridium(III)-based sensitizers in 3D tumor spheroids, J. Am. Chem. Soc. 141 (2019) 18486–18491. 10.1021/jacs.9b07723. [DOI] [PubMed] [Google Scholar]
- [13].Roque III J, Havrylyuk D, Barrett DPC, Sainuddin T, McCain J, Colón K, Sparks WT, Bradner E, Monro S, Heidary D, Cameron CG, Glazer EC, McFarland SA, Strained, photoejecting Ru(II) complexes that are cytotoxic under hypoxic conditions, Photochem. Photobiol. 96 (2020) 327–339. 10.1111/php.13174. [DOI] [PMC free article] [PubMed] [Google Scholar]
- [14].Roque JA III, Barrett PC, Cole HD, Lifshits LM, Shi G, Monro S, von Dohlen D, Kim S,; Russo N, Deep G, Cameron CG, Alberto ME, McFarland SA, Breaking the barrier: an osmium photosensitizer with unprecedented hypoxic phototoxicity for real world photodynamic therapy, Chem. Sci. 11 (2020) 9784–9806, 10.1039/D0SC03008B [DOI] [PMC free article] [PubMed] [Google Scholar]
- [15].Roque JA, Barrett PC, Cole HD, Lifshits LM, Bradner E, Shi G, .von Dohlen D, Kim S, Russo N, Deep G, Cameron CG, Alberto ME, McFarland SA, Os(II) oligothienyl complexes as a hypoxia-active photosensitizer class for photodynamic therapy, Inorg. Chem. 59 (22) (2020) 16341–16360. 10.1021/acs.inorgchem.0c02137. [DOI] [PMC free article] [PubMed] [Google Scholar]
- [16].Shi G, Monro S, Hennigar R, Colpitts J, Fong J, Kasimova K, Yin H, DeCoste R, Spencer C, Chamberlain L, Mandel A, Lilge L, McFarland SA, Ru(II) dyads derived from α-oligothiophenes: a new class of potent and versatile photosensitizers for PDT, Coord. Chem. Rev. (2015) 282–283, 127–138. 10.1016/j.ccr.2014.04.012. [DOI] [Google Scholar]
- [17].McFarland SA, Mandel A, Dumoulin-White R, Gasser G, Metal-based photosensitizers for photodynamic therapy: the future of multimodal oncology? Curr. Opin.Chem. Biol. 56 (2020) 23–27. 10.1016/j.cbpa.2019.10.004. [DOI] [PMC free article] [PubMed] [Google Scholar]
- [18].Development of new stereoisomeric drugs, FDA Guidance Document (1992) https://www.fda.gov/regulatory-information/search-fda-guidance-documents/development-new-stereoisomeric-drugs.
- [19].Armstrong DW, Ward TJ, Armstrong RD, Beesley TE, Separation of drug stereoisomers by the formation of β-cyclodextrin inclusion complexes, Science, 232 (1986) 1132–1135. 10.1126/science.3704640 [DOI] [PubMed] [Google Scholar]
- [20].Karlsson C, Karlsson L, Armstrong DW, Owens PK, Evaluation of vancomycin chiral stationary phase in capillary electrochromatography using polar organic and reversed phase modes, Anal. Chem. 72 (2000) 4394–4401. 10.1021/ac0002792 [DOI] [PubMed] [Google Scholar]
- [21].Sun P, Armstrong DW, Effective enantiomeric separations of racemic primary amines by the isopropyl carbamate-cyclofructan 6 chiral stationary phase, J. Chromatogr. A, 1217 (2010) 4904–4918. 10.1016/j.chroma.2010.04.079 [DOI] [PubMed] [Google Scholar]
- [22].Hellinghausen G, Roy D, Lee JT, Wang Y, Weatherly CA, Lopez D, Nguyen K, Armstrong JD, Armstrong DW. Effective methodologies for enantiomeric separation of 150 pharmacology and toxicology related 1°, 2°, and 3° amines with core-shell chiral stationary phases, J. Pharm. Biomed. Anal, 155 (2018) 70–81. 10.1016/j.jpba.2018.03.032 [DOI] [PubMed] [Google Scholar]
- [23].Sainuddin T, Pinto M, Yin H, Hetu M, Colpitts J, McFarland JSA, Strained ruthenium metal–organic dyads as photocisplatin agents with dual action, J. Inorg. Biochem. 158 (2016) 45–54. 10.1016/j.jinorgbio.2016.01.009. [DOI] [PubMed] [Google Scholar]
- [24].Wang Z, Radziszewski Reaction. In Wang Z Comprehensive Organic Name Reactions and Reagents, Wiley-Interscience, 1st Ed. Vol 3. (2010) Pt 3, 518. [Google Scholar]
- [25].Pazderski L, Pawlak T, Sitkowski J, Kozerski L, Szłyk E, 1 H NMR assignment corrections and 1 H, 13 C, 15 N NMR coordination shifts structural correlations in Fe(II), Ru(II) and Os(II) cationic complexes with 2,2′-Bipyridine and 1,10-Phenanthroline, Magn. Reson. Chem. 48 (6) (2010) 450–457. 10.1002/mrc.2600. [DOI] [PubMed] [Google Scholar]
- [26].Armstrong DW, DeMond W, Czech BP, Separation of metallocene enantiomers by liquid chromatography: chiral recognition via cyclodextrin bonded phases, Anal. Chem, 57, (1985) 481–484. 10.1021/ac50001a037 [DOI] [Google Scholar]
- [27].Sun P, Krishnam A, Yadav A, Singh S, MacDonnell FM, Armstrong DW, Enantiomeric separations of ruthenium (II) polypyridyl complexes using high-performance liquid chromatography (HPLC) with cyclodextrin chiral stationary phases (CSPs), Inorg. Chem. 46 (2017) 10312–10320. 10.1021/ic701023x [DOI] [PubMed] [Google Scholar]
- [28].Sun P, Krishnan A, MacDonnell FM, Armstrong DW, Enantioseparations of chiral ruthenium (II) polypyridyl complexes using HPLC with macrocyclic glycopeptide chiral stationary phases (CSPs), J. Molecular Structure, 890 (1-3) (2008) 75–80. 10.1016/j.molstruc.2008.02.030 [DOI] [PMC free article] [PubMed] [Google Scholar]
- [29].Polavarapu PL and Santoro E, Vibrational optical activity for structural characterization of natural products, Nat. Prod. Rep, 37 (2020) 1661–1699. 10.1039/D0NP00025F [DOI] [PubMed] [Google Scholar]
- [30].Batista JM Jr., E.W. Blanch, V.S. Bolzani, Recent advances in the use of vibrational chiroptical spectroscopic methods for stereochemical characterization of natural products, Nat. Prod. Rep. 32 (2015) 1280–1302. 10.1039/C5NP00027K [DOI] [PubMed] [Google Scholar]
- [31].Merten C, Golub TP, Kreienborg NM, Absolute configurations of synthetic molecular scaffolds from vibrational CD spectroscopy, J. Org. Chem. 84 (14) (2019) 8797–8814. 10.1021/acs.joc.9b00466 [DOI] [PubMed] [Google Scholar]
- [32].Bour P, Krupova M, Kessler J, Recent trends in chiroptical spectroscopy: theory and applications of vibrational circular dichroism and Raman optical activity, ChemPlusChem 85 (3) (2020) 561–575. 10.1002/cplu.202000014 [DOI] [PubMed] [Google Scholar]
- [33].Freedman TB, Cao X, Young DA, A D.; Nafie LA, Density functional theory calculations of vibrational circular dichroism in transition metal complexes, J. Phys. Chem. 106 (2002) 3560–3565. 10.1021/jp015519b [DOI] [Google Scholar]
- [34].Lassen PR, Guy L, Karame I, Roisnel T, Vanthuyne N, Roussel C, Cao X, Lombardi R, Crassous J, Freedman TB, Nafie LA, Synthesis and vibrational circular dichroism of enantiopure chiral oxorhenium (V) complexes containing the hydrotris(1-pyrazolyl)borate ligand, Inorg. Chem. 45 (2006) 10230–10239. 10.1021/ic061418m [DOI] [PubMed] [Google Scholar]
- [35].Chamayou A, Ludeke S, Brecht V, Freedman TB, Nafie LA, Janiak C, Chirality and diastereoselection of D/L-configured tetrahedral zinc complexes through enantiopure schiff base complexes: combined vibrational circular dichroism, density functional theory, 1H NMR, and x-ray structural studies, Inorg. Chem. 50 (2011) 11363–11374. 10.1021/ic2009557 [DOI] [PubMed] [Google Scholar]
Associated Data
This section collects any data citations, data availability statements, or supplementary materials included in this article.


