

Abstract
Background:
The kidney is essential for glucose and insulin metabolism. Living kidney donors (LKDs) experience a reduction in glomerular filtration rate (delta-GFR) of 25–30 ml/min following donor nephrectomy. Little is known about the effect of GFR decline on insulin sensitivity in LKDs.
Methods:
We conducted a prospective pilot study on nine LKDs (N=9) who underwent dynamic metabolic testing (mixed meal tolerance test [MMTT]) to measure proxies of insulin sensitivity (homeostatic model assessment of insulin resistance [HOMA-IR], the area under curve [AUC] for insulin/glucose ratio, and Matsuda insulin sensitivity index (Matsuda-ISI) before and three months after donor nephrectomy. The primary outcome was the change in insulin sensitivity indices (delta [post-nephrectomy - pre-nephrectomy]).
Results:
Four of the donors had a body mass index (BMI) between 32.0 and 36.7 pre-donation. Post-donor nephrectomy, compared to pre-nephrectomy values, median insulin AUC increased from 60.7 to 101.7 hr*mU/mL (delta median 33.3, p-value=0.04) without significant change in median glucose AUC levels from 228.9 to 209.3 hr*mg/dl (delta median 3.2, p-value=0.77). There was an increase in the median HOMA-IR from 2 to 2.9 (delta median 0.8, p-value=0.03) and the AUC insulin/glucose ratio from 30.9 to 62.1 pmol/mmol (delta median 17.5, p-value=0.001) while the median Matsuda-ISI decreased from 5.9 to 2.9 (delta median −2, p-value=0.05). The changes were more pronounced in obese (BMI>32) donors.
Conclusions:
LKDs appear to have a trend toward a decline in insulin sensitivity post-donor nephrectomy in the short-term, especially in obese donors (BMI>32). Further investigation with a larger sample size and longer follow-up is needed.
Keywords: Insulin sensitivity, Mixed meal tolerance testing, Donor nephrectomy, Glucose metabolism, Living kidney donor, Kidney transplantation
Introduction:
Living donor kidney transplantation is considered the best treatment option for dialysis-free survival in patients with end-stage renal disease (ESRD). In 2018, 6,168 renal transplantations were performed from living kidney donors in the United States, 33% of whom were overweight (body mass index [BMI] 25–30) along with 25% of whom were obese (BMI>30).1 Kidney donors are at increased risk for hypertension, proteinuria, chronic kidney disease, diabetes, ESRD, cardiovascular death compared to healthy non-donors.2–4
Little is known on metabolic state and insulin sensitivity in living kidney donors following donor nephrectomy.5 Donor nephrectomy generally leads to an overall reduction in glomerular filtration rate (GFR) of 25–35 ml/min/m2 following a compensatory hyper-filtration that is observed in the solitary remaining kidney. Insulin sensitivity, defined as the amount of glucose metabolized per unit of insulin administered, when measured using the gold standard euglycemic clamp technique, positively correlates with GFR.6 Hence, with a drop in GFR post-donation, living donors may remain at risk for insulin resistance. Insulin resistance is a strong predictor of diabetes and is of great concern with rising obesity and metabolic syndrome among living kidney donors. Serrano et al. reported that, in long-term follow-up (>10 years), new-onset diabetes is two times more likely to occur in obese living donors (the incidence rate 12%) compared to non-obese living donors (the incidence rate 6%).7 Center for Disease Control (CDC) estimates that approximately 10% of the U.S. population aged 18 years or older have diabetes in 2015, while the diabetes prevalence exceeds 25% in adults older than 65 years old.8
Since the kidney is the major extrahepatic site of insulin clearance and gluconeogenesis, it remains very prudent to study insulin sensitivity following post-nephrectomy GFR loss. The purpose of our pilot study is to evaluate the effect of nephrectomy related GFR decline on glucose metabolism and insulin sensitivity among living kidney donors.
Materials and Methods:
Study Cohort:
Approval from the Institutional Review Board at the Columbia University Medical Center (CUMC), New York, was obtained before the study. The clinical and research activities being reported are consistent with the Principles of the Declaration of Istanbul as outlined in the “Declaration of Istanbul on Organ Trafficking and Transplant Tourism”. This was a prospective observational cohort (pilot) study conducted over three months without randomization or blinding.
The study participants were selected from among living donors at CUMC. We screened 120 potential living kidney donors, of which nine participants completed pre and post (three-month post-nephrectomy) testing and were included in the final study cohort. Each patient served as his/her control (the baseline values were compared to 3 months’ post nephrectomy results). The study cohort (N=9) underwent both CUMC specific living donor work-up, and the study protocol blood testing separately. The results of the study protocol blood testing were not available at the time of donation, and the decision regarding approval for kidney donation was individually made based on the center-specific selection criteria and routine testing.
Assessment of Glucose Metabolism and Insulin Sensitivity:
Pancreatic beta cells secrete basal (unstimulated) insulin in a pulsatile manner every 9 to 14 minutes. A rapid increase in glucose (following a glucose load or meal) is taken up by beta cells via glucose transporters (GLUT2) that primarily regulate early (phase 1) and sustained insulin secretion (phase 2).9 The kidney and liver are central to the metabolism of insulin in healthy subjects that the liver clears 40 % of insulin produced by the pancreas into the portal circulation by first-pass metabolism. A healthy kidney degrades another 20 to 30% (approximately 6 to 8 units/day) of the remainder insulin.
In our study, we assessed beta-cell function and insulin sensitivity using sequential static measurements (fasting glucose, insulin, and c-peptide levels), dynamic metabolic testing (mixed meal tolerance test [MMTT]), adipokines levels (adiponectin and leptin), surrogates markers for adiposity (BMI and visceral fat / subcutaneous and visceral fat surface area ratio measured by single CT axial image at lumbar three vertebra level, performed at the pre-nephrectomy phase only), proxies of insulin sensitivity (homeostatic metabolic assessment of insulin resistance [HOMA-IR], Matsuda insulin sensitivity index [ISI], and area under curve [AUC] insulin/glucose ratios, all derived from MMTT values), and metabolic phenotype (International Diabetes Federation Metabolic Syndrome criteria [fulfilling following criteria: central obesity and 2 out of 4 factors, and family history of diabetes) before and three months after donor nephrectomy.10
Mixed Meal Tolerance Test (MMTT):
The MMTT is one of the gold standard tests to measure beta-cell function and relies on measuring insulin production and glucose clearance sequentially after administering a mixed meal formula.11 It is performed in the morning, after an overnight fast as per the Trial Net Protocol.12 Briefly, the MMTT uses a standard oral mixed meal formula (Boost, Nestle Health Science) of liquid sucrose, soy protein, casein, and soy oil. A bottle (volume 360 ml) contains a total of 360 calories, 6 grams of fat, 15 grams of protein, and 62 grams of carbohydrates. The test meal is given to the donors at a dose of 6 ml/kg body weight, a maximum of 360 ml to be consumed within 5 minutes. The test is conducted for over 2 hours. Baseline samples for glucose, c-peptide, and insulin levels are drawn 10 minutes before consumption of Boost, and serial blood draws (baseline, 10, 15, 20, 30, 60, 90, and 120 min) for 2 hours post-consumption of Boost to measure the area under the curve (AUC) values. The first phase of insulin response during the MMTT is the preferred measure of beta-cell function, which has been validated for subjects without diabetes.13
Insulin sensitivity Indices:
Homeostatic model assessment of insulin resistance (HOMA-IR), used as the measure of insulin resistance at the level of liver, was calculated and derived from fasting samples.14,15 In the absence of a consensus on the exact cut-off level for HOMA-IR to define insulin resistance, HOMA-IR values above 2.1 and 2.7 were used as the generally accepted thresholds for insulin-resistant states in White and Mexican-American populations, respectively. HOMA-IR demonstrates the dynamic between fasting glucose and insulin level and does not assess compensated beta-cell failure, which becomes apparent following a meal stimulus.14,16,17
Dynamic insulin sensitivity indices (Matsuda insulin sensitivity index [Matsuda-ISI] and AUC insulin/glucose ratios) were calculated from glucose and insulin concentrations taken during MMTT (based on 0, 30, 60, 90, 120 minutes glucose and insulin concentrations). The dynamic assessment requires exogenous glucose load from Boost resulting in hyperglycemia (in the first 60 minutes), insulin secretion, and glucose uptake/disappearance (glucose levels back down to preload levels in 2–3 hours). The Matsuda-ISI, validated against euglycemic clamp studies, measures peripheral insulin resistance (skeletal and adipose), with levels below 2.5 suggestive of insulin resistance).18–20
Main outcomes:
The primary outcome was the change in insulin sensitivity indices (delta, [post-nephrectomy - pre-nephrectomy]).
Statistical Analysis:
Donor characteristics were described as median (min, max) or mean and standard deviation for continuous variables and percent total for categorical variables. Comparisons between pre- and post-testing were made using the Wilcoxon signed-rank test (non-parametric statistical testing comparing two repeated measurements). A p-value <0.05 was considered statistically significant. Statistical analyses were performed with Stata/MP14 (StataCorp LP, College Station, TX). We used the trapezoidal rule to calculate areas under glucose and insulin concentration curves (AUC).
Results:
Pre-donation Characteristics of the Study Cohort:
The study cohort was composed of 5 females and four males (N=9). Their median (min, max) ages were 48 (23, 65). The race distribution was four Whites, four Hispanics, and one African American. All, except one, donated to their first-degree relatives. Two patients had a first-degree family member with diabetes mellitus. None of the donors met metabolic syndrome criteria (defined by the International Diabetes Foundation).10 Four of the donors had a body mass index (BMI) between 32.0 and 36.7 pre-donation.
Changes Between Pre- and Post-Nephrectomy Phases in the Study Cohort:
Compared to the pre-nephrectomy phase, the changes in clinical and metabolic parameters in the post-nephrectomy phase in the study cohort (N=9) are shown in Table 1. The median eGFR decreased from 108 to 76 ml/min/1.73 m2 (delta median −38.5, p-value =0.001). There was a significant increase in the median fasting insulin, c-peptide, and diastolic blood pressures. The median insulin AUC significantly rose from 60.7 to 101.7 hr*mU/mL (delta median 33.3, p-value =0.04) without a change in median glucose AUC levels from 228.9 to 209.3 hr*mg/dl (delta median 3.2, p-value=0.77), (Figure 1 and 2). It seems that the first phase of insulin response (first 60 minutes post Boost bolus) predominantly amplified in the post-nephrectomy phase compared to the pre-nephrectomy state (Figure 2). In terms of the insulin sensitivity indices, there was an increase in the median HOMA-IR from 2 to 2.9 (delta median 0.8, p-value =0.03) and the AUC insulin/glucose ratio from 30.9 to 62.1 pmol/mmol (delta median 17.5, p-value =0.001) while the median Matsuda-ISI decreased from 5.9 to 2.9 (delta median −2, p-value =0.05). Body fat distribution (subcutaneous and visceral fat surface area) widely varied among subjects.
Table 1.
Changes in clinical and metabolic parameters pre- and post-nephrectomy in the study cohort (N=9).
| Variable | Pre-nephrectomy, Median (Min, Max) | Post-nephrectomy Median (Min, Max) | Delta (Post-Pre), Median (Min, Max) | P value * |
|---|---|---|---|---|
| Weight (kg) | 85.8 (53.9, 110.5) | 87 (53.2, 116.8) | 0 (−2.3, 6.35) | 0.48 |
| BMI (kg/m2) | 29 (21.5, 36.7) | 30.5 (21.2, 38.1) | 0.04 (−2.70, 2.08) | 0.48 |
| Subcutaneous fat area (cm2), median (min, max)¶ | 234.2 (44.4, 358.6) | Not measured | ||
| Visceral fat area (cm2), median (min, max)¶ | 105.9 (24.4, 191.8) | Not measured | ||
| Visceral fat /Total fat area ratio (min, max)¶ | 0.31 (0.14, 0.41) | Not measured | ||
| SBP (mmHg) | 112 (100, 128) | 115 (109, 120) | 3 (−8, 8) | 0.59 |
| DBP (mmHg) | 62 (60, 80) | 72 (66, 81) | 6 (2, 12) | 0.04 |
| HbA1C (%) | 5.4 (4.7, 6) | 5.4 (4.6, 5.9) | 0 (−0.2, 0.3) | 0.72 |
| Fasting glucose (mg/dL) | 95 (75, 105) | 93 (74, 105) | −3 (−6, 13) | 0.51 |
| Fasting insulin (mU/mL) | 8.4 (5, 19.7) | 11.4 (6.4, 25) | 3.4 (−1.4, 15.3) | 0.02 |
| Fasting c-peptide (ng/mL) | 2 (1.3, 3.1) | 2.7 (1.8, 4.9) | 0.6 (0.1, 1.2) | 0.01 |
| Glucose 2hr (mg/dL) | 119 (72, 135) | 92 (82, 117) | −21 (−43, 19) | 0.05 |
| Glucose AUC (hr*mg/dL) | 228.9 (152.4, 247.5) | 209.3 (178.8, 262.8) | 3.2 (−49.1, 139) | 0.77 |
| Insulin AUC (hr*mU/mL) | 60.7 (34.8, 134.8) | 101.7 (23.8, 189) | 33.3 (−16, 107.7) | 0.04 |
| C-peptide AUC (hr*ng/mL) | 9.3 (5.8, 13.6) | 14.5 (10.3, 19.3) | 5.2 (1.5, 9.9) | 0.02 |
| TG (mg/dL) | 102 (36,190) | 115 (43, 231) | 21 (−54, 49) | 0.17 |
| HDL-C (mg/dL) | 51 (42, 72) | 48 (43,84) | −2 (−12, 12) | 0.64 |
| TG/HDL-C | 1.73 (0.50, 3.57) | 2.55 (0.51, 5.37) | 0.65 (−1.0, 1.8) | 0.21 |
| eGFR (mL/min/1.73 m2) | 108 (77.6, 120) | 76.5 (58, 94) | −38.5 (−47.9, −28) | 0.01 |
| Adipokines | ||||
| Adiponectin (ng/mL) | 8800 (6100, 16250) | 8150 (5400, 18400) | 700 (−1400, 4450) | 0.68 |
| Leptin (ng/mL) | 19.5 (6.2, 64.7) | 28.2 (5.4, 86.7) | 8.6 (−16.7, 26.8) | 0.17 |
| Insulin sensitivity surrogate index from fasting sample | ||||
| HOMA-IR** | 2.0 (0.96, 4.9) | 2.9 (1.2, 5.9) | 0.8 (−0.3, 3.9) | 0.03 |
| Insulin sensitivity surrogate indices derived from MMTT | ||||
| AUC insulin/glucose (pmol/mmol) | 30.9 (20.6, 75.6) | 62.1 (15.4, 119.3) | 17.5 (−5.1, 61.5) | 0.01 |
| Matsuda ISI*** | 5.9 (2.5, 13.6) | 3.9 (2.0, 11) | −2 (−4, 2.9) | 0.05 |
Abbreviations: BMI= body mass index; SBP=systolic blood pressure; DBP=diastolic blood pressure; AUC= are under curve; TG=triglyceride; HDL-C= high density lipoprotein cholesterol; eGFR=estimated glomerular filtration rate; HOMA-IR= Homeostatic model assessment for insulin resistance; MMTT= mix meal tolerance test; Matsuda ISI= Matsuda insulin sensitivity index; OGIS=oral glucose insulin sensitivity index.
Wilcoxon signed-rank test.
HOMA-IR >2.5 shows liver insulin resistance.
Matsuda ISI <2.5 shows whole body insulin resistance, mainly peripheral insulin resistance at the skeletal muscle and adipose tissue level.
Visceral and subcutaneous fat area were measurement by a single CT axial image at L3 vertebral level, pre-nephrectomy period.
Figure 1.

Mean blood glucose concentrations (mg/dl) (error bars representing standard error of the mean) based on the mixed meal tolerance test pre-nephrectomy and post-nephrectomy periods in living kidney donors (N=9) (p-value = 0.77).*
Figure 2.
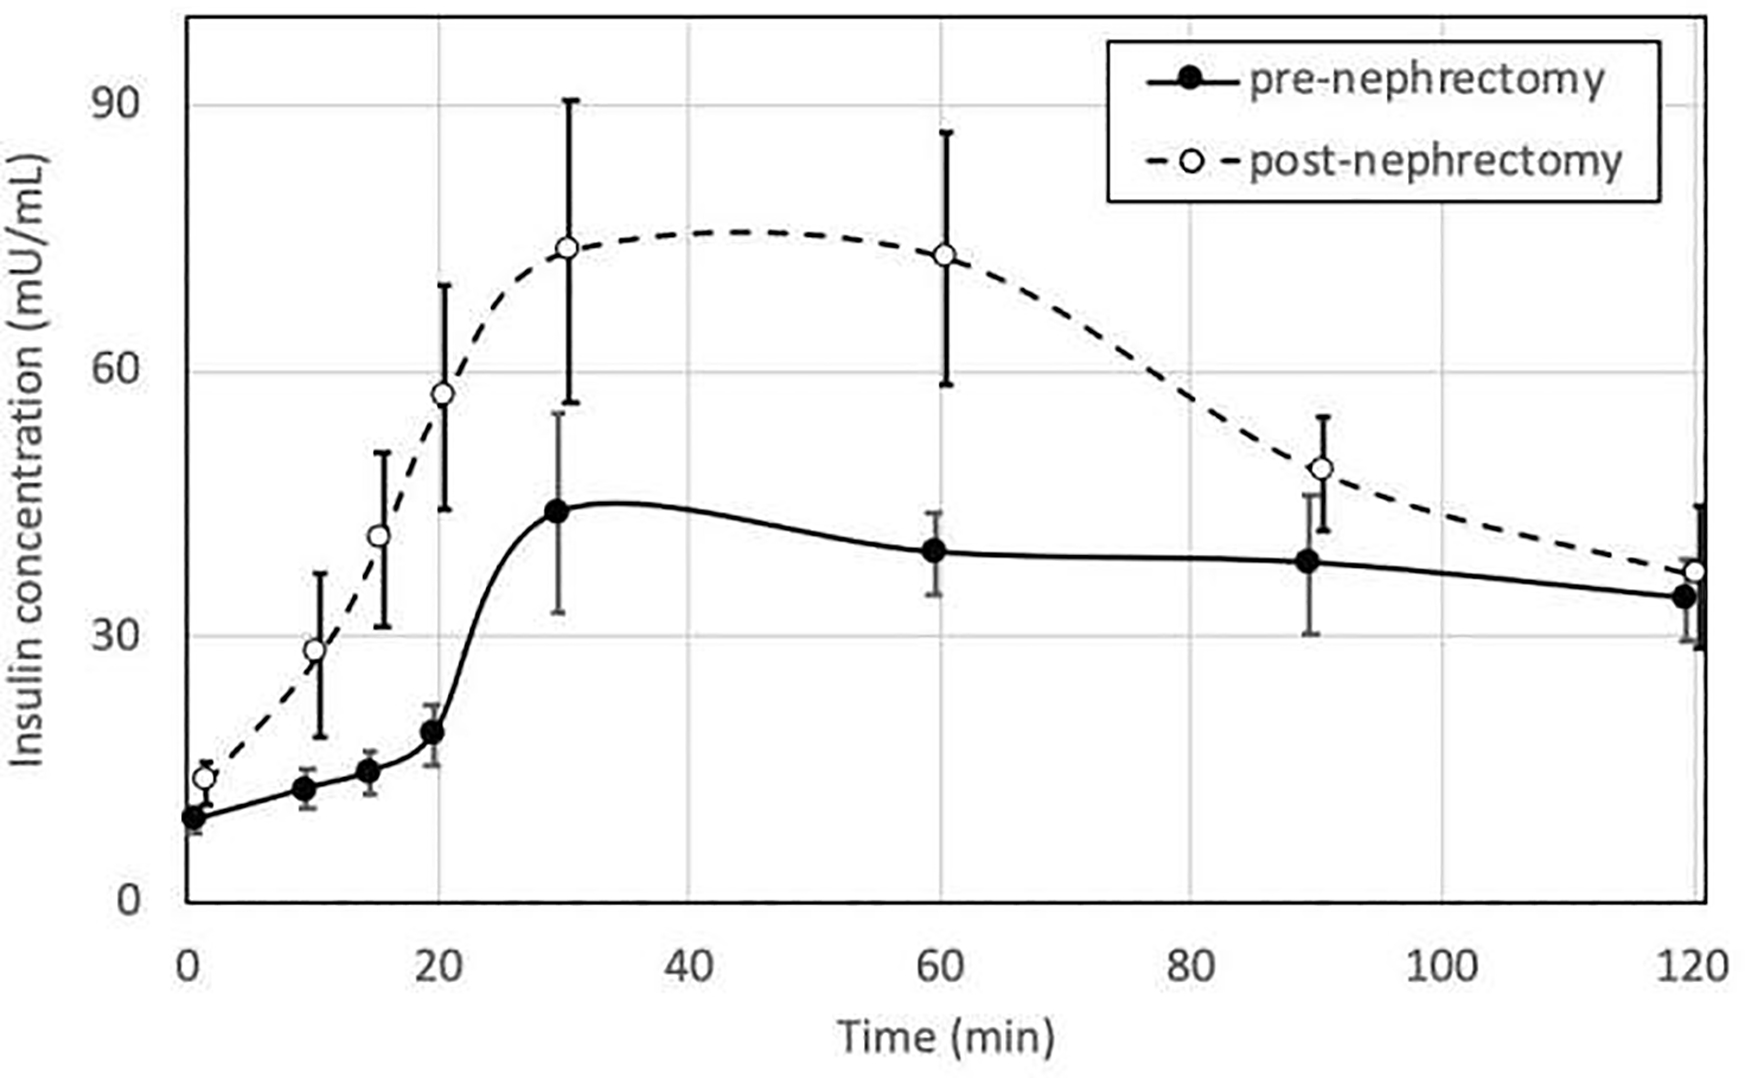
Mean plasma insulin concentrations (mU/ml) (error bars representing standard error of the mean) based on the mixed meal tolerance testing pre-nephrectomy and post-nephrectomy periods in living kidney donors (N=9). (p-value = 0.04).*
*Wilcox signed-rank test comparing glucose AUC (hr*mg/dL) between pre and post-nephrectomy values.
Patient-Level Changes Between Pre- and Post-Nephrectomy Phases:
The patient-level changes are shown in Table 2. The study cohort, in the pre-nephrectomy phase, included the patients with the family history of diabetes (two patients with first degree relatives), fasting plasma glucose ≥100 mg/dl (three patients; 100, 100, 105 mg/dl), and HbA1C>5.8% (two patients; 5.9% and 6.0%). None of these four patients met the criteria for metabolic syndrome, and their 2-hour plasma glucose levels following Boost bolus according to the MMTT protocol were also below 140 mg/dl in the pre- and post-nephrectomy testing (Table 1). Overall, post-donation at three-months, three patients gained weight (1 kg, 5kg, and 6kg), two patients lost weight (1kg each), and four patients maintained their body weight at the pre-donation level. In the post-nephrectomy phase, the LKDs with BMI>32, mostly had higher level of fasting insulin (mU/mL), insulin AUC (pmol/L), HbA1C (%), HOMA-IR and AUC insulin/glucose ratio compared to the pre-nephrectomy phase, while their Matsuda ISI levels were lower.
Table 2.
Pre- and post-nephrectomy changes in each study subject (N=9).
| Patient# | Age (yr) | Gender | Race | Fam hx of DM | W (kg) | BMI (kg/m2) | V-fat (cm2) | HbA1C (%) | Fasting glucose (mg/dl) | Fasting insulin (mU/ml) | eGFR (ml/min/1.73 m2) | HOMA-IR | AUC ins/glu (pmol/mmol) | Matsuda ISI |
|---|---|---|---|---|---|---|---|---|---|---|---|---|---|---|
| PRE | ||||||||||||||
| 1 | 32 | F | W | 54 | 21.5 | 24 | 4.9 | 79 | 5 | 115 | 1.0 | 28.5 | 13.6 | |
| 2 | 23 | M | H | 66 | 22.7 | 31 | 4.7 | 89 | 8.5 | 120 | 1.9 | 30.9 | 7.1 | |
| 3 | 65 | F | W | 70 | 25.7 | 88 | 5.5 | 91 | 7.6 | 78 | 1.7 | 37.4 | 5.9 | |
| 4 | 52 | F | W | Y | 82 | 26.7 | 97 | 5.4 | 95 | 6.4 | 100 | 1.5 | 20.5 | 8.1 |
| 5 | 52 | F | B | 91 | 29.0 | 114 | 6 | 99 | 8.4 | 100 | 2.1 | 52.2 | 4.5 | |
| 6 | 48 | F | H | 86 | 32.0 | 106 | 5.7 | 100 | 19.7 | 108 | 4.9 | 75.6 | 2.5 | |
| 7 | 35 | M | W | Y | 108 | 32.3 | 190 | 5.4 | 105 | 8 | 111 | 2.1 | 25.5 | 6.2 |
| 8 | 49 | M | H | 111 | 36.0 | 183 | 5.9 | 100 | 9.5 | 100 | 2.4 | 28.1 | 5.9 | |
| 9 | 28 | M | H | 103 | 36.7 | 191 | 5.1 | 83 | 9.7 | 116 | 2.0 | 51.5 | 5.2 | |
| POST | ||||||||||||||
| 1 | 32 | F | W | 53 | 21.1 | * | 4.9 | 74 | 6.4 | 85 | 1.2 | 34.9 | 9.6 | |
| 2 | 23 | M | H | 66 | 22.7 | 4.6 | 88 | 7.1 | 94 | 1.5 | 66.1 | 6.1 | ||
| 3 | 65 | F | W | 70 | 25.7 | 5.3 | 93 | 13.1 | 59 | 3.0 | 52.0 | 3.8 | ||
| 4 | 52 | F | W | Y | 82 | 26.7 | 5.3 | 92 | 7.1 | 58 | 1.6 | 15.4 | 11.0 | |
| 5 | 52 | F | B | 96 | 30.5 | 5.9 | 93 | 9.9 | 58 | 2.3 | 62.1 | 4.3 | ||
| 6 | 48 | F | H | 87 | 32.4 | 5.9 | 94 | 24.7 | 67 | 5.7 | 119.3 | 2.3 | ||
| 7 | 35 | M | W | Y | 110 | 32.9 | 5.4 | 102 | 11.4 | 78 | 2.9 | 43.1 | 3.9 | |
| 8 | 49 | M | H | 117 | 38.1 | 5.9 | 105 | 16.8 | 64 | 4.4 | 79.2 | 2.6 | ||
| 9 | 28 | M | H | 101 | 34 | 5.4 | 96 | 25 | 68 | 5.9 | 113.0 | 2.0 |
V-fat (visceral fat surface area) measurement was only performed pre-nephrectomy phase.
Abbreviations: Gender F=female, M=male; Race W=White, H=Hispanic, B=Black; Fam hx of DM= family history of diabetes, Y=yes; W=Weight; BMI= body mass index; V-fat= Visceral fat surface area measurement; HbA1C=hemoglobin A1C; eGFR=estimated glomerular filtration rate; HOMA-IR= Homeostatic model assessment for insulin resistance; AUC ins/glu= area under curve insulin/glucose; Matsuda ISI= Matsuda insulin sensitivity index.
Discussion:
Our pilot study demonstrates that post-donor nephrectomy, the fasting insulin, and insulin AUC in the MMTT increased without significant change in corresponding glucose levels. The donors appeared to have a trend toward a decline in insulin sensitivity post-donor nephrectomy in short-term based three proxies of insulin sensitivity, and the changes were more pronounced in obese donors (BMI>32).
Data on metabolic state pre- and post-nephrectomy is limited. A prior case-control study of 14 living kidney donors, demonstrated increased plasma insulin levels and insulin resistance [HOMA-IR]) post-donor nephrectomy compared to 25 healthy controls.5 However, the absence of any pre-donation data precluded the authors from being able to comment on the impact of donation nephrectomy on insulin resistance.
The exact mechanism that leads to the decrease in insulin sensitivity is unclear, but It seems unlikely that the post-donation decline in GFR around 60–80 ml/min/m2 range could be the only contributing factor. The kidney’s role in insulin metabolism and renal glucose handling is complex. Prior studies in CKD and insulin metabolism did not identify impaired insulin clearance until GFR dropped to <40ml/min/m2. The kidney plays a crucial role in glucose metabolism via gluconeogenesis (20% of daily production occurring in the renal cortex), glycolysis (renal medulla), glucose filtration (freely filtered in the glomerulus), and reabsorption (in the proximal tubules via apical sodium-glucose co-transporter [SGLT] and basolateral GLUTs).21 How unilateral nephrectomy affects renal glucose filtration, absorption thresholds, transporter upregulation, and gluconeogenesis is currently unknown. Other potential factors that contribute to the observed decrease in insulin sensitivity in LKDs may be related to laparoscopic abdominal surgery inflammation and stress,22 alteration in the renin-angiotensin system,23 excess visceral fat changing glucose homeostasis by increasing glycerol level through dysregulated lipolysis to fuel hepatic gluconeogenesis.24
Neeland et al., in the Dallas Heart Study, demonstrated that the risk of diabetes varied among the general population with obesity, mainly due to having dysfunctional adiposity phenotype (visceral fat and insulin resistance [measured by HOMA-IR]), but not necessarily general adiposity.25 In multivariable logistic regression analysis, they demonstrated that higher baseline visceral fat mass, fasting glucose level, fructosamine level, weight gain at follow-up independently associated with diabetes, but not BMI, total fat mass, or subcutaneous fat. They suggested that visceral adiposity (fat deposition in viscera and liver), adipokine dysregulation, and insulin resistance play a vital mediator role in the development of diabetes. This observation brings up two critical points in the living donor setting: 1) these factors associated with future risk of developing diabetes (visceral fat measurement based on routine abdominal CT imaging, fasting glucose and insulin levels to calculate HOMA-IR, adiponectin and fructosamine levels accessible through commercial labs) are mostly readily available pre-donation to conduct a multicenter large-scale prospective study that its result may guide better donor selection(e.g. to define visceral fat area and or volume associated with diabetes that is unacceptable for donation) and informed consent in the future; 2) potential obese donors (BMI>30) are generally asked by transplant centers to lose weight to qualify for a donation. However, once living donors undergo nephrectomy, post-donation weight gain is prevalent and associated with increased risk of developing diabetes, relative risk 4.18 (95% confidence interval [CI] 2.05–8.50).26 Therefore, all prospective donors should continually be counseled on a healthy lifestyle and the consequences of substantial weight gain.
The KDIGO Living Kidney Donor Work Group27 has recently published guidelines, and the recommendations for the decision to approve donor candidates with prediabetes (glucose intolerance) and type 2 diabetes mellitus (DM) are conflicting and left to the transplant program’s acceptable risk threshold based on donor’s demographics and health profile (older candidates with type 2 DM with well-controlled glycemia, not requiring insulin and without end-organ damage might be considered for donation). Increasing age, high-risk ethnicity/race, obesity (BMI>30), metabolic syndrome, history of diabetes mellitus in a first-degree relative, and gestational DM are important risk factors for prediabetes and diabetes in the general population, and 5–10% of prediabetics develop DM annually.28 In the U.S., a national survey (total of 132 centers participated) reported that there had been substantial variation among transplant centers regarding exclusion criteria of donors based on impaired fasting glucose (100–110 mg/dl) (37% of centers), impaired glucose tolerance test (2-hour glucose>140 mg/dl) (61% of the centers), and type 2 DM status (64% of the centers).29 Fasting glucose, HbA1C, and 75 grams oral glucose tolerance test (2 hours), calculation of DM risk based on predictive tools (the Finnish Diabetes Risk Score and the Diabetes Personal Health Decisions risk assessment tool powered by the Archimedes algorithm), age, ethnicity, and BMI are commonly being taken into consideration for the decision to approve donor candidates with high-risk individually based on the transplant program’s acceptable risk threshold.30
There still exists an unanswered question whether post-nephrectomy insulin resistance can be abrogated with exercise, subsequent weight loss, bariatric surgery, pharmacologic therapy (specifically empagliflozin, an SGLT-2 inhibitor which favorably alters glycerol metabolism to decrease hepatic gluconeogenesis). Further research focusing on adipose tissue distribution and function, circulating biomarkers, utilizing gold standard insulin sensitivity testing, launching clinical risk assessment decision tools are warranted.
Strengths of the current pilot study include detailed phenotyping utilizing advanced imaging and metabolic testing, pre and post-nephrectomy comparison, and using a prospective cohort. As with any pilot study, our cohort was small, and also, we do not have long term follow up.
In conclusion, LKDs appear to have a trend toward a decline in insulin sensitivity post-donor nephrectomy in the short-term, especially in obese donors (BMI>32). Multiethnic and multicenter studies with larger sample sizes that analyze glucose metabolism and insulin sensitivity pre- and post-donor nephrectomy with longitudinal follow-up are needed. Moreover, the establishment of a granular national donor registry would be invaluable in permitting an assessment of long-term risks of kidney donation, identifying donors at risk, and developing mitigation strategies.
Acknowledgments:
The authors thank Lawrence J. Mandarino, PhD for his critical review of the manuscript.
Funding:
This publication was supported by the National Center for Advancing Translational Sciences, National Institutes of Health, through Grant Number UL1RR024156. The content is solely the responsibility of the authors and does not necessarily represent the official views of the NIH.
Abbreviations:
- AUC insulin/glucose
area under curve for insulin/glucose concentrations
- BMI
body mass index
- CKD-EPI
Chronic Kidney Disease – Epidemiology Collaboration equation for glomerular filtration estimate
- DM
Diabetes Mellitus
- eGFR
Estimated glomerular filtration rate
- HOMA-IR
Homeostatic Model Assessment of insulin resistance
- LKD
Living kidney donor
- MMTT
mixed meal tolerance test
Footnotes
Disclosures:
The authors declare no conflict of interest related to the topic.
Publisher's Disclaimer: This is a PDF file of an unedited manuscript that has been accepted for publication. As a service to our customers we are providing this early version of the manuscript. The manuscript will undergo copyediting, typesetting, and review of the resulting proof before it is published in its final form. Please note that during the production process errors may be discovered which could affect the content, and all legal disclaimers that apply to the journal pertain.
REFERENCES:
- 1.Hart A, Smith JM, Skeans MA, et al. OPTN/SRTR 2018 Annual Data Report: Kidney. Am J Transplant. 2020;20Suppl s1:20–130. [DOI] [PubMed] [Google Scholar]
- 2.Mjoen G, Hallan S, Hartmann A, et al. Long-term risks for kidney donors. Kidney international. 2014;86(1):162–167. [DOI] [PubMed] [Google Scholar]
- 3.Muzaale AD, Massie AB, Wang MC, et al. Risk of end-stage renal disease following live kidney donation. Jama. 2014;311(6):579–586. [DOI] [PMC free article] [PubMed] [Google Scholar]
- 4.Ibrahim HN, Berglund DM, Jackson S, Vock DM, Foley RN, Matas AJ. Renal Consequences of Diabetes After Kidney Donation. Am J Transplant. 2017;17(12):3141–3148. [DOI] [PMC free article] [PubMed] [Google Scholar]
- 5.Shehab-Eldin W, Shoeb S, Khamis S, Salah Y, Shoker A. Susceptibility to insulin resistance after kidney donation: a pilot observational study. American journal of nephrology. 2009;30(4):371–376. [DOI] [PubMed] [Google Scholar]
- 6.Nerpin E, Riserus U, Ingelsson E, et al. Insulin sensitivity measured with euglycemic clamp is independently associated with glomerular filtration rate in a community-based cohort. Diabetes care. 2008;31(8):1550–1555. [DOI] [PMC free article] [PubMed] [Google Scholar]
- 7.Serrano OK, Sengupta B, Bangdiwala A, et al. Implications of excess weight on kidney donation: Long-term consequences of donor nephrectomy in obese donors. Surgery. 2018;164(5):1071–1076. [DOI] [PubMed] [Google Scholar]
- 8.Centers for Disease Control and Prevention. Diabetes Report Card 2017. Atlanta, GA: Centers for Disease Control and Prevention, US Dept of Health and Human Services; 2018. https://www.cdc.gov/diabetes/pdfs/library/diabetesreportcard2017-508.pdf, accessed on February 9, 2020. Accessed. [Google Scholar]
- 9.Yasuda K, Yamada Y, Inagaki N, et al. Expression of GLUT1 and GLUT2 glucose transporter isoforms in rat islets of Langerhans and their regulation by glucose. Diabetes. 1992;41(1):76–81. [DOI] [PubMed] [Google Scholar]
- 10.Zimmet P, Magliano D, Matsuzawa Y, Alberti G, Shaw J. The metabolic syndrome: a global public health problem and a new definition. J Atheroscler Thromb. 2005;12(6):295–300. [DOI] [PubMed] [Google Scholar]
- 11.Caumo A, Bergman RN, Cobelli C. Insulin sensitivity from meal tolerance tests in normal subjects: a minimal model index. The Journal of clinical endocrinology and metabolism. 2000;85(11):4396–4402. [DOI] [PubMed] [Google Scholar]
- 12.Greenbaum CJ, Mandrup-Poulsen T, McGee PF, et al. Mixed-meal tolerance test versus glucagon stimulation test for the assessment of beta-cell function in therapeutic trials in type 1 diabetes. Diabetes care. 2008;31(10):1966–1971. [DOI] [PMC free article] [PubMed] [Google Scholar]
- 13.Dalla Man C, Campioni M, Polonsky KS, et al. Two-hour seven-sample oral glucose tolerance test and meal protocol: minimal model assessment of beta-cell responsivity and insulin sensitivity in nondiabetic individuals. Diabetes. 2005;54(11):3265–3273. [DOI] [PubMed] [Google Scholar]
- 14.Matthews DR, Hosker JP, Rudenski AS, Naylor BA, Treacher DF, Turner RC. Homeostasis model assessment: insulin resistance and beta-cell function from fasting plasma glucose and insulin concentrations in man. Diabetologia. 1985;28(7):412–419. [DOI] [PubMed] [Google Scholar]
- 15.Hermans MP, Levy JC, Morris RJ, Turner RC. Comparison of insulin sensitivity tests across a range of glucose tolerance from normal to diabetes. Diabetologia. 1999;42(6):678–687. [DOI] [PubMed] [Google Scholar]
- 16.Jia T, Huang X, Qureshi AR, et al. Validation of insulin sensitivity surrogate indices and prediction of clinical outcomes in individuals with and without impaired renal function. Kidney international. 2014;86(2):383–391. [DOI] [PubMed] [Google Scholar]
- 17.Festa A, Haffner SM, Wagenknecht LE, Lorenzo C, Hanley AJ. Longitudinal decline of beta-cell function: comparison of a direct method vs a fasting surrogate measure: the Insulin Resistance Atherosclerosis Study. The Journal of clinical endocrinology and metabolism. 2013;98(10):4152–4159. [DOI] [PMC free article] [PubMed] [Google Scholar]
- 18.Matsuda M, DeFronzo RA. Insulin sensitivity indices obtained from oral glucose tolerance testing: comparison with the euglycemic insulin clamp. Diabetes care. 1999;22(9):1462–1470. [DOI] [PubMed] [Google Scholar]
- 19.Lorenzo C, Wagenknecht LE, Rewers MJ, et al. Disposition index, glucose effectiveness, and conversion to type 2 diabetes: the Insulin Resistance Atherosclerosis Study (IRAS). Diabetes care. 2010;33(9):2098–2103. [DOI] [PMC free article] [PubMed] [Google Scholar]
- 20.Mari A, Pacini G, Brazzale AR, Ahren B. Comparative evaluation of simple insulin sensitivity methods based on the oral glucose tolerance test. Diabetologia. 2005;48(4):748–751. [DOI] [PubMed] [Google Scholar]
- 21.Mather A, Pollock C. Glucose handling by the kidney. Kidney international Supplement. 2011(120):S1–6. [DOI] [PubMed] [Google Scholar]
- 22.Hawthorne GC, Ashworth L, Alberti KG. The effect of laparoscopic cholecystectomy on insulin sensitivity. Horm Metab Res. 1994;26(10):474–477. [DOI] [PubMed] [Google Scholar]
- 23.Lelis DF, Freitas DF, Machado AS, Crespo TS, Santos SHS. Angiotensin-(1–7), Adipokines and Inflammation. Metabolism. 2019;95:36–45. [DOI] [PubMed] [Google Scholar]
- 24.Gaidhu MP, Anthony NM, Patel P, Hawke TJ, Ceddia RB. Dysregulation of lipolysis and lipid metabolism in visceral and subcutaneous adipocytes by high-fat diet: role of ATGL, HSL, and AMPK. Am J Physiol Cell Physiol. 2010;298(4):C961–971. [DOI] [PubMed] [Google Scholar]
- 25.Neeland IJ, Turer AT, Ayers CR, et al. Dysfunctional adiposity and the risk of prediabetes and type 2 diabetes in obese adults. Jama. 2012;308(11):1150–1159. [DOI] [PMC free article] [PubMed] [Google Scholar]
- 26.Issa N, Sanchez OA, Kukla A, et al. Weight gain after kidney donation: Association with increased risks of type 2 diabetes and hypertension. Clin Transplant. 2018;32(9):e13360. [DOI] [PubMed] [Google Scholar]
- 27.Lentine KL, Kasiske BL, Levey AS, et al. KDIGO Clinical Practice Guideline on the Evaluation and Care of Living Kidney Donors. Transplantation. 2017;101(8S Suppl 1):S1–S109. [DOI] [PMC free article] [PubMed] [Google Scholar]
- 28.Narayan KM, Boyle JP, Thompson TJ, Sorensen SW, Williamson DF. Lifetime risk for diabetes mellitus in the United States. Jama. 2003;290(14):1884–1890. [DOI] [PubMed] [Google Scholar]
- 29.Rodrigue JR, Pavlakis M, Danovitch GM, et al. Evaluating living kidney donors: relationship types, psychosocial criteria, and consent processes at US transplant programs. Am J Transplant. 2007;7(10):2326–2332. [DOI] [PubMed] [Google Scholar]
- 30.Vigneault CB, Asch WS, Dahl NK, Bia MJ. Should living kidney donor candidates with impaired fasting glucose donate? Clin J Am Soc Nephrol. 2011;6(8):2054–2059. [DOI] [PubMed] [Google Scholar]