

Abstract
For assessing human leukocyte antigen compatibility in deceased donor kidney transplantation, virtual crossmatch is used as an alternative to physical crossmatch and has potential to reduce cold ischemia time. The 2014 United States kidney allocation system prioritized highly sensitized candidates but led to increased shipping of kidneys. Using data from the Scientific Registry of Transplant Recipients, we evaluated changes in virtual crossmatch use with the new allocation policy and the impact of virtual crossmatch use on cold ischemia time and transplant outcomes. This was a retrospective cohort study of adult deceased donor kidney recipients in the United States (2011–2018) transplanted with either 9,632 virtual or 71,839 physical crossmatchs. Before allocation change, only 9% of transplants were performed relying on a virtual crossmatch. After the 2014 allocation change, this increased by 2.4%/year so that 18% transplants in 2018 were performed with just a virtual crossmatch. There was significant variation in virtual crossmatch use among transplant regions (range 0.7–36%) and higher use was noted among large volume centers. Compared to physical crossmatchs, virtual crossmatchs were significantly associated with shorter cold ischemia times (mean 15.0 vs 16.5 hours) and similar death-censored graft loss and mortality (both hazard ratios HR 0.99) at a median follow-up of 2.9 years. Thus, our results show that virtual crossmatch is an attractive strategy for shortening cold ischemia time without negatively impacting transplant outcomes. Hence, strategies to optimize use and reduce practice variation may allow for maximizing benefits from virtual crossmatch.
Keywords: Kidney transplantation, Kidney Allocation System, Virtual Crossmatch, Cold Ischemia Time
Graphical Abstract

Introduction
Human Leukocyte Antigen (HLA) crossmatch to assess donor-recipient compatibility is a crucial step prior to kidney transplantation (KT) and avoids transplantation across pre-formed HLA antibodies that may lead to hyperacute rejection and graft loss.1 In the United States (US) Organ Procurement and Transplantation Network (OPTN) policy and Centers for Medicare and Medicaid Services (CMS) regulations require a crossmatch to be performed prior to every KT. This has traditionally been fulfilled with a physical crossmatch (PXM) which has some limitations. False positive PXM in the absence of HLA antibodies occur in 5–20% and may result in inappropriate organ refusals.2–5 Additionally, performing a PXM takes up to 3 – 6 hours from sample availability and may lengthen cold ischemia time (CIT),6,7 which is a risk factor for delayed graft function (DGF), organ discards (procured but not transplanted) and adverse graft outcomes.8,9
Given these limitations, virtual crossmatch (VXM) has been proposed and used an alternative to PXM, with single center studies reporting outcomes similar to PXM, even among highly sensitized patients.3,10–16 VXM assesses HLA compatibility by comparing a recipient’s HLA antibody profile with donor’s HLA typing information and has a negative predictive value ranging from 88% in HLA sensitized recipients (i.e. high calculated panel reactive antibodies (CPRA)) to 99% in non-sensitized recipients.4,10 Yet, in the US, VXM has been used infrequently for deceased donor kidney transplantation (DDKT) and has not been studied well, with published data mostly coming from few select transplant centers. Introduction of a new Kidney Allocation System (KAS) in 2014 resulted in increased transplant rates for highly sensitized patients (i.e., CPRA ≥ 98%) as intended17 but resulted in increased movement of kidneys to centers outside the donor organ procurement organization (OPO) with resultant longer CIT and higher DGF rates.18,19 It is unknown whether VXM use changed with KAS implementation. Changes to kidney allocation such as the shift to using concentric circles for kidney allocation in the US may further impact logistics. A better understanding of the changes in crossmatch practices to policy implementation may aid in improving logistics of allocation and organ transport. We hypothesized that VXM use increased following the implementation of the new allocation policy and that its use will be associated with shorter CIT. Using data from the scientific registry of transplant recipients (SRTR), we examined the national trends in VXM use pre-and post KAS implementation, factors associated with variation in VXM use, and the effect of VXM use on CIT, DGF, death-censored graft loss (DCGL) and mortality.
Materials and Methods
Study Design and Data Source
This was an OPTN/SRTR registry-based retrospective cohort analysis of patients ≥18 years of age who received a DDKT in the US between December 5, 2011 and December 1, 2018. Recipients of multiorgan transplants including kidney-pancreas transplants were excluded. The SRTR data includes data on donors, wait-listed candidates, and transplant recipients in the US, submitted by the members of OPTN. The Health Resources and Services Administration (HRSA), US Department of Health and Human Services oversees activities of the OPTN and SRTR contractors. Data from OPTN is supplemented with data from CMS and the National Death Index. This analysis was performed with approval from SRTR under a data use agreement. The clinical and research activities being reported are consistent with the Principles of the Declaration of Istanbul as outlined in the ‘Declaration of Istanbul on Organ Trafficking and Transplant Tourism’.20
Cohort Definition and Covariates
We retrieved data on recipient and donor characteristics, local vs import donor and histocompatibility testing. Kidney donor profile index (KDPI) was calculated using the 10 donor variables as recommended by OPTN.21 OPTN histocompatibility data includes information on donor and recipient HLA typing, HLA antigen mismatch, CPRA and PXM.22 For PXM, data includes whether a PXM was performed and if it was done before the kidney transplant surgery or not (i.e., prospective, or retrospective PXM). For this analysis, we defined the VXM cohort as DDKT performed with a sole reliance on VXM (i.e., transplants without a PXM or those where PXM was done retrospectively). Transplant centers were categorized based on quartiles (Q1, Q2, Q3 and Q4) of yearly DDKT volumes; centers performing ≤2 adult DDKT per year were excluded. CPRA was grouped into four categories (≤10%, 11–80%, 81–98%, >98%) to reflect the degree of sensitization and allocation priority afforded to patients with CPRA >98%.
Outcomes
Proportion of DDKT performed with VXM before and after KAS introduction along with differences in CIT, early clinical events (DGF, rejection and graft loss occurring during index transplant hospitalization), DCGL and mortality between the two crossmatch strategies.
Statistical Methods
Differences in baseline characteristics between VXM and PXM were evaluated with Student’s t test or Wilcoxon rank-sum test for continuous variables, and chi-square for categorical variables. A square root transformation was used for CIT due to skewed distribution. Since missing data was <1% (Table S1), a complete case analysis was performed. Patients were followed until death or the last follow-up date (December 2, 2019).
VXM use pre- and post-KAS was evaluated with a Generalized estimating equation (GEE) interrupted time series model using monthly averages of DDKT performed with VXM. An interaction term between monthly VXM use and a dummy variable KAS provided the slope of change in VXM use post-KAS.23 Analysis was adjusted for covariates potentially related to VXM use-UNOS regions, import kidney, CPRA, KDPI>85, donor age, donation after cardiac death (DCD), CIT, prior KT, number of centers per OPO, use of machine perfusion and donor kidney biopsy. Odds ratio for VXM use after KAS among UNOS regions and transplant centers grouped based on DDKT volumes were assessed using logistic regression.
GEE models with clustering at transplant center level were used to evaluate differences in CIT, DGF, early rejection and graft loss during the index hospitalization. For DCGL and mortality, Cox proportional hazards models with robust standard error estimator adjusting for clustering within transplant centers were used, with censoring after 7 years of follow up. Survival analysis was repeated for key subgroups (KDPI(<or>85), DCD status, median CIT, local vs import organ, recipient gender, CPRA, prior KT and preemptive or not) and results are shown as forest plots. Model for CIT was adjusted for KDPI, donor kidney biopsy, center volumes, pre-transplant dialysis and transplant year along with an interaction term for VXM and import (vs. local) organ. In addition to above covariates, models for DGF, DCGL, mortality, rejection and graft loss during index hospitalization were also adjusted for donor gender, use of machine perfusion, recipient factors (age, gender, BMI, race, DM, ESRD etiology, dialysis duration, prior KT, 0 antigen mismatch, CPRA), induction agent and CIT.
Since our VXM cohort included both, patients transplanted without a physical crossmatch and those transplanted with a retrospective PXM, a sensitivity analysis was performed by repeating the analysis for retrospective PXM only cohort. To assess the potential consequences of a false negative VXM, we evaluated outcomes based on the results of the retrospective PXM. However, this data was available only for transplants performed before April 2015 since SRTR stopped collecting this information in 2015. Finally, we evaluated the graft and patient outcomes among a cohort of 4,410 paired kidney transplants where one kidney was transplanted with PXM and other with reliance on VXM.
Analysis was performed with STATA version 15 (StataCorp, College Station, TX) and R version 3.4.2 (R Foundation for Statistical Computing, Vienna, Austria). Two-sided P values were used and a p value of <0.05 was considered statistically significant.
Results
Study cohort
A total of 87,567 DD kidney alone transplants were performed between December 5, 2011 and December 01, 2018. After excluding pediatric recipients, centers performing <2 DDKT per year and transplants with missing PXM data, 81,471 DDKT recipients from 219 transplant centers were included for analysis (Figure 1). Of these, 31,650 (38.9%) were performed pre-KAS and 48,821 (61.1%) post-KAS. Median follow up duration was 2.9 years.
Figure 1.

Flow chart for study cohort selection. DDKT: Deceased donor kidney transplantation
71,839 (88.2%) of DDKT were performed with a prospective PXM while the remaining 9,632 (11.8%) were performed relying on a VXM. Among this VXM cohort, 5,702 (59.2%) had a retrospective PXM while 3,930 (40.8%) had no PXM performed. Donor and recipient characteristics for the cohorts are shown in Table 1. VXM cohort included a larger proportion of imported kidneys (36% vs 26%;p<0.001), higher KDPI (median 41 vs 38; p<0.001), lower use of machine perfusion (23% vs 40%;p<0.001), lower proportion of prior KT recipients (9% vs 14%; p<0.001), lower proportion of Black recipients (25% vs 34%, p<0.001), lower proportion of patients with CPRA<10% (63% vs 71%; p<0.001) and recipients who were less likely to receive T-cell depleting agents (59% vs 73%, p<0.001). There was a small gender difference with females representing 40% of PXM cohort and 38% of VXM cohort (p<0.001). Differences in baseline characteristics among the two groups when evaluated separately pre- and post-KAS are shown in Table 2. Though proportion of females receiving a KT increased post-KAS, there remained a slightly lower proportion of female recipients in VXM (38% vs 41%; p<0.001). Similarly, though transplant rates increased for Black patients post-KAS, they were still less likely to receive a DDKT with VXM alone (26% vs 35%). (Table 2) Among recipients with CPRA>98%, VXM was used in 4.3% (37/853) and 10.4% (551/5,314) pre- and post-KAS respectively.
Table 1:
Baseline characteristics of physical crossmatch (N=71,839) and virtual crossmatch (N=9,632) cohorts.
| Crossmatch Type | ||
|---|---|---|
| Physical XM | Virtual XM | |
| (N = 71,839) | (N = 9,632) | |
| Donor age (years), Median (IQR) | 39 [26, 51] | 40 [26, 51] |
| Female donor | 28,081 (39%) | 3,660 (38%) |
| Black Donor | 10,527 (15%) | 1,299 (13%) |
| Donor serum creatinine (mg/dL), Median (IQR) | 0.9 [0.7, 1.3] | 1.0 [0.7, 1.5] |
| KDPI (%), Median (IQR) | 38 [17, 61] | 41 [20, 63] |
| KDPI > 85 | 3,938 (5%) | 620 (6%) |
| DCD donor | 13,824 (19%) | 1,664 (17%) |
| Machine perfusion | 28,584 (40%) | 2,208 (23%) |
| Donor kidney biopsy | 34,901 (49%) | 4,393 (46%) |
| Import kidney | 18,769 (26%) | 3,436 (36%) |
| Transplant center volume (DDKT/year), Median (IQR) | 82 [52, 134] | 131 [74, 176] |
| Transplant centers per OPO, Median (IQR) | 4 [2, 9] | 4 [4,10] |
| Recipient age (years), Median (IQR) | 55 [44, 63] | 56 [46, 64] |
| Female recipient | 28,762 (40%) | 3,612 (38%) |
| Recipient race | ||
| White | 41,223 (57%) | 5,907 (61%) |
| Black | 24,549 (34%) | 2,427 (25%) |
| Asian | 4,581 (6%) | 1,118 (12%) |
| Other | 1,486 (2%) | 180 (2%) |
| Recipient BMI (kg/m2), Median (IQR) # | 27.9 [24.2, 32.1] | 27.2 [23.7, 31.2] |
| ESRD cause | ||
| Hypertension | 18,030 (25%) | 2,026 (21%) |
| Glomerular disease | 15,542 (22%) | 1,737 (18%) |
| Diabetes Mellitus | 19,679 (28%) | 2,757 (29%) |
| PKD | 5,597 (8%) | 579 (6%) |
| Other | 12,699 (18%) | 2,503 (26%) |
| Pre-transplant dialysis | 63,967 (89%) | 8,214 (86%) |
| Dialysis duration (months), Median (IQR) | 49.9 [27.2, 76.6] | 50.9 [20.9, 85.7] |
| Time on waitlist (months), Median (IQR) | 24.8 [7.7, 46.5] | 18.9 [3.4, 48.6] |
| Prior kidney transplantation | 9,834 (14%) | 877 (9%) |
| CPRA | ||
| <10% | 45,298 (63%) | 6,848 (71%) |
| 10% – 80% | 13,457 (19%) | 1,513 (16%) |
| 81% – 98% | 7,495 (10%) | 681 (7%) |
| 99% −100% | 5,579 (8%) | 588 (6%) |
| Zero HLA ABDR mismatch # | 4,377 (6%) | 564 (6%) |
| Induction therapy | ||
| None | 9,431 (13%) | 1,427 (15%) |
| Thymoglobulin | 41,521 (58%) | 4,690 (49%) |
| lnterleukin-2 Blocker | 10,222 (14%) | 2,726 (28%) |
| Alemtuzumab | 10,665 (15%) | 789 (8%) |
BMI: Body mass index; CPRA: Calculated panel reactive antibody; DCD: Donation after cardiac death; DDKT: Deceased donor kidney transplantation; ESRD: End stage renal disease; HLA: Human leukocyte antigen; IQR: Interquartile range; KDPI: Kidney donor profile index; OPO: Organ procurement organization; PKD: Polycystic kidney disease; XM: crossmatch
Missing data was <0.5% for all variables except for recipient BMI (0.84% missing) and 0 HLA ABDR mismatch (0.62% missing)
Table 2.
Baseline characteristics among virtual and physical crossmatch cohorts before and after the 2014 kidney allocation system (KAS) implementation
| Pre-KAS (N = 31, 670) |
Post-KAS (N = 49,801) |
||||
|---|---|---|---|---|---|
| Physical XM (N = 28,586) | Virtual XM (N = 3,084) | Physical XM (N = 43,253) | Virtual XM (N = 6,548) | P value (between VXM cohorts pre- and post-KAS | |
| Donor age (years) # | 40 [26, 51] | 41 [25, 52] | 39 [26, 50] | 39 [27, 51] | 0.9 |
| Female donor (%) | 39.7 | 37.9 | 38.7 | 38 | 0.9 |
| Black Donor (%) | 14 | 13.3 | 14.5 | 13.6 | 0.8 |
| Donor creatinine (mg/dL),# | 0.9 [0.7, 1.3] | 1 [0.7, 1.4] | 0.9 [0.7, 1.3] | 1 [0.7, 1.5] | 0.3 |
| KDPI (%),# | 39 [18, 63] | 43 [20, 66] | 37 [17, 60] | 40 [20, 62] | 0.02 |
| KDPI > 85 (%) | 6.3 | 7.7 | 4.9 | 5.9 | 0.001 |
| DCD donor (%) | 17 | 14.1 | 20.7 | 18.8 | <0.001 |
| Machine perfusion (%) | 39.5 | 18.5 | 40 | 25 | <0.001 |
| Donor kidney biopsy (%) | 48.7 | 43.9 | 48.5 | 46.4 | 0.02 |
| Import kidney (%) | 21.5 | 28.9 | 29.2 | 38.9 | <0.001 |
| Recipient age (years),# | 56 [45, 64] | 57 [47, 64] | 54 [43, 63] | 56 [45,64] | 0.01 |
| Female recipient (%) | 39 | 36 | 41 | 38 | 0.02 |
| Recipient race (%) | 0.01 | ||||
| White | 59.7 | 61.9 | 55.9 | 61.1 | |
| Black | 32.3 | 23.4 | 35.4 | 26 | |
| Asian | 6.2 | 12.9 | 6.5 | 11 | |
| Other | 1.8 | 1.8 | 2.2 | 1.9 | |
| Pre-transplant dialysis (%) | 88.7 | 85.5 | 89.6 | 86.2 | 0.4 |
| Prior kidney transplantation (%) | 13.1 | 8.3 | 14.1 | 9.5 | 0.05 |
| CPRA (%) | <0.001 | ||||
| <10 % | 65.2 | 75.7 | 61.7 | 69 | |
| 10% - 80% | 18.9 | 15.9 | 18.7 | 15.6 | |
| 81% - 98% | 13.1 | 7.2 | 8.7 | 7 | |
| 99% −100% | 2.9 | 1.2 | 11 | 8.4 | |
| Zero HLA ABDR mismatch (%) | 8.3 | 7.3 | 4.6 | 5.6 | 0.002 |
Median [IQR]
CPRA: Calculated panel reactive antibody; DCD: Donation after cardiac death; HLA: Human leukocyte antigen; KDPI: Kidney donor profile index; PKD: Polycystic kidney disease; XM: crossmatch
Virtual crossmatch trends
In the pre-KAS period, VXM use was stable and used in 9.4% of for DDKT (95% CI 6.1%−12.7%) (Figure 2A). Following KAS implementation, there was a non-significant decrease in VXM use (intercept −2% (95% CI −4.1% to 0.2%; p=0.08) that was followed by a steady increase in reliance on VXM beginning in 2015 with a post-KAS increase of 2.4%/year (95% CI 1.2%−4.8%; p=0.001) so that by 2018 17.5% (95% CI 16.9%−18.2%) of DDKT were performed relying on VXM (Figure 2A). This increase was similar and not modified by whether the kidney was local or imported from a non-local OPO (p for interaction 0.2). Coefficients for covariates in the ITSA model are shown in table S2.
Figure 2.

Proportion of adult deceased donor kidney transplants that were transplanted using virtual crossmatch in the United States between December 2011 and December 2018. Figure 2a represents full VXM cohort defined as transplants with no PXM or transplants with retrospective PXM (N=9,632) and Figure 2b represents the virtual crossmatch cohort defined as use of retrospective PXM only (N=5,702). Each point represents VXM use for every month during the study period. Vertical dashed line indicates the month of KAS implementation (December 2014). Interrupted time series model was adjusted for UNOS regions, import kidney, CPRA, KDPI>85, donor age, DCD donor, CIT, prior KT, number of centers per OPO, use of machine perfusion and donor kidney biopsy. KAS: Kidney allocation system; PXM: physical crossmatch; VXM: Virtual crossmatch
VXM practice variations
There was significant variation in VXM use noted among the 11 UNOS regions, both pre-and post-KAS (range: overall 0.7–36.1%; pre-KAS 0.8%−32% and post-KAS 0.6%−38.9%) with UNOS region 5 (California, Utah, New Mexico, Arizona, and Nevada) having the highest VXM use (Table 3 and Figure 3A). Of the 11 regions, 8 showed an increase in VXM use post-KAS with an odds ratio of using VXM ranging between 1.2–5.8 (Table 3 and Figure 3A).
Table 3:
Virtual crossmatch for deceased donor kidney transplants among the United Network for Organ Sharing regions and among centers stratified by annual deceased donor transplant volumes before and after the implementation of 2014 kidney allocation system
| UNOS Region |
Pre-KAS | Post-KAS | VXM (post-KAS vs pre-KAS) | ||||
|---|---|---|---|---|---|---|---|
| Total DDKT | VXM, N (%) | Total DDKT | VXM, N (%) | Change in VXM (%p) | OR for VXM | P value | |
| 1 | 1,161 | 91 (7.8%) | 1,853 | 213 (11.5%) | +3.7% | 1.5 (1.2, 2.0) | 0.001 |
| 2 | 4,048 | 83 (2.1%) | 6,283 | 331 (5.3%) | +3.2% | 2.7(2.1,3.4) | <.001 |
| 3 | 4,422 | 401 (9.1%) | 7,189 | 1,030 (14.3%) | +5.3% | 1.7(1.5,1.9) | <.001 |
| 4 | 2,719 | 112 (4.1%) | 5,027 | 218 (4.3%) | +0.2% | 1.1(0.8,1.3) | 0.6 |
| 5 | 5,427 | 1,739 (32.0%) | 8,164 | 3,173 (38.9%) | +6.8% | 1.3(1.3,1.4) | <.001 |
| 6 | 1,285 | 10 (0.8%) | 1,918 | 12 (0.6%) | −0.2% | 0.8 (0.4,1.8) | 0.6 |
| 7 | 2,166 | 288 (13.3%) | 3,523 | 541 (15.4%) | +2.1% | 1.2 (1.0,1.4) | 0.03 |
| 8 | 2,285 | 36 (1.6%) | 3,321 | 283 (8.5%) | +6.9% | 5.8 (4.1, 8.3) | <.001 |
| 9 | 2,061 | 28 (1.4%) | 3,317 | 216 (6.5%) | +5.2% | 5.1 (3.4, 7.5) | <.001 |
| 10 | 2,611 | 48 (1.8%) | 3,966 | 73 (1.8%) | +0.0% | 1.0 (0.7,1.4) | 0.9 |
| 11 | 3,465 | 247 (7.1%) | 5,260 | 459 (8.7%) | +1.6% | 1.2(1.1,1.5) | 0.007 |
| Transplant center volumes (DDKT/year) | |||||||
| Ql (≤22), n = 54 | 1,236 | 87 (7.0%) | 2,081 | 152 (7.3%) | +0.3% | 1.0 (0.8,1.4) | 0.8 |
| Q2 (23–46), n =55 | 4,609 | 326(7.1%) | 6,921 | 570 (8.2%) | +1.1% | 1.2 (1.0,1.4) | 0.02 |
| Q3 (47–79), n = 55 | 7,505 | 483 (6.4%) | 13,133 | 1,119 (8.5%) | +2.1% | 1.4(1.2,1.5) | <.001 |
| Q4 (≥80), n = 55 | 18,300 | 2,187 (12.0%) | 27,686 | 4,708 (17.0%) | +5.0% | 1.5 (1.4,1.6) | <.001 |
| Total | 31,650 | 3,083 (9.7%) | 49,821 | 6,549 (13.1%) | +3.4% | 1.35 (1.3,1.41) | <.001 |
DDKT: Deceased donor kidney transplantation; KAS: Kidney allocation system, VXM: Virtual crossmatch.
Figure 3.
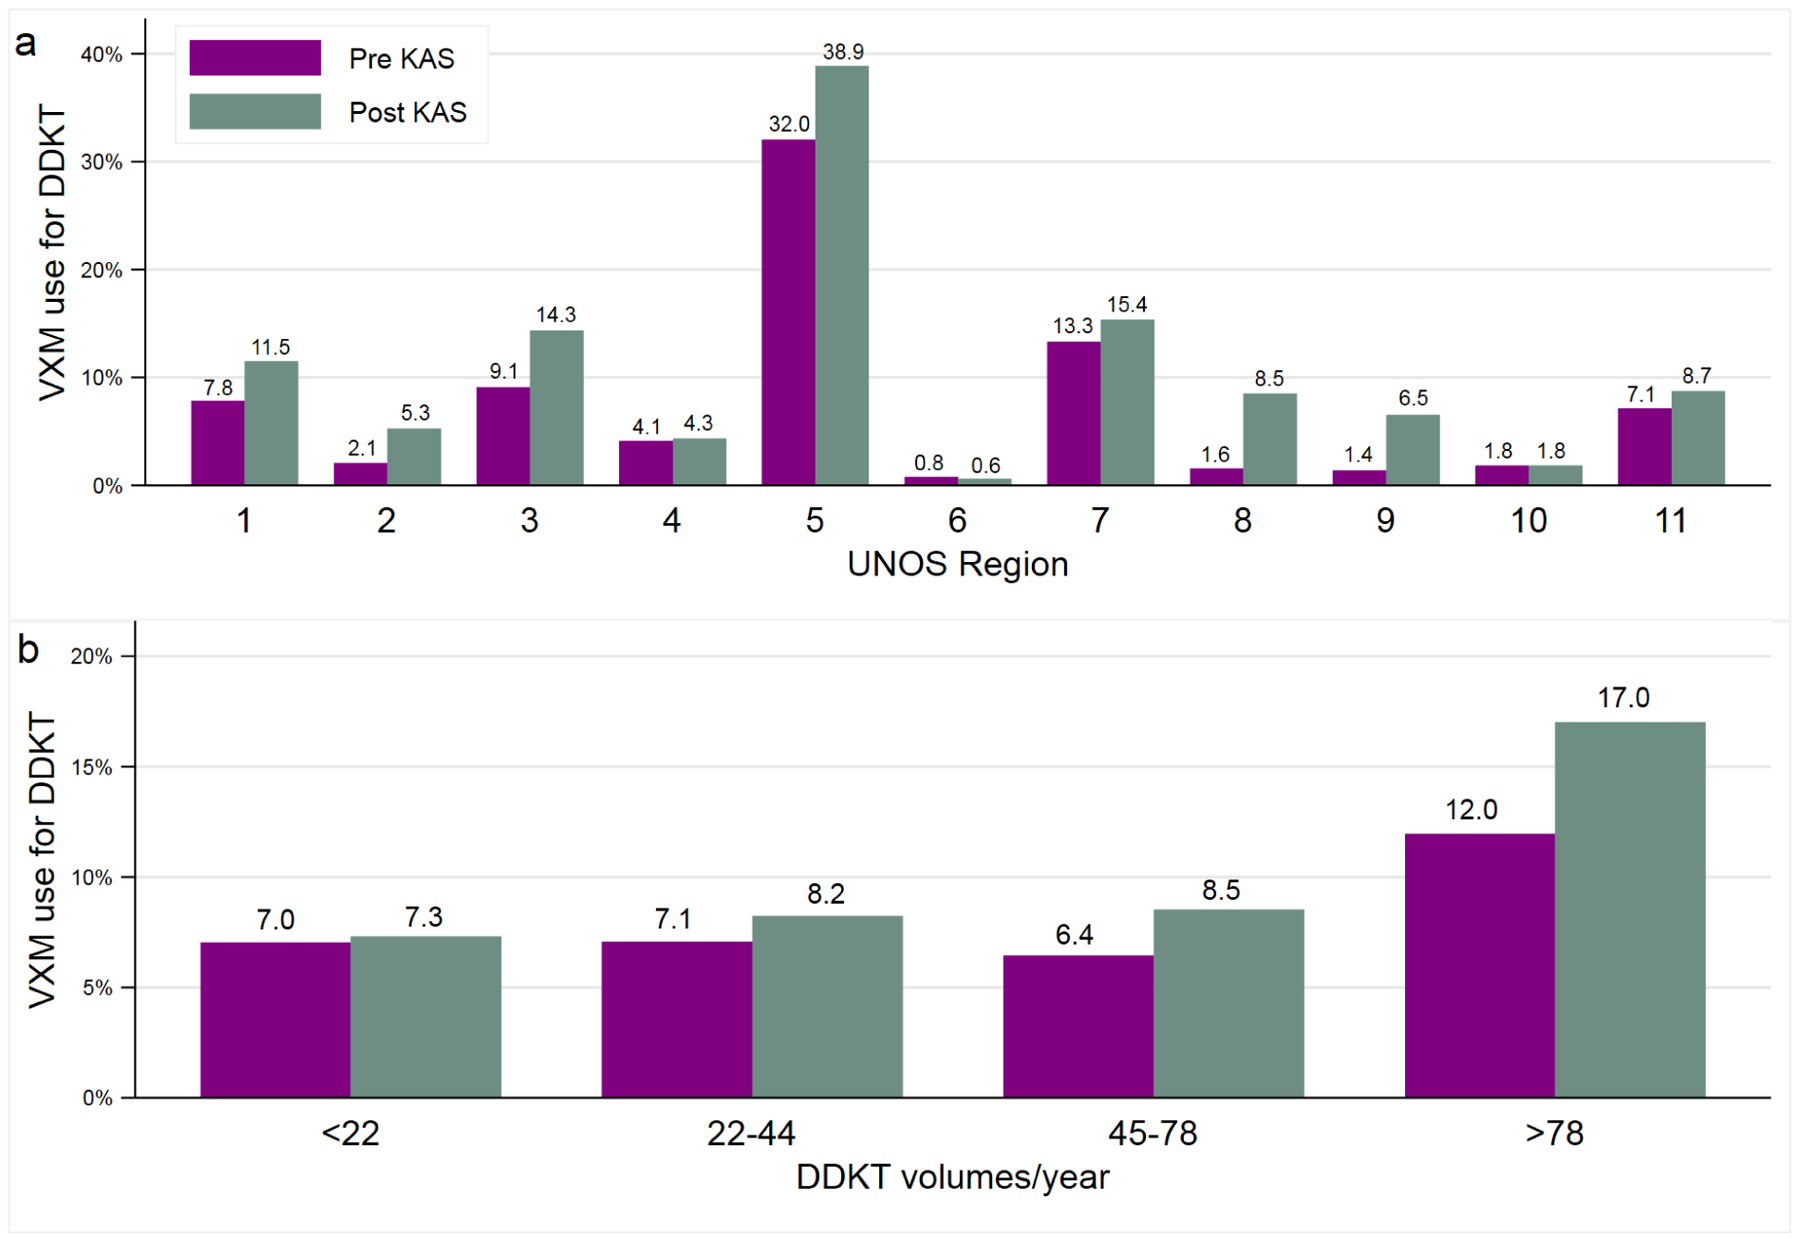
Percentage of deceased donor kidney transplants (DDKT) transplanted with virtual crossmatch (VXM) before and after the implementation of the 2014 kidney allocation system. Shown are results for the 11 United Network for Organ Sharing regions (3a) and among centers grouped based on quartiles of annual deceased donor kidney transplant volumes (3b). UNOS: United network for organ sharing; VXM: Virtual crossmatch
When centers were evaluated based on volumes, VXM use was highest among the top quartile (>80 DDKT/year), both pre-KAS (12%; 95% CI 11.4%−12.4%) and post-KAS (17%; 95% CI 16.6%−17.4%) (Table 3 and Figure 3B). Except for lowest quartile centers, all others showed an increase in VXM use post-KAS with an odds ratio for using VXM post-KAS ranging between 1.2–1.5.
VXM and clinical outcomes
Cold ischemia time:
In multivariable analysis adjusting for covariates, mean CIT was shorter for VXM compared to PXM (15.0 vs 16.5 hours; p=0.02). This was seen among both local (13.3 vs 14.5 hours) and import kidneys (20.2 vs 22.7 hours) without any differential impact (p for interaction 0.1) (Table 4). This difference in CIT was seen over the entire study period (Figure 4).
Table 4:
Differences in cold ischemia times between virtual and physical crossmatch cohorts for local and import kidneys
| Virtual XM Hours, mean (95% Cl) | Physical XM Hours, mean (95% Cl) | P Value | |
|---|---|---|---|
| Overall | 15.0(13.9,16.1) | 16.5 (15.8, 17.2) | 0.02 |
| Local kidneys | 13.3(12.2,14.4) | 14.5 (13.8, 15.1) | --# |
| Import kidneys | 20.2(18.0,22.3) | 22.7(21.6,23.8) | --# |
Model was adjusted for KDPI, biopsy, center volume, year of transplant, pre-transplant dialysis and clustering within transplant center.
Individual p values are not shown since the effect of VXM on CIT was not different for local and import organs (p value for interaction term was 0.1)
XM: Crossmatch.
Figure 4:

Differences in cold ischemia time (in hours) among virtual and physical crossmatch cohorts over the study period (2011–2018). Shown are results for kidneys from local OPO (4a) and for import kidneys (4b). Adjusted for covariates KDPI, biopsy, center volume, and clustering within transplant center. PXM: Physical crossmatch; VXM: Virtual crossmatch
Clinical events during transplant hospitalization (DGF, early rejection and early graft loss):
VXM cohort had higher risk of DGF on both unadjusted (OR 1.63, 95% CI 1.21–2.21; p=0.002) and adjusted analysis (OR 1.75, 95% CI 1.29–2.36; p<0.001) (Table 5). Incidence of rejection and graft loss during the initial transplant admission was similar among the two cohorts (Table 5). Compared to PXM, VXM had an ORs for rejection of 1.54 (95% CI 0.87–2.74; p=0.1) on unadjusted analysis and 1.66 (95% CI 0.99–2.79; p=0.06) on adjusted analysis. Graft loss during index hospitalization occurred in 1.36% (N=131) for VXM and 1.1% (N=786) for PXM with an OR of 1.26 (95% CI 0.91–1.75; p=0.2) on unadjusted analysis and 1.31 (95% CI 0.97–1.76; p=0.08) on adjusted analysis.
Table 5:
Risk comparisons for delayed graft function, early rejection, death censored graft loss and mortality in multivariable models
| Variables | Unadjusted (model 1) OR/HR (95% Cl) |
P Value | Adjusted (model 2) OR/HR (95% CI) | P Value | Adjusted (model 3) OR/HR (95% CD | P Value |
|---|---|---|---|---|---|---|
| DGF | 1.63(1.21, 2.21) | 0.002 | 1.75(1.29, 2.36) | <0.001 | -- | |
| DCGL | 0.91 (0.82, 1.01) | 0.08 | 0.99 (0.90, 1.09) | 0.8 | 0.93 (0.83, 1.04) | 0.2 |
| Mortality | 1.08 (0.98, 1.19) | 0.1 | 0.99 (0.92, 1.09) | 0.9 | 0.95 (0.86, 1.05) | 0.3 |
| Rejection (index hospitalization) | 1.54 (0.87, 2.74) | 0.1 | 1.66 (0.99, 2.79) | 0.06 | 1.38 (0.80, 2.37) | 0.2 |
| Graft loss (index hospitalization) | 1.26(0.91–1.75) | 0.2 | 1.31 (0.97, 1.76) | 0.08 | 0.98(0.71,1.33) | 0.9 |
Model 1: Unadjusted
Model 2: Adjusted for KDPI, donor gender, transplant year, import vs local kidney, use of machine perfusion, transplant center volume, recipient factors (age, gender, BMI, race, DM, ESRD etiology, pre-transplant dialysis and duration, prior KT, 0 antigen mismatch, CPRA, induction & CIT
Model 3: Adjusted for DGF in addition to covariates in Model 2.
All models were adjusted for clustering at the transplant center level.
DGF: Delayed graft function; DCGL: Death censored graft loss
Death-censored graft loss and mortality:
There was no difference in DCGL and mortality among the virtual and physical crossmatch cohorts (Figure 5). Unadjusted and adjusted HRs for DCGL were 0.91 (95% CI 0.82–1.01; p=0.08) and 0.99 (95% CI 0.90–1.09; p=0.8) respectively (Table 5). Similarly, HRs for mortality were 1.08 (95% CI 0.98–1.19; p=0.1) and 0.99 (95% CI 0.92–1.09; p=0.9) respectively (Table 5). HRs for DCGL and mortality were similar among key subgroups except for a lower HR for DCGL for VXM among import kidneys (HR 0.82; 95% CI 0.70–0.98; p=0.03) (Figure 6a) and a higher risk of death for VXM among preemptive recipients (HR 1.26; 95% CI 1.03–1.54; p=0.02) (Figure 6b).
Figure 5.

Shown are Cox survival curves for death censored graft loss and death, comparing virtual and physical crossmatch cohorts on unadjusted (figure 5a and 5c) and adjusted analysis (figure 5b and 5d). Multivariable model was adjusted for KDPI, donor gender, transplant year, import vs local kidney, use of machine perfusion, transplant center volume, recipient factors (age, gender, BMI, race, DM, ESRD etiology, pre-transplant dialysis and duration, prior KT, 0 antigen mismatch, CPRA, induction & CIT
Figure 6.


Forest plots of adjusted hazard ratios (HR) of death censored graft loss (figure 6a) and death (figure 6b) comparing virtual crossmatch with physical crossmatch for key subgroups. HRs were adjusted for covariates in model 2.
Sensitivity analyses
When VXM cohort was defined as DDKT with a retrospective PXM (i.e., excluding cohort with no PXM), the results for post-KAS trends (Figure 2B), impact on CIT (Table S3) and graft and patient outcomes (Table S4) were similar. There was increased VXM use in the post-KAS era, shorter CIT, higher DGF rates but similar graft and patient survival for VXM compared to PXM.
Paired kidney analysis:
Baseline characteristics for the 4,410 pairs are shown in Tables S5 and S6. VXM group had older recipients (56 vs 54 years), lower proportion of females (38% vs 43%), lower proportion of Black patients (26% vs 31%) and received more import kidneys (37% vs 32%). On multivariable analysis controlling for the recipient factors, machine perfusion, CIT, induction therapy and clustering at center level, the risk of DGF in the VXM remained high but attenuated (OR 1.35, 95% CI 1.05 – 1.73; p value = 0.02) (Table S7). There was no difference in DCGL (HR 0.88, 95% CI 0.73 – 1.07; p value = 0.2) and mortality (HR 0.96, 95% CI 0.82 – 1.12; p value = 0.6). (Table S8) between VXM and PXM.
In a small subset of patients (N=1727) transplanted with retrospective PXM in whom physical crossmatch results were available, retrospective PXM was reported as negative in 1,565 (91%), positive in 142(8%) and weakly positive in 10 (0.6%) patients. Compared to those that had negative retrospective PXM, DGF was higher for patients with positive PXM (44% (67/152) vs 29 % (449/1,565)) with an adjusted ORs of 1.77 (95% CI 1.23–2.54; p=0.002). (Table S8) DCGL and mortality were similar among the two groups. (Table S8)
Discussion
HLA crossmatch is a vital step prior to DDKT, and for many US transplant centers PXM remains the preferred crossmatch method. PXM however is a resource intensive process requiring staff to perform crossmatches at all times of the day and may increase CIT, particularly when samples are not available ahead of donor cross-clamp. On many occasions, multiple crossmatches may be performed at a single center for a potential donor offer which further increases costs. Finally, false positive PXM results may lead to inappropriate organ offer declines.2,3 Evolution in HLA technology has increased the ability of VXM to better predict results of a PXM thus allowing for an expansion of VXM use.24,25 Data on VXM use has been mostly limited to single center studies and whether major organ allocation changes modify VXM use is unknown.3,4,10,11,13 We report here findings from a large cohort of DDKT that show a significant increase in VXM use with implementation of KAS but with considerable regional and center level variation. We also observed shorter CIT with VXM use and similar graft and patient survival at an average follow-up of 3 years.
Increase in post-KAS VXM use is likely being driven by several factors. The increased movement of kidneys out of the donor OPO coupled with concerns about the resulting prolonged CIT is a likely key factor.19,26 This is supported by the higher proportion of import organs in the VXM cohort. High CPRA candidates have received increased number of offers post-KAS and some increase in VXM use post-KAS may reflect changes programs made to increase VXM use in this population.13,26,27 A likely spillover effect resulting in increased comfort with VXM may also explain the increased VXM use among local donors and among patients with low CPRA.13,15,26 The initial lag period post-KAS when VXM did not increase may reflect time during which programs were still adapting to allocation changes post-KAS and sudden increase in offers to patients with CPRA >98.18,27–30 Factors unrelated to KAS may also be contributing to increased VXM use. Beginning January 2016, OPTN policy requires that donor typing also include DQA1, DQB1 and DPB1.28 Improvements in accuracy and detailed donor HLA typing might have improved confidence in VXM. Additionally, improvement in assays to identify anti-HLA antibodies, and favorable outcomes reported in published studies may have increased VXM uptake among transplant programs.3,13,25
Our analysis found significant regional and center-level variation in VXM use. Some variation is likely due to varied preferences among transplant centers for VXM use.27 We found more VXM use among high volume centers. It is possible that larger programs with integrated HLA labs have well established protocols for VXM use that allow them to use VXM regularly. Additionally, high volume centers with large waiting lists receive a higher number of import organs where VXM could be particularly useful and much more cost effective. The significantly higher VXM use in region 5 may partly be related to the high proportion of large volume centers. 10 (43%) centers in region 5 were in the top tertile for volume, the highest among all regions. However, similar high VXM use was not seen in other regions with large volume centers suggesting that variation in VXM use to some extent represents center preferences. Exploring these will provide an opportunity to improve VXM utilization nationally.
A common reason cited for use of VXM is to shorten CIT. Our analysis demonstrates a clinically significant reduction in CIT of 1.5–2.5 hours with VXM that is consistent with results from other single center studies in the US as well as a national study from United Kingdom.15,16,26,31,32 VXM can be particularly useful when organs are offered late in the allocation process and potentially reduce organ discards resulting from long CIT. With the switch from donation service areas to concentric circles for kidney allocation in the US in December 2020, there is likely going to be an increase in the travel distance and accrued cold ischemia. This coupled with a dramatic increase in the number of “local” transplant centers for a given organ will create challenges to facilitate PXM at all of them. Increasing VXM adoption could alleviate some of these logistical challenges.
The higher rates of DGF in the VXM group needs further study. VXM group had kidneys that were imported more often and had higher KDPI. This increased DGF risk was attenuated but still present when we analyzed the paired kidney cohort. It is possible that our multivariable analysis was unable to fully adjust for unmeasured confounding due to the observational design of the study. Despite the higher DGF incidence, there was no major impact on graft survival, but our study is limited by the relatively short duration of follow-up, particularly for transplants from recent years. The risk with VXM mainly pertains to transplanting across a significant but unrecognized HLA antibody. The lack of increased early allograft loss and similar graft survival suggest that this risk is probably low. The increased risk of rejection (during index hospitalization) and DGF noted among the subgroup with positive retrospective crossmatches is concerning but this finding should be interpreted with caution given that crossmatch results for years 2015 and later were not available. It is possible that the false negative crossmatches have reduced over time given the expanded donor typing that includes HLA-DQ and DP (beginning in 2016). Patient and graft survival with VXM were similar to PXM among key subgroups including highly sensitized patients, suggesting that VXM can be a reasonable alternative to PXM.
Accuracy of VXM and whether VXM is sufficient to proceed to transplant is dependent on several factors including complete donor HLA typing, updated HLA antibody assessment and reliable history for sensitizing events.24,25,32–34 Challenges may arise in situations involving HLA antibodies with a low mean fluorescent intensity (MFI) or when they are allele specific. This becomes important for highly sensitized patients who may have several low-level MFI antibodies which may or may not result in a positive PXM. Even in these situations, VXM may allow for acceptance of organs less likely to have a positive PXM thus reducing late organ refusals for a positive PXM which increases CIT and organ discards.35 Additionally, while VXM could help lower CIT and crossmatch costs, it may incur other expenses owing to the need for increased frequency of HLA antibody testing and higher resolution donor typing to evaluate allele level compatibility.
An additional factor to consider is the potential to reduce transplant access to racial minorities if organs are accepted using virtual crossmatch alone. We found lower proportion of Black recipients in the VXM cohort in both pre- and post-KAS era, despite an overall increase in transplants among Black recipients post-KAS. This difference however was related to higher proportion of Asians in VXM cohort, driven mostly by region 5. When analysis was repeated after excluding region 5, there was no clinically significant racial difference in VXM use, despite the lower degree of HLA match among Asians and Blacks as evidenced by lower proportion of zero ABDR mismatched transplants. (Table S9) Similarly, while we did not find major gender-based differences in VXM use, women do have higher CPRA compared to men (Table S10) and there is a potential for lower transplant rates if virtual crossmatch alone is used for excluding organ offers.
Our study has limitations. This was a retrospective study using registry data from US only. Impact of VXM on CIT may thus be different in other countries. We also lacked information on presence of donor specific antibody (DSA), antibody mediated rejection, MFI thresholds and crossmatch interpretation at individual transplant centers. Presence of pre-transplant DSA will increase likelihood of PXM use and may thus be over-represented in the PXM cohort. Our study is unable to assess the impact of this important confounder. Our study also did not evaluate kidney function and rejection risk over time. Reliability of SRTR data for rejection however has been shown to be low.36 We defined VXM as the lack of prospective physical crossmatch and is dependent on the accuracy of data reported to UNOS. Our sensitivity analysis using a retrospective crossmatch only group also showed similar findings, thus increasing the validity of our findings.
In summary, our study found that VXM use in the US has steadily increased in the post-KAS era, but with large variation among UNOS regions and transplant centers. Compared to PXM, VXM was associated with shorter CIT and similar graft and patient survival. Strategies to further expand VXM should be explored since it could simplify logistics of HLA crossmatch in DDKT while also providing an attractive and practical solution to lower CIT and associated organ discards.
Supplementary Material
Table S1. Details on missing data for covariates in the study
Table S2. Adjusted coefficients for variables in the interrupted time series analysis evaluating change in virtual crossmatch use before and after the implementation of 2014 kidney allocation system
Table S3. Differences in cold ischemia times between virtual and physical crossmatch cohorts for local and import kidneys, when virtual crossmatch was defined as cohort with retrospective physical crossmatch only (excluding those without physical crossmatch)
Table S4. Risk comparisons for delayed graft function, early rejection, death censored graft loss and mortality in multivariable models when virtual crossmatch was defined as cohort with retrospective physical crossmatch only (excluding those without physical crossmatch)
Table S5. Donor characteristics of paired kidney transplants (N = 8820; 4410 pairs)
Table S6. Baseline transplant and recipient characteristics for paired kidney transplants
Table S7. Risk comparisons for delayed graft function, early rejection and graft loss, death censored graft loss and mortality in multivariable models for paired kidney transplants transplanted with different crossmatch strategies.
Table S8. Outcomes for virtual crossmatch cohort based on retrospective physical crossmatch results. (N=1727; data limited to transplants before 03/29/2015)
Table S9. Racial differences in calculated panel reactive antibody, zero HLA antigen mismatch and virtual crossmatch use.
Table S10. Gender differences in calculated panel reactive antibody, zero HLA antigen mismatch and virtual crossmatch use.
Acknowledgement and Data Sharing Statement
The data reported here have been supplied by the Hennepin Healthcare Research Institute (HHRI) as the contractor for the Scientific Registry of Transplant Recipients (SRTR). The interpretation and reporting of these data are the responsibility of the author(s) and in no way should be seen as an official policy of or interpretation by the SRTR or the U.S. Government.
Funding:
This work was supported by a career development award through the National Institute of Diabetes and Digestive and Kidney Diseases of the National Institutes of Health to Dr. Puttarajappa (K08DK119576).
Disclosure
All authors have completed the International Committee of Medical Journal Editors uniform disclosure form at www.icmje.org/coi_disclosure.pdf and declare the following: CP reports grants from NIH/NIDDK. SM reports grants from NIH, personal fees from Kidney International Reports, grants, and personal fees from Angion Biomedica. DJ reports current employment with Regeneron (post work on this manuscript). All other authors declare no competing interests.
Footnotes
Publisher's Disclaimer: This is a PDF file of an unedited manuscript that has been accepted for publication. As a service to our customers we are providing this early version of the manuscript. The manuscript will undergo copyediting, typesetting, and review of the resulting proof before it is published in its final form. Please note that during the production process errors may be discovered which could affect the content, and all legal disclaimers that apply to the journal pertain.
References
- 1.Patel R, Terasaki PI. Significance of the positive crossmatch test in kidney transplantation. The New England journal of medicine. 1969;280(14):735–739. [DOI] [PubMed] [Google Scholar]
- 2.Bielmann D, Honger G, Lutz D, Mihatsch MJ, Steiger J, Schaub S. Pretransplant risk assessment in renal allograft recipients using virtual crossmatching. American journal of transplantation : official journal of the American Society of Transplantation and the American Society of Transplant Surgeons. 2007;7(3):626–632. [DOI] [PubMed] [Google Scholar]
- 3.Johnson CP, Schiller JJ, Zhu YR, et al. Renal Transplantation With Final Allocation Based on the Virtual Crossmatch. American journal of transplantation : official journal of the American Society of Transplantation and the American Society of Transplant Surgeons. 2016;16(5):1503–1515. [DOI] [PubMed] [Google Scholar]
- 4.Tambur AR, Ramon DS, Kaufman DB, et al. Perception versus reality?: Virtual crossmatch--how to overcome some of the technical and logistic limitations. American journal of transplantation : official journal of the American Society of Transplantation and the American Society of Transplant Surgeons. 2009;9(8):1886–1893. [DOI] [PMC free article] [PubMed] [Google Scholar]
- 5.Sullivan HC, Dean CL, Liwski RS, et al. (F)Utility of the physical crossmatch for living donor evaluations in the age of the virtual crossmatch. Human Immunology. 2018;79(10):711–715. [DOI] [PubMed] [Google Scholar]
- 6.Eby BC, Redfield RR, Ellis TM, Leverson GE, Schenian AR, Odorico JS. Virtual HLA Crossmatching as a Means to Safely Expedite Transplantation of Imported Pancreata. Transplantation. 2016;100(5):1103–1110. [DOI] [PMC free article] [PubMed] [Google Scholar]
- 7.Liwski RS, Greenshields AL, Conrad DM, et al. Rapid optimized flow cytometric crossmatch (FCXM) assays: The Halifax and Halifaster protocols. Hum Immunol. 2018;79(1):28–38. [DOI] [PubMed] [Google Scholar]
- 8.Debout A, Foucher Y, Trebern-Launay K, et al. Each additional hour of cold ischemia time significantly increases the risk of graft failure and mortality following renal transplantation. Kidney international. 2015;87(2):343–349. [DOI] [PubMed] [Google Scholar]
- 9.Yarlagadda SG, Coca SG, Formica RN Jr., Poggio ED, Parikh CR. Association between delayed graft function and allograft and patient survival: a systematic review and meta-analysis. Nephrology, dialysis, transplantation : official publication of the European Dialysis and Transplant Association - European Renal Association. 2009;24(3):1039–1047. [DOI] [PubMed] [Google Scholar]
- 10.Bingaman AW, Murphey CL, Palma-Vargas J, Wright F. A virtual crossmatch protocol significantly increases access of highly sensitized patients to deceased donor kidney transplantation. Transplantation. 2008;86(12):1864–1868. [DOI] [PubMed] [Google Scholar]
- 11.Bray RA, Nolen JD, Larsen C, et al. Transplanting the highly sensitized patient: The emory algorithm. American journal of transplantation : official journal of the American Society of Transplantation and the American Society of Transplant Surgeons. 2006;6(10):2307–2315. [DOI] [PubMed] [Google Scholar]
- 12.Piazza A, Ozzella G, Poggi E, Caputo D, Manfreda A, Adorno D. Virtual crossmatch in kidney transplantation. Transplantation proceedings. 2014;46(7):2195–2198. [DOI] [PubMed] [Google Scholar]
- 13.Roll GR, Webber AB, Gae DH, et al. A virtual crossmatch based strategy facilitates sharing of deceased donor kidneys for highly sensitized recipients. Transplantation. 2019. [DOI] [PubMed] [Google Scholar]
- 14.Morris AB, Sullivan HC, Krummey SM, Gebel HM, Bray RA. Out with the old, in with the new: Virtual versus physical crossmatching in the modern era. Hla. 2019;94(6):471–481. [DOI] [PMC free article] [PubMed] [Google Scholar]
- 15.Rohan VS, Pilch N, Moussa O, et al. Virtual Crossmatching in Kidney Transplantation: The Wait Is Over. Journal of the American College of Surgeons. 2020;230(4):373–379. [DOI] [PubMed] [Google Scholar]
- 16.Taylor CJ, Kosmoliaptsis V, Sharples LD, et al. Ten-year experience of selective omission of the pretransplant crossmatch test in deceased donor kidney transplantation. Transplantation. 2010;89(2):185–193. [DOI] [PubMed] [Google Scholar]
- 17.King KL, Husain SA, Schold JD, et al. Major Variation across Local Transplant Centers in Probability of Kidney Transplant for Wait-Listed Patients. Journal of the American Society of Nephrology : JASN. 2020;31(12):2900–2911. [DOI] [PMC free article] [PubMed] [Google Scholar]
- 18.Stewart DE, Klassen DK. Early Experience with the New Kidney Allocation System: A Perspective from UNOS. Clinical journal of the American Society of Nephrology : CJASN. 2017;12(12):2063–2065. [DOI] [PMC free article] [PubMed] [Google Scholar]
- 19.Stewart DE, Kucheryavaya AY, Klassen DK, Turgeon NA, Formica RN, Aeder MI. Changes in Deceased Donor Kidney Transplantation One Year After KAS Implementation. American Journal of Transplantation. 2016;16(6):1834–1847. [DOI] [PubMed] [Google Scholar]
- 20.The Declaration of Istanbul on Organ Trafficking and Transplant Tourism. Clinical journal of the American Society of Nephrology : CJASN. 2008;3(5):1227–1231. [DOI] [PMC free article] [PubMed] [Google Scholar]
- 21.Organ Procurement and Transplantation Network: A guide to calculating and interpreting the kidney donor profile index. 2020; Available at: https://optn.transplant.hrsa.gov/media/1512/guide_to_calculating_interpreting_kdpi.pdf.AccessedMay 15, 2020.
- 22.United Network for Organ Sharing. Recipient Histocompatbility Worksheet. Available at: https://unos.org/wp-content/uploads/unos/Recipient_Histocompatibility.pdf.AccessedOctober 16, 2019.
- 23.Penfold RB, Zhang F. Use of interrupted time series analysis in evaluating health care quality improvements. Academic pediatrics. 2013;13(6 Suppl):S38–44. [DOI] [PubMed] [Google Scholar]
- 24.Gebel HM, Bray RA. The evolution and clinical impact of human leukocyte antigen technology. Current opinion in nephrology and hypertension. 2010;19(6):598–602. [DOI] [PubMed] [Google Scholar]
- 25.Gebel HM, Bray RA. HLA Antibody Detection With Solid Phase Assays: Great Expectations or Expectations Too Great? American Journal of Transplantation. 2014;14(9):1964–1975. [DOI] [PubMed] [Google Scholar]
- 26.Aslam S, Buggs J, Wyatt K, Kumar A, Rogers E, Watson R. The Impact of Virtual Crossmatch on Cold Ischemic Times and Outcomes Following Kidney Transplantation. The American surgeon. 2020:3134820942180. [DOI] [PubMed] [Google Scholar]
- 27.Parsons RF, Locke JE, Redfield RR 3rd, Roll GR, Levine MH. Kidney transplantation of highly sensitized recipients under the new kidney allocation system: A reflection from five different transplant centers across the United States. Hum Immunol. 2017;78(1):30–36. [DOI] [PMC free article] [PubMed] [Google Scholar]
- 28.Lunz J, Hinsdale L, King C, Pastush R, Buenvenida M, Harmon M. The coordination of allocation: Logistics of kidney organ allocation to highly sensitized patients. Hum Immunol. 2017;78(1):16–18. [DOI] [PubMed] [Google Scholar]
- 29.Kamoun M, Phelan D, Noreen H, Marcus N, Klingman L, Gebel HM. HLA compatibility assessment and management of highly sensitized patients under the new kidney allocation system (KAS): A 2016 status report from twelve HLA laboratories across the U.S. Hum Immunol. 2017;78(1):19–23. [DOI] [PubMed] [Google Scholar]
- 30.Friedewald JJ, Turgeon N. Early Experience with the New Kidney Allocation System: A Perspective from a Transplant Center. Clinical journal of the American Society of Nephrology : CJASN. 2017;12(12):2060–2062. [DOI] [PMC free article] [PubMed] [Google Scholar]
- 31.Shrestha S, Bradbury L, Boal M, et al. Logistical Factors Influencing Cold Ischemia Times in Deceased Donor Kidney Transplants. Transplantation. 2016;100(2):422–428. [DOI] [PubMed] [Google Scholar]
- 32.Pinelli DF, Tambur AR. Virtual crossmatching for deceased donor transplantation: one size does not fit all. Kidney international. 2020;97(4):659–662. [DOI] [PubMed] [Google Scholar]
- 33.Claas FHJ, Heidt S. Virtual crossmatching for deceased donor transplantation becomes reality. Kidney international. 2020;97(4):657–659. [DOI] [PubMed] [Google Scholar]
- 34.Coates PT, Wong G. Current controversies in nephrology—how to crossmatch for transplantation? Kidney international. 2020;97(4):662–663. [DOI] [PubMed] [Google Scholar]
- 35.Paramesh AS, Neidlinger N, Salvatore M, et al. OPO Strategies to Prevent Unintended Use of Kidneys Exported for High PRA (>98% cPRA) Recipients. American Journal of Transplantation. 2017;17(8):2139–2143. [DOI] [PubMed] [Google Scholar]
- 36.Potluri VS, Parikh CR, Hall IE, et al. Validating Early Post-Transplant Outcomes Reported for Recipients of Deceased Donor Kidney Transplants. Clinical journal of the American Society of Nephrology : CJASN. 2016;11(2):324–331. [DOI] [PMC free article] [PubMed] [Google Scholar]
Associated Data
This section collects any data citations, data availability statements, or supplementary materials included in this article.
Supplementary Materials
Table S1. Details on missing data for covariates in the study
Table S2. Adjusted coefficients for variables in the interrupted time series analysis evaluating change in virtual crossmatch use before and after the implementation of 2014 kidney allocation system
Table S3. Differences in cold ischemia times between virtual and physical crossmatch cohorts for local and import kidneys, when virtual crossmatch was defined as cohort with retrospective physical crossmatch only (excluding those without physical crossmatch)
Table S4. Risk comparisons for delayed graft function, early rejection, death censored graft loss and mortality in multivariable models when virtual crossmatch was defined as cohort with retrospective physical crossmatch only (excluding those without physical crossmatch)
Table S5. Donor characteristics of paired kidney transplants (N = 8820; 4410 pairs)
Table S6. Baseline transplant and recipient characteristics for paired kidney transplants
Table S7. Risk comparisons for delayed graft function, early rejection and graft loss, death censored graft loss and mortality in multivariable models for paired kidney transplants transplanted with different crossmatch strategies.
Table S8. Outcomes for virtual crossmatch cohort based on retrospective physical crossmatch results. (N=1727; data limited to transplants before 03/29/2015)
Table S9. Racial differences in calculated panel reactive antibody, zero HLA antigen mismatch and virtual crossmatch use.
Table S10. Gender differences in calculated panel reactive antibody, zero HLA antigen mismatch and virtual crossmatch use.