

Summary
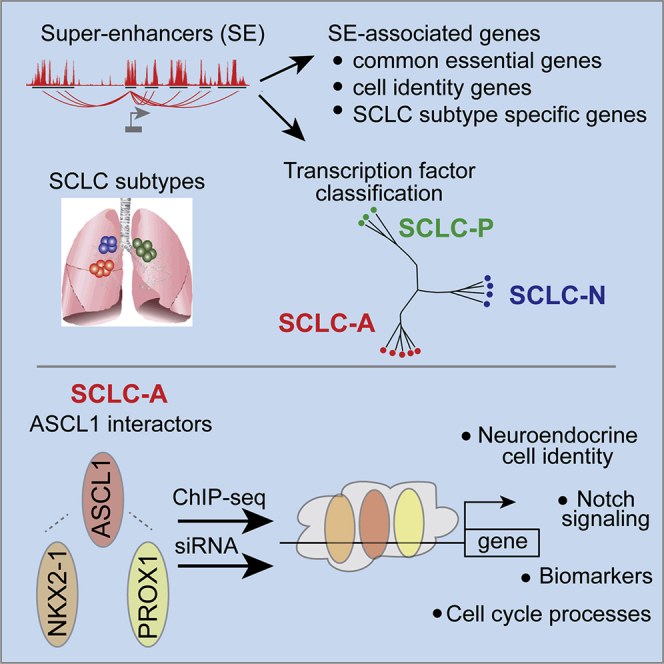
Lineage-defining transcription factors (LTFs) play key roles in small-cell lung cancer (SCLC) pathophysiology. Delineating the LTF-regulated genes operative in SCLC could provide a road map to identify SCLC dependencies. We integrated chromatin landscape and transcriptome analyses of patient-derived SCLC preclinical models to identify super-enhancers (SEs) and their associated genes in the ASCL1-, NEUROD1-, and POU2F3-high SCLC subtypes. We find SE signatures predict LTF-based classification of SCLC, and the SE-associated genes are enriched with those defined as common essential genes in DepMap. In addition, in ASCL1-high SCLC, we show ASCL1 complexes with NKX2-1 and PROX1 to co-regulate genes functioning in NOTCH signaling, catecholamine biosynthesis, and cell-cycle processes. Depletion of ASCL1 demonstrates it is a key dependency factor in preclinical SCLC models and directly regulates multiple DepMap-defined essential genes. We provide LTF/SE-based subtype-specific gene sets for SCLC for further therapeutic investigation.
Subject areas: molecular biology, bioinformatics, cancer systems biology
Graphical abstract
Highlights
-
•
Super-enhancers support lineage-defining transcription factor SCLC classification
-
•
SCLC super-enhancer-associated genes represent essential and lineage-identity genes
-
•
ASCL1, NKX2-1, and PROX1 proteins interact in a complex in SCLC-A
-
•
ASCL1, NKX2-1, and PROX1 regulate Notch-signaling, NE-specific, and cell-cycle genes
Molecular biology; Bioinformatics; Cancer systems biology
Introduction
Small-cell lung cancer (SCLC) is an aggressive and incurable form of lung cancer labeled as a recalcitrant cancer by the NCI and US Congress (Gazdar et al., 2017). Patients exhibit dramatic responses to initial platin doublet chemotherapy, but in nearly all cases, SCLCs become resistant to this treatment with tumor recurrence (Rudin et al., 2015). Despite extensive genomic analyses of SCLC tumors, which identified the near ubiquitous inactivation of tumor suppressors TP53 and RB1, and frequent co-occurring high expression of the MYC family members (MYCL, MYCN, or MYC), no effective therapeutic vulnerabilities (such as mutant EGFR found in some lung adenocarcinomas) have been identified (Gazdar et al., 2017; George et al., 2015; Peifer et al., 2012). Inter-tumor heterogeneity has been identified for SCLC and expression of lineage-defining transcription factors (LTFs, such as ASCL1, NEUROD1, and POU2F2) appear to play a major role in this heterogeneity (Rudin et al., 2019). The majority of SCLC expresses the LTFs ASCL1 and/or NEUROD1 and also expresses a panel of neuroendocrine genes (Gazdar et al., 2017). In addition, ASCL1 and NEUROD1 drive distinct oncogenic programs (and are referred to as “lineage oncogenes”), thereby conferring different molecular and physiological properties to ASCL1-and NEUROD1-containing SCLC (Borromeo et al., 2016; Gazdar et al., 2017; Mollaoglu et al., 2017; Osborne et al., 2013). Subsets of SCLC (∼10-15-%) do not express neuroendocrine markers (and are referred to as non-neuroendocrine SCLCs) and are dependent on other LTFs such as POU2F3 (Huang et al., 2018). These findings led to a classification where expression of different LTFs define molecular SCLC subtypes, i.e., SCLC-A, SCLC-N, SCLC-P and SCLC-Y, where A, N, P, and Y stand for ASCL1, NEUROD1, POU2F3, and YAP1, respectively (Rudin et al., 2019). While separating tumors of patients with SCLC into molecular subtypes provides a biologic classification and may provide information for individual patient selection of currently available therapies, an important question is whether a better understanding of the mechanism(s) these LTFs play in the pathogenesis of SCLC would provide a path to identifying SCLC vulnerabilities and new therapeutic targets.
The ASCL1-expressing SCLCs, SCLC-A, are the predominant SCLC LTF subtype (Gazdar et al., 2017; George et al., 2015). ASCL1 is a basic-helix-loop-helix TF and belongs to a network of TFs that regulate the expression of genes supporting SCLC growth and survival (Borromeo et al., 2016). During development, ASCL1 is essential for the differentiation of pulmonary neuroendocrine cells (PNECs) (Borges et al., 1997; Ito et al., 2000; Sui et al., 2018), a cell lineage from which most SCLC are thought to originate (Park et al., 2011; Sutherland et al., 2011). Inactivation of TP53 and RB1 in PNECs or their progenitors appear to be initiating events for SCLC (Meuwissen et al., 2003; Olsen et al., 2021; Schaffer et al., 2010). PNECs are rare neuroendocrine cells and are found either in isolation or as small clusters of 20–30 cells at bronchial branch points (Linnoila, 2006). They represent only ∼1% of the adult lung epithelium, and in diseases such as asthma, and in smokers, PNEC numbers can increase (Sui et al., 2018). PNECs function in oxygen sensing, modulation of immune response, and the repair of damaged lung epithelium upon airway damage (Garg et al., 2019; Li and Linnoila, 2012). A small subpopulation of PNECs can divide to repair the damaged epithelium via a Notch-dependent mechanism and return to quiescence following RB1/TP53 activation, and dysfunctions in this process may underlie SCLC tumorigenesis (Li and Linnoila, 2012; Ouadah et al., 2019). Consistently, ASCL1 is expressed in PNECs and in SCLC tumors where it commands the expression of neuroendocrine lineage genes such as CHGA, CALCB, INSM1, and genes underlying SCLC progression such as RET, and NOTCH-signaling pathway genes (Borromeo et al., 2016). Genetic deletion of Ascl1 in mouse models precludes PNEC formation (Borges et al., 1997; Ito et al., 2000), and importantly, deletion of Ascl1 in a genetically engineered mouse model (GEMM) of SCLC prevents SCLC tumorigenesis (Borromeo et al., 2016). Thus, ASCL1 is a potential therapeutic target for SCLC. Despite its central importance in SCLC tumorigenesis, mechanisms controlling ASCL1 transcriptional activity in SCLC and the downstream oncogenic program that ASCL1 controls need to be fully characterized to provide therapeutically relevant information.
Deregulation of transcriptional activity and downstream gene expression underlies cancer formation and development (Lee and Young, 2013). Core lineage-driving TFs such as ASCL1 regulate the expression of lineage-specific genes, in part by cooperating with co-factors, and are often found enriched at transcriptionally active genomic regions called super-enhancers (SEs). These regions contain abundant TF binding sites, transcriptional molecular machinery, and can be identified using the epigenetic mark H3K27 acetylation (H3K27ac) (Hnisz et al., 2013; Whyte et al., 2013). In cancer cells, SEs are associated with oncogene expression (Hnisz et al., 2013; Mansour et al., 2014; Northcott et al., 2014; Tang et al., 2020; Vaharautio and Taipale, 2014), and targeting SE components, such as BRD4 and CDK7, inhibits cancer progression (Chipumuro et al., 2014; Christensen et al., 2014; Loven et al., 2013). Thus, identifying SEs across SCLC subtypes provides key information on cooperating TF networks and their tumor-specific gene expression programs (Saint-Andre et al., 2016). SE information also helps identify subtype-specific origins and vulnerabilities as demonstrated in medulloblastoma (Lin et al., 2016). Indeed, ASCL1, NEUROD1, and POU2F3, and their respective downstream targets, are associated with SE in some patient-derived SCLC lines (Borromeo et al., 2016; Christensen et al., 2014; Huang et al., 2018).
Here, we identify subtype-specific features of SCLC with the twin goals of delving deeper into SCLC biology and providing candidate factors for SCLC therapeutic targeting (Cardnell et al., 2017; Mollaoglu et al., 2017). Furthermore, to address how ASCL1 and other TFs cooperate to support SCLC survival and growth, we focused on the SCLC-A subtype, identifying ASCL1 co-factors in SCLC. We identify a physically interacting network of TFs that includes ASCL1, NKX2-1, and PROX1 and show that they co-regulate shared transcriptional targets in SCLC-A that regulate Notch-signaling and neuroendocrine identity, with NKX2-1 targets also enriched at cell-cycle genes.
Results
SE identification in SCLC cell lines and PDXs using ChIP-seq supports SCLC molecular subtype classifications SCLC-A, SCLC-N, and SCLC-P
Tumor-promoting genes are associated with H3K27ac-rich genomic regions computationally defined as SEs (Hnisz et al., 2013; Whyte et al., 2013), and lineage oncogenes such as ASCL1 and NEUROD1 are found associated with SEs in some patient-derived SCLC lines (Borromeo et al., 2016; Christensen et al., 2014). To investigate whether SEs across many preclinical models of SCLC would support the recently proposed molecular classification for SCLC and identify candidates for tumor vulnerabilities (Rudin et al., 2019), we interrogated a panel of SCLC lines and multiple patient-derived xenografts (PDXs) representing SCLC subtypes in this classification, SCLC-A (N = 11), SCLC-N (N = 6), and SCLC-P/Y (N = 5) (Figure 1A) with H3K27ac chromatin immunoprecipitation followed by sequencing (ChIP-seq) (Table S1). SEs were defined computationally (Whyte et al., 2013), and unbiased clustering of these SEs, SEs from other studies including 4 non-small-cell lung carcinoma (NSCLC) lines, and one human broncho-epithelial cell line (HBEC) revealed that the human SCLC preclinical models distributed into 3 distinct SCLC SE clusters (Figures 1B and 1C). These SE clusters correlate with ASCL1 (11/11), NEUROD1 (6/6), and POU2F3 (4/5) expression providing further definition of the SCLC-A, SCLC-N, and SCLC-P subtypes. One SCLC-Y subtype was included in the analysis, DMS114, that expresses YAP1 but not the other LTFs, is low neuroendocrine, and was previously clustered with the SCLC-P subtype by unsupervised clustering analysis of the global H3K27ac enrichment pattern (Huang et al., 2018).
Figure 1.

Identification of SEs in SCLC cell lines and PDXs support SCLC molecular subtype classifications SCLC-A, SCLC-N, and SCLC-P
(A) Heatmap from RNA-seq showing ASCL1, NEUROD1, POU2F3, and YAP1 gene expression in the SCLC cell lines and PDXs used in this study.
(B and C) Unbiased cluster analysis (B, heatmap) and (C, dendrogram) shows that the SEs can be used to classify SCLC cell lines and PDXs into the same subtypes recently proposed (Rudin et al., 2019).
(D) VENN diagram representing the number of SEs unique to or shared between SCLC subtypes. For an SE to be included in the analysis, it had to be present in 6 of the 11 SCLC-A, 4 of the 6 SCLC-N, or 3 of the 5 SCLC-P samples (includes DMS114).
(E) Representative genome tracks showing the H3K27ac ChIP-seq signal around ASCL1, NEUROD1, and POU2F3. The bar above the track indicates regions computationally defined as SEs. Data from SCLC cell lines are color-coded; SCLC-A (red), SCLC-N (blue), SCLC-P (green). Asterisks for LX22, LX44, LX48, and LX110 indicate they are PDX not cell lines. All other samples are cell lines.
Also see Table S1.
We generated signature SE lists for each SCLC subtype, SCLC-A, SCLC-N, and SCLC-P, by including SEs found in the majority of samples from a given SCLC subtype. This resulted in 432 SCLC-A, 199 SCLC-N, and 236 SCLC-P SEs (Figure 1D). Within the SCLC-A subtype, 57% of the SEs are restricted to SCLC-A, whereas ∼28% are shared with either SCLC-N or SCLC-P, with 13% shared between all three subtypes. These findings are consistent with common gene expression features across SCLC subtypes but highlight significant differences in chromatin landscape between the SCLC subtypes (Figure 1D). ASCL1, NEUROD1, and POU2F3, in addition to their characteristic expression defining SCLC subtypes, are also associated with SEs found only in that subtype, with H3K27ac enrichment across the entire gene bodies of ASCL1 and NEUROD1 (Figure 1E). These results show that the SCLC subtypes, defined by LTFs, also have distinct chromatin landscapes that can be detected through H3K27ac enrichment and SE analysis.
3D chromatin conformation using HiChIP identifies SCLC-A and SCLC-N subtype SE-associated genes
SE-associated genes are enriched in cell identity and disease relevant genes (Hnisz et al., 2013; Vaharautio and Taipale, 2014; Whyte et al., 2013), and thus, are candidates for playing important functions in SCLC pathogenesis. To add precision to identification of SE-associated genes in the SCLC-A and the SCLC-N subtypes, we combined the H3K27ac ChIP-seq SE analysis with data from a 3D chromatin conformation assay, HiChIP. HiChIP is a protein-centric chromatin conformation method that identifies genes whose transcription start sites are found in proximity to distant chromatin regions even if this distance is hundreds of kb away along the chromosome (Mumbach et al., 2016). Thus, while the SEs represent transcriptionally active chromatin regions, the HiChIP identifies chromatin loops that connect these SEs to their target genes. Using the work-flow shown in Figure 2A, that also incorporates RNA-seq from SCLC preclinical models to determine what genes are expressed, we identified SE-associated genes for SCLC-A and SCLC-N (Table S1). Because we do not have HiChIP data for SCLC-P, the SCLC-P SE-associated genes are those predicted using GREAT algorithms that largely represent SE neighboring genes (McLean et al., 2010). The SE-associated genes identified include the LTFs, ASCL1, NEUROD1, and POU2F3 themselves (Figure 1E), as well as other TFs, many of which have been associated with important processes in SCLC such as INSM1, NFIB, FOXA2, and MYC (Borromeo et al., 2016; Christensen et al., 2014; Denny et al., 2016; Fujino et al., 2015; George et al., 2015; Huang et al., 2018; Ireland et al., 2020; Johnson et al., 1987; Khoor et al., 2004; Mollaoglu et al., 2017; Osborne et al., 2014; Semenova et al., 2016; Zhang et al., 2018) (Figure 2B).
Figure 2.

Identification of SE-associated genes in SCLC subtypes
(A) The workflow used to identify expressed SE-associated genes including H3K27ac ChIP-seq, HiChIP, and RNA-seq.
(B) Visualization of the H3K27ac ChIP-seq signal in a representative SCLC cell line from each subtype showing those that meet the SE criteria. Some TF encoding genes associated with the SEs are highlighted for comparison. NKX2-1 and NFIB are in gray because in the particular cell line shown, they just missed the stringent criteria used.
(C) Human genome tracks showing the H3K27ac signal and HiChIP data associated with representative SE-associated genes shared and distinct across the cell lines. The black bars under the tracks indicate a region identified as an SE.
(D) Venn diagram showing the number of SE-associated genes that are unique to or shared between the 3 SCLC subtypes. Total number of SE-associated genes is indicated. For an SE to be included in the analysis, it had to be present in 6 of the 11 SCLC-A, 4 of the 6 SCLC-N, or 3 of the 5 SCLC-P samples. An expression cut off of 5 FPKM in at least one relevant cell line was used as an expression filter. Data from SCLC cell lines are color-coded; SCLC-A (red), SCLC-N (blue), and SCLC-P (green).
See also Table S1.
Analyses of the identified SE-associated genes for the different SCLC subtypes revealed many distinct and shared features across the SCLC subtypes, as well as genes involved in diverse rather than specific biological processes. SE-associated genes do include many LTF reported in the different SCLC subtypes (Figure 1B). SE-associated genes totaling 997 across the three SCLC subtypes were defined of which 795 are in SCLC-A, 408 in SCLC-N, and 423 in SCLC-P. Among these genes, 405 (51%), 121 (30%), and 196 (46%) were restricted to the SCLC-A, -N, -P subtypes, respectively, whereas 112 (14–27%) were shared across the 3 subtypes (Figure 2D, Table S1). Representative genome browser tracks show regulatory elements defined by the H3K27ac ChIP-seq signal, as well as the chromatin loops identified from the HiChIP data that associate a gene with the SE (Figure 2C). Here, we highlight genes uniquely identified such as IGFBP5 in SCLC-A, MYC in SCLC-N, and ASCL2 in SCLC-P, and those shared such as INSM1 in SCLC-A and SCLC-N, or ID2 in all 3 subtypes (Figure 2C). Although SE-associated gene sets comprise some genes associated with important processes in SCLC as pointed out above, GO (Gene Ontology) analysis did not show enrichment of any particular pathway or process but instead indicates SE-associated genes represent diverse biological processes.
We next explored whether the SE-associated gene sets were enriched for genes showing dependencies in cancer cell lines or oncogenes. Leveraging a database of cancer dependencies generated by CRISPR knockout (KO) and siRNA screening of cancer cell lines (DepMap) (DepMap, 2020; Tsherniak et al., 2017) we found ∼20% of the SCLC SE-associated genes are defined as common essential genes (compared to 12% defined across all genes) (Table S1). Furthermore, over a quarter (26%) of the 112 SE-associated genes shared between SCLC-A, SCLC-N, and SCLC-P are common essential genes highlighting the high rate of essentiality of the SE-associated genes. Notably, searching the DepMap for subtype-specific dependencies revealed ASCL1 and FOXA2 as robust SCLC-A-specific dependencies (Table S1). Next, we used the Cosmic database (cancer.sanger.ac.uk/cosmic) to identify oncogenes within the SE-associated gene sets. Here, MLLT10 and SRSF2 were identified across all three subtypes, MYC specifically in SCLC-N, and MDM4, IDH2, and HOXC11 specifically in SCLC-P. The SCLC-A specific SE-associated gene set contained the most oncogenes including BCL2, FOXA1, SOX2, SIX1, JUN, MSI2, HOXD11, MDM2, BCL2L12, and CXCR4 (Table S1). Overall, the SE-associated gene sets provide differences and commonalities between the SCLC subtypes and provide a resource for systematic determination of potential therapeutic vulnerabilities for each SCLC subtype.
PROX1 and NKX2-1 are identified in a transcriptional complex with ASCL1 and share binding profiles in the genomes of SCLC-A cell lines
The ASCL1 gene is associated with SEs in SCLC (Figure 1E), and the ASCL1 protein itself is also enriched at SEs (Borromeo et al., 2016). In addition, there is substantial evidence supporting a key requirement for ASCL1 in promoting the survival and growth of SCLC (Augustyn et al., 2014; Borges et al., 1997; Borromeo et al., 2016; Jiang et al., 2009; Olsen et al., 2021). To understand how ASCL1 transcriptional activity is regulated in SE regions, we set out to identify other TFs that may be found together in a complex with ASCL1 in SCLC cells. ASCL1 was immunopurified from nuclear extracts of NCI-H2107 cells, and the purified proteins were analyzed by mass spectrometry. It is known that ASCL1 heterodimerizes with class I bHLH factors called E-proteins, encoded by the genes TCF3, TCF4, and TCF12, for efficient DNA binding and transcriptional activity (Guillemot and Hassan, 2017). Validation of our approach came when we identified the known ASCL1 E-protein heterodimeric partners TCF3 (previously E12/E47), TCF4 (previously E2-2), and TCF12 (previously HEB), within the 271 proteins detected in the immunoprecipitates (Figure 3A, Table S2). Of the 271 proteins identified, 52 were encoded by SE-associated genes in SCLC-A including transcription-related factors such as NKX2-1, PROX1, TRIM28, TCF12, CBX3, CBX5, and SMARCC2. We chose to focus on two homeodomain-containing TFs, NKX2-1 (also known as TTF1) and PROX1, due to their regulatory roles in epithelial lung cell biology, and thus possible relevance to SCLC-A pathogenesis, although the other proteins in the immunoprecipitates serve as additional candidates for ASCL1 interacting factors (Table S2). NKX2-1 is highly expressed in thyroid cancer and SCLC (Yamaguchi et al., 2013), whereas PROX1 plays an oncogenic role in different cancers including SCLC (Zhu et al., 2013). To validate the mass spectrometry-identified ASCL1/NKX2-1 and ASCL1/PROX1 interactions, ASCL1 was immunoprecipitated from three SCLC-A models including NCI-H2107, NCI-H889, and NCI-H345, and two SCLC-N models NCI-H524 and NCI-H2171 as negative controls, and surveyed by immunoblotting (Figures 3B and S1). In all three SCLC-A models, NKX2-1 and PROX1 were found in the ASCL1 immune pellet. Surveying RNA expression of NKX2-1 and PROX1 across SCLC tumors (George et al., 2015) and SCLC lines (Augustyn et al., 2014), we found both factors are consistently expressed in SCLC (Figure 3C). In addition, NKX2-1 expression was enriched in SCLC-A subtypes while PROX1 was more broadly found across the SCLC subtypes. These results indicate that NKX2-1 and PROX1 can be present in a complex with ASCL1 and raise the question whether these three factors might act together to regulate the pathogenesis of SCLC-A.
Figure 3.

PROX1 and NKX2-1 co-immunoprecipitate with ASCL1 and have overlapping binding profiles in the genomes of SCLC-A cell lines
(A) Proteins identified by mass spectroscopy of ASCL1 immunoprecipitates from NCI-H2107 cells shown ranked by spectral index. ASCL1 and its E-protein cofactors TCF3, TCF4, and TCF12 are shown, as are NKX2-1 and PROX1. See Table S2 for a complete list of proteins identified.
(B) Immunoblots showing PROX1 and NKX2-1 co-immunoprecipitate with ASCL1 from NCI-H2107, NCI-H889, and NCI-H345 cells. White lines indicate non-informative lanes and regions omitted from the originating blots. The SCLC-N cell lines NCI-H524 and NCI-H2171 do not express ASCL1 and were used as negative controls. Input is the nuclear fraction from NCI-H2107. Western blots of lysates showing the presence of each TF in the cell lines used are shown in Figure S1.
(C) RNA-seq (log2 FPKM) showing expression of ASCL1, NKX2-1, and PROX1, in SCLC tumors (T) or cell lines (C) in the specified SCLC subtype or NSCLC. The line indicates the mean and the asterisks indicate p values for each sample compared with SCLC-A tumors. ∗p < 0.05, ∗∗p < 0.01, ∗∗∗∗p < 0.0001.
(D and E) (D) ChIP-seq heatmap and (E) Venn diagram for ASCL1, PROX1 and NKX2.1 peaks identified in at least 2 of 3 SCLC-A cell lines (NCI-H2107, NCI-H128, and NCI-H889) identifies unique and shared genomic binding sites. See Table S3 for peak coordinates and Table S4 for TF-binding associated genes.
(F) Top de novo motifs identified by HOMER in ChIP-seq peak regions. The text indicates the motif enriched, the factor family predicted to bind the motif, the percent incidence of the motif in ChIP-seq peak regions, and the p value significance of the specified motif.
To gain insight into whether ASCL1, PROX1, and NKX2-1 co-regulate a set of genes, we mapped their binding sites by ChIP-seq in 3 SCLC-A cell lines, NCI-H2107, NCI-H889, and NCI-H128. Overall, 1,048 genomic sites were bound by all three factors (Figures 3D and 3E) (Tables S3 and S4). The co-enrichment for binding motifs for the 3 TFs also supports substantial overlap in genomic regions bound. HOMER was used to identify the top de novo motifs within the ChIP-seq peaks (Heinz et al., 2010). The motifs known for ASCL1 and NKX2-1 were found enriched in their respective ChIP-seq data with 94% of ASCL1 ChIP-seq peaks containing the bHLH motif, and 60% of NKX2-1 ChIP-seq peaks containing a motif most similar to the related factor NKX2-5 (Figure 3F), consistent with these factors directly binding specific DNA sequences. In contrast, PROX1 ChIP-seq peaks were enriched for a FOXA2 motif (33%), a bHLH motif (41%), and an NKX2-1 motif (41%), a finding more consistent with PROX1 being recruited as a non-DNA binding co-factor to these sites. In ChIP-seq-bound regions shared by all three factors, or ASCL1 and either of the other two factors, the most enriched de novo binding motif is the bHLH (79–90%) (Figure 3F), and the NKX2-1/5 and FOXA2 motifs are found within 24–34% of these shared sites. The presence of the FOXA2 motif suggests that FOXA2 might form a DNA-protein complex with ASCL1, PROX1, and/or NKX2-1; however, FOXA2 did not co-immunoprecipitate with these TFs in lysates from NCI-H2107 cells (data not shown). Overall the de novo motif analysis is consistent with the existence of ASCL1/PROX1, ASCL1/NKX2-1, and ASCL1/NKX2-1/PROX1 containing DNA-protein complexes in SCLC-A cells.
Cross-regulatory relationships between ASCL1, PROX1, and NKX2-1
ASCL1, PROX1, and NKX2-1 are associated with SEs in SCLC-A cells (Figure 2B). In addition, ChIP-seq demonstrates that each factor binds to regions surrounding its own gene and to the genes encoding the other factors (Figure 4A), setting up the possibility for auto- and cross-regulatory relationships between these TFs in SCLC-A. To investigate functional dependencies between ASCL1, PROX1, and NKX2-1, each TF was knocked down individually or in combination in SCLC-A cell line models using siRNAs. Immunoblots probing protein levels of each factor were used to assess the functional dependencies between factors in NCI-H2107 (Figure 4B). These experiments were repeated in NCI-H2107, NCI-H889, and NCI-H345 using quantitative RT-PCR to assess the functional dependencies between factors (Figure S1). In NCI-H2107, we found that knockdown of NKX2-1 led to decreases in ASCL1 and PROX1, knockdown of ASCL1 led to decreased PROX1, and knockdown of PROX1 led to a modest decrease in ASCL1 (Figure 4B’ and 4D). Similarly, the dependencies between factors largely replicates in NCI-H345. However, in NCI-H889 the relationship between NKX2-1 and ASCL1 is different. In this SCLC-A model, ASCL1 appears to have a repressive effect on NKX2-1 expression (Figure S1). Thus, although these findings support potential cross-regulatory relationships between the factors, the robustness of the cross-regulation is not predictable from the ChIP-seq data (Figure 4A), and even within SCLC-A models, the cross-dependencies are cell line-dependent.
Figure 4.

Cross-regulatory relationships between ASCL1, PROX1, and NKX2-1
(A) UCSC Genome Browser tracks showing ASCL1, NKX2-1, PROX1 and H3K27ac ChIP-seq signals in NCI-H2107 cells around the genes encoding ASCL1, NKX2-1, and PROX1. Black bars above the tracks indicate computationally called binding sites.
(B, B′, and C) (B) Immunoblots and (B′) quantification to assess protein levels, and (C) WST-1 assay for cell viability after siRNA-mediated knock-down of ASCL1, PROX1, and NKX2-1 individually or in combination in NCI-H2107 cells harvested at 72 hr post-transfection. Each data point represents a biological replicate, error bars indicate SEM. ANOVA with Bonferroni's multiple comparisons test was used to determine significant differences relative to siControl, p values (∗∗p < 0.01, ∗∗∗p < 0.001, ∗∗∗∗p < 0.0001, ns = not significant).
(D) Diagram summarizing functional dependencies between the three factors.
(E) GSEA generated enrichment plot showing normalized enrichment scores (scale 1–2) for significantly enriched gene sets (FDR ≤ 0.05) using genes activated by ASCL1 or the 3TF in NCI-H2107 as determined by DEGs from the siRNA knockdown experiments. Heatmap illustrates genes activated by ASCL1 are enriched in gene sets involved in NOTCH signaling (green) and cell-cycle (blue) but also include transporters and ion channels (red). The 3 TF knock-down further alters cell-cycle related genes. Black circles indicate processes not listed.
See also Table S5 for the detailed list of DEG genes and pathway analysis and Figure S1.
A role for ASCL1 in maintaining normal growth levels in SCLC-A cell lines has been reported. To test whether the interacting TFs ASCL1, NKX2-1, and PROX1 work together to direct SCLC-A-specific gene expression needed to maintain cell growth, we assayed cell viability after siRNA knockdown of these TFs individually or in combination. Confirming previous findings, a decrease of ASCL1 in NCI-H2107 cells reduced viability by ∼50%. Knockdown of NKX2-1 or PROX1 had more modest effects (20–25%) (Figure 4C). Importantly, combined knockdown of two or more of these TFs did not enhance the decrease in NCI-H2107 cell viability over ASCL1 knockdown alone. Furthermore, no significant decrease in viability was detected with any of these TFs individually or in combination in NCI-H345 and NCI-H889, although inefficient knockdown relative to that obtained in NCI-H2107 cells is a caveat in these experiments (Figure S1). The dependency on ASCL1 for cell viability in NCI-H2107 is consistent with results from DepMap that show ASCL1, but not NKX2-1 or PROX1, is important specifically for SCLC-A in 5 of the 6 ASCL1 expressing SCLC tested (NCI-H209, NCI-H2092, CORL47, SHP77, and DMS53) and not the other SCLC subtypes or NSCLC (Table S1). The lack of synergy or additivity in the requirement for these factors for cell viability suggests more complex combinatorial roles in controlling gene expression for these TFs in SCLC. Indeed, the modest effect on viability in NCI-H2107 with knockdown of NKX2-1 and PROX1 could reflect their role in supporting ASCL1 expression (Figure 4D).
Identification of downstream targets of the ASCL1/NKX2-1/PROX1 TF network
To discover genes regulated by ASCL1 versus those co-regulated by the three TFs (ASCL1/NKX2-1/PROX1) (3TF) together, we performed RNA-seq from the knock-down experiments in NCI-H2107 cells with control siRNA, siASCL1, and the combination siASCL1; siNKX2-1; siPROX1 (n = 2 for each) assayed at 72 hr after transfection. Differential gene expression (DEG) was determined relative to control siRNA samples (Table S5). A heatmap of the enrichment plot from Gene Set Enrichment Analysis (GSEA) shows normalized enrichment scores for significantly enriched gene sets using genes activated by ASCL1 or the 3TF in NCI-H2107 as detected by DEGs from the siRNA knockdown experiments (Figure 4E). Consistent with known functions of ASCL1 in regulating NOTCH pathway genes, the DEGs reflecting activation by ASCL1 are enriched in multiple NOTCH related pathways as defined in the REACTOME. These were not changed with combinatorial depletion of the co-factors NKX2-1 and PROX1. ASCL1 also activates transporter, ion channel, and glycosylation-related genes, but enrichment of these categories was modulated by the additional loss of NKX2-1 and PROX1. Notably, although ASCL1 alone regulates cell-cycle-related genes, NKX2-1 and PROX1 enhance this activity resulting in a robust enrichment in cell-cycle-related processes when the 3 TFs were knocked down in combination. In contrast, TF repressed genes were not enriched in any specific pathway. Notably, SOX9 is significantly induced with loss of ASCL1 in the SCLC-A cell lines, consistent with results in mouse models of SCLC lacking ASCL1 (Olsen et al., 2021) (See Table S5 for the detailed list of DEG genes and pathway analysis).
The overlap in binding of ASCL1, NKX2-1, and PROX1 TFs in the SCLC-A genome suggests they may directly regulate a shared set of genes in these cancer cells. To identify the factor-specific and shared direct transcriptional targets, we identified the genes associated with each TF ChIP-seq peak leveraging the SCLC-A HiChIP data to refine our analysis, thereby allowing identification of distal TF regions found in proximity to transcription start sites. We find that 95% of the ASCL1-associated target genes are shared with those identified for NKX2-1 (Figures 5A and 5B and Table S4). A third of these are also shared with PROX1-associated targets, totaling 1011 genes associated with genomic regions bound by all three TFs. Because TF binding alone does not always indicate a functional transcriptional relationship, we used the DEG from the siRNA knockdown experiments to define direct transcriptional targets of ASCL1 or ASCL1/NKX2-1/PROX1 complexes. Focusing first on ASCL1 downstream targets (Figures 5C), 295 genes are both associated with ASCL1 ChIP-seq binding and were differentially regulated by knock down of ASCL1. Significantly enriched gene ontology terms from GSEA that describe the ASCL1 activated targets include terms associated with catecholamine biosynthesis (DBH, DDC, INSM1, TGFB2, and SNCAIP), NOTCH pathway HES1, JAG2, DLL1/3/4, LFNG, and TGFB2), and nervous system development (similar genes as above in addition to FOXA2, ID2, PROX1, BTBD3, ROCK1, SYT4, and others) (Figures 5E, Table S6). No gene ontology terms were enriched in the defined ASCL1 repressed targets. These findings support the known relationship between ASCL1 activity and modulation of NOTCH signaling, the balance of which controls cell proliferation and lineage-differentiation in neural and neuroendocrine stem/progenitor cell niches (Andersen et al., 2014; Ball, 2004; Castro et al., 2011; Ito et al., 2003; Ouadah et al., 2019), and ASCL1-mediated regulation of neural and neuroendocrine lineage genes during development (Borromeo et al., 2016; Guillemot and Hassan, 2017; Henke et al., 2009; Meder et al., 2016; Nakakura et al., 2005).
Figure 5.

Transcriptional targets of ASCL1, NKX2.1 and PROX1
(A) The workflow used to identify transcriptional targets of the three TFs using ChIP-seq, HiChIP, and RNA-seq.
(B) Venn showing the extensive overlap in TF-associated genes identified from the ChIP-seq and HiChIP analysis.
(C) Venn showing the subset of ASCL1 ChIP-seq associated genes (from B) that are differentially expressed (DEG) in NCI-H2107 cells with siASCL1 knock-down followed by RNA-seq.
(D) Venn from (B) but with the DEG from NCI-H2107 cells with siASCL1; siNKX2-1; siPROX1 knock-down followed by RNA-seq. Data is shown for TF activated genes only.
(E) GO pathway analysis of genes activated by the 3 TFs show an enrichment for terms associated with NOTCH signaling for ASCL1, and cell-cycle-related genes for NKX2-1. Genes in bold are also DEG with ASCL1 KD only; asterisked genes were bound by ASCL1 and NKX2-1 only; genes in green are those that were reproduced with knockdown of the three TFs in NCI-H889.
See also Tables S4 and S6 for the full lists of direct targets of ASCL1 and all 3TFs, and the pathway analysis.
We next asked whether the combined loss of all three TFs, ASCL1, NKX2-1, and PROX1 would enhance the ASCL1 knockdown phenotype or not, and whether any additional pathways might be affected. Here, we compared the DEGs identified in the triple TF knockdown, with all the TF-associated genes identified through ChIP-seq. From this analysis, there were two groups of genes that were enriched with gene ontology terms (Figures 5D and 5E, Table S6). First, 132 genes were associated with binding of all three TFs, interactions supported by HiChIP data, and whose expression were significantly decreased in the triple knockdown. These 132 genes strongly overlapped with those genes associated with catecholamine biosynthesis, NOTCH signaling, and nervous system development as was seen with ASCL1 alone (Figure 5E bolded genes were identified with ASCL1 alone, genes in green were reproduced in NCI-H889 as downstream of the TFs). The oncogenes BCL2, BCL6, and MYCL are also within this 132 gene set.
The second notable finding is that many cell cycle/mitosis related genes appear to be directly activated by NKX2-1 since they are associated with NKX2-1 ChIP-seq peaks but not those from ASCL1 or PROX1 (Figures 5D and 5E). From these analyses, we conclude that ASCL1 is key to regulating NOTCH signaling and neuroendocrine features in SCLC, while NKX2-1 and PROX1 as co-factors may largely function to increase the robustness of this activity. NKX2-1 appears to have additional, specific activity in regulating some cell-cycle genes independent of ASCL1 and PROX1. In addition, in contrast to the enrichment for the DepMap-defined common essential genes in the SE-associated gene lists, the genes directly regulated by ASCL1 and its co-factors are less likely to be common dependencies (∼5% compared with 12% across all genes), possibly reflecting their function as lineage-specific dependency factors.
Discussion
A better understanding of molecular subtypes and their underlying biology is necessary to develop new treatments for SCLC. Several approaches ranging from gene expression analysis to systems biology have been used to classify SCLC tumors (Cardnell et al., 2017; Gazdar et al., 2017; George et al., 2015; Wooten et al., 2019) and a consensus classification based on lineage TF expression of ASCL1, NEUROD1, and POU2F3 has emerged (Gay et al., 2021; Rudin et al., 2019). To get a more comprehensive understanding of SCLC lineage TF phenotypes and to establish potential therapeutic targets (Figure 6 and associated Tables), we took multiple approaches including identifying SE-associated genes and exploring genes downstream from the ASCL1/NKX2-1/PROX1 transcription network in a number of patient-derived SCLC cell and xenograft preclinical models. Figure 6 provides a summary of the SE and ASCL1/NKX2-1/PROX1 gene sets identified in this study with a guide to the relevant Table.
Figure 6.

Gene sets generated in this study that identify molecular road maps for SCLC
See results and related Figures 2 and 5 and Tables S1, S4, S5, and S6.
SEs are large genomic regions enriched in TF-binding sites that regulate the expression of genes for cell fate and identity in normal cells. Cancer cells can acquire additional SEs by genomic alterations (Hnisz et al., 2015; Mansour et al., 2014; Northcott et al., 2014; Shin, 2018; Sur and Taipale, 2016). Genes associated with SEs are expressed at high levels and are thought to promote carcinogenesis (Hnisz et al., 2013; Loven et al., 2013), and as a result, SE-associated genes are being evaluated as potential therapeutic targets in many cancers including SCLC (Christensen et al., 2014). Unbiased clustering of preclinical SCLC and NSCLC models according to their SE landscape distributed the SCLC models into 3 groups. These groups were characterized by the expression of one of the lineage-defining TFs, ASCL1, NEUROD1, or POU2F3, corresponding to the SCLC-A, SCLC-N, and SCLC-P subgroups recently put forward to molecularly classify SCLC (Rudin et al., 2019). Because of their small numbers, we did not analyze the SCLC-Y subgroup in this study. Noteworthy, SE analyses showed that SCLC PDXs and cell lines clustered similarly, indicating SCLC cell lines conserve typical SCLC molecular features despite being maintained in cell culture. Overall, our study substantiates that SEs can be used to classify tumors, a strategy used to classify other tumor types such as medulloblastoma (Lin et al., 2016), and demonstrates the ASCL1, NEUROD1, and POU2F3 consensus classification, which is based on the predominant expression of a single lineage transcription factor, also represents distinct chromatin landscapes across the subtypes. Furthermore, with refinements from 3D chromatin conformation analysis, we identified genes associated with SEs unique and common between the SCLC subtypes. The enrichment of this SE-associated gene list with genes defined as common essential genes from DepMap highlight the essentiality of SE-associated genes. These genes are involved in diverse cellular processes, and provide candidate targets for future therapeutic interrogation (see Table S1).
SEs inform on the core TF regulatory circuitry and in particular help identify interconnected TF networks (Lee and Young, 2013). Here, by integrating SE profiling with proteomics and TF-ChIP-seq, we found that the TFs ASCL1, NKX2-1, and PROX1 are associated with SEs in the SCLC-A subtype, have physical and functional dependencies, and share common transcriptional targets, and as such define a TF regulatory network, although the strength of any given interaction is specific to cellular context. Our findings provide experimental support for the TF network and downstream targets predicted from gene expression correlations extracted from SCLC_CellMiner (https://discover.nci.nih.gov/SclcCellMinerCDB) (Tlemsani et al., 2020). The genomic interrogation here for DNA binding and transcriptional activity of the three factors ASCL1, NKX2-1, and PROX1, highlights the importance of these factors in regulating genes involved in Notch signaling, neural development, and catecholamine biosynthesis, consistent with a neuroendocrine phenotype and a previous study showing a link between the neuroendocrine phenotype and the Notch pathway (George et al., 2015). These gene sets provide additional components of the molecular roadmap for the SCLC-A subtype providing direct (Table S6) and indirect (Table S5) downstream targets of these key lineage transcription factors for SCLC (Figure 6).
The strong association of ASCL1 activity with Notch signaling found throughout neural development and in NE lineages (Ball, 2004; Henke et al., 2009; Ouadah et al., 2019; Sueda and Kageyama, 2020) is reiterated in the present study. ASCL1 regulates multiple NOTCH ligands including DLL1, DLL3, and DLL4. Additional NOTCH pathway related genes were also found including LFNG, a glycosyltransferase that leads to elongation of O-linked fucose residues on NOTCH. This activity alters Notch signaling in different ways due to modulation of ligand binding to NOTCH receptors (Bruckner et al., 2000; Moloney et al., 2000). Thus, LFNG may be an important player downstream of ASCL1 in SCLC biology.
The finding that NKX2-1 and PROX-1 are co-factors for ASCL1 in SCLC is consistent with the role of these factors in the development of pulmonary neuroendocrine lineages. NKX2-1 and ASCL1 are involved in the reprogramming of normal epithelial cells into NE SCLC (Park et al., 2018), while PROX1 is reported to regulate the expression of secretory-granule related genes, including chromogranin A (Ishii et al., 2016), which are stored and released with catecholamines in/from dense core vesicles. As shown here, ASCL1, NKX2-1, and PROX1 interact with each other and on common genomic regions to regulate the NE phenotype of SCLC. FOXA2 is also an important TF in pulmonary NE identity, and we show that it is a direct downstream target of the ASCL1/NKX2-1/PROX1 TF network. Interestingly, the FOXA2 consensus binding motif is enriched in the same regions bound by the three factors (Figure 3F). Because we did not detect FOXA2 with ASCL1 immunoprecipitation, we suggest FOXA2 may be functioning to increase chromatin accessible at these regions for TF binding, a known function for FOXA2 (Zaret and Carroll, 2011). Thus, FOXA2 may be both regulated by the ASCL1 TF network and function to facilitate its activity in regulating NE lineage identity. We note that in DepMap, the two factors that show striking cell-type specific dependencies in SCLC-A are ASCL1 and FOXA2 (see Tables S1 and S6).
ASCL1 is essential in genetic mouse models for development of SCLC (Borromeo et al., 2016; Olsen et al., 2021), and in human SCLC cell line models, ASCL1 is required for normal growth. Thus, the modest loss in cell viability in NCI-H2107 cells, and the lack of this phenotype in NCI-H345 and NCI-H889 following siASCL1 knockdown was surprising. Nevertheless, this modest decrease in NCI-H2107 cell viability is a consistent finding that has been repeated using CRISPR-based strategies (DKK and JEJ, not shown). DepMap data also show 5 of 6 ASCL1-expressing SCLC cell line models have a dependency on ASCL1 (see Tables S1 and S6). Thus, even within SCLC-A models, there can be variability in dependence on ASCL1 for growth in the cell-based assays. Additional strategies, possibly colony formation assays or growth as PDX, are needed to gain deeper insight into the consequences of ASCL1 loss in SCLC. In addition, since ASCL1 is also important in neuroendocrine cell identity, in the absence of ASCL1 the cells may be changing their identity as is seen in SCLC mouse models (Olsen et al., 2021). In the short time frame of the siRNA experiments reported here, and the incomplete knockdown, we are unlikely to detect these changes if they occur. Consistent with this interpretation, we detected no changes in morphology following siASCL1 or the knockdown with all three TFs.
In conclusion, we developed a multilayered, integrative approach to investigate SEs across three SCLC subtypes that use LTFs ASCL1, NEUROD1, and POU2F3, and focused on transcriptional mechanisms underlying the SCLC-A subtype. We identified NKX2-1 and PROX1 as ASCL1-interacting proteins and found that knockdown of these three LTFs in combination do not have additive or synergistic effects on cell viability at least in short-term cell culture assays. This study highlights the complex relationships between LTFs and their role in the development of SCLC. Furthermore, the genetic and biochemical approaches led to multiple gene lists which can be exploited for molecular diagnostic or therapeutic applications for precision medicine approaches.
Limitations of study
Limitations of this study include the following: (1) the low number of patient-derived SCLC lines used to identify shared downstream targets of ASCL1, NKX2-1, and PROX1. From the inter-tumor variability, we have already found for these targets, even in SCLC-A preclinical models, future studies will need to enlarge the panel studied to include more SCLC cell lines, SCLC from PDX models from the same patient before and after chemotherapy, to “saturate” the downstream target list, determine which are the most commonly shared targets, and which remain when chemoresistance develops; (2) the protein-protein interactions of ASCL1 with NKX2-1 and PROX1 we have studied so far, despite our data that these factors bind overlapping genomic regions, does not provide mechanistic insight into the directness of these interactions, whether they occur at the same time, or whether they may compete for ASCL1 binding; and (3) What combinations of the downstream TF targets and SE-associated genes identified must be therapeutically addressed to achieve cure of individual SCLCs.
STAR★Methods
Key resources table
| REAGENT or RESOURCE | SOURCE | IDENTIFIER |
|---|---|---|
| Antibodies | ||
| Rabbit anti-H3K27ac antibody | Abcam | Cat# Ab4729; RRID: AB_2118291 |
| Rabbit anti-TTF1/NKX2-1 antibody | Sigma-Millipore | Cat# 07–601; RRID: AB_310743 |
| Rabbit anti-NKX2-1 antibody | Cell Signaling Technology | Cat# 12373; RRID: AB_2797895 |
| Rabbit anti-PROX1 antibody | Proteintech | Cat# 11067-2-AP; RRID: AB_2268804 |
| Mouse anti-ASCL1 antibody | BD-Biosciences | Cat# 556604; RRID: AB_396479 |
| Normal mouse IgG antibody | Santa Cruz Biotechnology | Cat# sc-2025; RRID: AB_737182 |
| Guinea pig anti-ASCL1 antibody | Johnson Laboratory | TX518 |
| Rabbit anti-NFIB antibody | Abcam | Cat# Ab186738; RRID: 2782951 |
| Rabbit anti-FOXA2 antibody | Cell Signaling Technology | Cat# 3143; RRID: AB_2104878 |
| Mouse anti-GAPDH antibody | Santa Cruz Biotechnology | Cat# sc-47724; RRID: AB_627678 |
| Rabbit anti-β-tubulin antibody | Santa Cruz | Cat# sc-5274; RRID: AB_2288090 |
| Biological samples | ||
| Human patient derived SCLC xenografts (PDX) | Memorial Sloan Kettering Cancer Center, NYC | JHU-LX22, JHU-LX-44, JHU-LX-48 and JHU-LX-110 |
| Critical commercial assays | ||
| NEBNext® ChIP-Seq library prep master mix | NEB | E6240 |
| NEBNext® multiplex oligos for Illumina® - index primers set 1 | NEB | E7335S |
| NEBNext® multiplex oligos for Illumina® - index primers set 2 | NEB | E7500S |
| Agencourt AMPure XP magnetic beads | Beckman coulter | A63881 |
| Arcturus PicoPure RNA | ThermoFisher Scientific | KIT0204 |
| X-treme siRNA transfection reagent | Sigma-Aldrich | 4476093001 |
| WST-1 cell proliferation reagent | Sigma-Aldrich | 5015944001 |
| SuperSignal™ West pico PLUS chemiluminescent Substrate | ThermoFisher Scientific | 34,580 |
| Deposited data | ||
| ChIP-seq, HiChIP, and RNA-seq | This paper | GEO: GSE151002 |
| H3K27ac from HBECs | GEO: GSE85401 | |
| H3K27ac from NCI-H2087 | GEO: GSE72956 | |
| H3K27ac from A549, NCI-H3122, and PC9 | GEO: GSE89128 | |
| H3K27ac from DMS79, NCI-H146, NCI-H128, NCI-H446, CORL311, and DMS114 | GEO: GSE115124 | |
| H3K27ac from NCI-H82 input | GEO: GSE62412 | |
| ASCL1-ChIP | GEO: GSE69394 | |
| RNA-seq from the human SCLC cell lines | NCBI | dbGaP Study Accession: phs001823.v1.p1 |
| Experimental models: cell lines | ||
| Human SCLC cell lines | Hamon Cancer Center Collections, UT Southwestern Medical Center, Dallas, TX | NCI-H2107, NCI-H889, NCI-H510, NCI-H345, NCI-H69, NCI-H1092, NCI-H378, NCI-H524, NCI-H446, NCI-H2171, NCI-H82, NCI-H1048, NCI-H211, and NCI-H526 |
| Experimental models: organisms/strains | ||
| Human patient derived SCLC xenografts (PDX) | Memorial Sloan Kettering Cancer Center, NYC | JHU-LX22, JHU-LX-44, JHU-LX-48 and JHU-LX-110 |
| Software and algorithms | ||
| GraphPad prism | GraphPad Prism Software, Inc. | NA |
| Image Studio Lite | LI-COR Biosciences | NA |
| ImageJ | ImageJ, NIH | NA |
| Other | ||
| NKX2-1 MISSION® siRNA | Sigma-Aldrich | HS0100189848 |
| PROX1 siRNA | Santa Cruz Biotechnology | sc-106451 |
| ASCL1 siRNA | ThermoFisher Scientific | 36758255 |
| Control siRNA-A | Santa Cruz Biotechnology | sc-37007 |
| MISSION® siRNA Universal negative control #1 | Sigma-Aldrich | SIC001 |
Resource availability
Lead contact
Further information and requests for resources and reagents should be directed to and will be fulfilled by Jane E. Johnson, jane.johnson@utsouthwestern.edu.
Materials availability
This study did not generate new unique reagents.
Experimental model and subject details
Cell lines
The cell lines used in this study were from human and include NCI-H2107 (M), NCI-H889 (F), NCI-H345 (M), NCI-H510 (M), NCI-H69 (M), NCI-H1092 (M), NCI-H378 (F), NCI-H524 (M), NCI-H446 (M), NCI-H2171 (M), NCI-H82 (M), NCI-H1048 (F), NCI-H211 (F), and NCI-H526 (M) (F, female; M, male) (Hamon Cancer Center Collections, UT Southwestern Medical Center, Dallas, TX). Of note, three of the SCLC preclinical models used for these studies are from Black patients including SCLC-A models NCI-H2107 and NCI-H128, and the SCLC-P model NCI-H1048 (Thomas et al., 2021). Cell lines were authenticated by DNA-fingerprinting using the PowerPlex 1.2 Kit (Promega DC6500) and tested for mycoplasma using an e-Myco Kit (Boca Scientific 25,235). Cells were maintained in RPMI-1640 media (ThermoFisher Scientific 11875135) supplemented with 5% heat deactivated fetal bovine serum (Sigma Aldrich) without antibiotics at 37°C in a humidified atmosphere containing 5% CO2.
Patient-derived xenograft (PDX) models
Human SCLC PDX models JHU-LX22, JHU-LX-44, JHU-LX-48 and JHU-LX-110 were established by using dissociated cells from resected PDX tumors (gift from C. Rudin and J.T. Poirier, Memorial Sloan Kettering Cancer Center, NYC) (Poirier et al., 2015). Cells (1 × 10⁶) were centrifuged, resuspended 1:1 (vol/vol) in matrigel and HITES media (Corning) and injected subcutaneously in the flank of 6–8 week old female NGS mice. Animals were sacrificed 6–8 weeks after implantation, tumors were collected and processed for ChIP (see below). All animal work was approved by the University of Texas Southwestern (Dallas, TX) Institutional Animal Care and Use Committee.
Method details
siRNA transfections and cell survival assays
For transfections, NCI-H2107, NCI-H889, and NCI-H345 cells were plated at a density of 3 × 10⁵ cells/ml in 12-well plates and transfected by adding dropwise 25–100 nM siRNA mixed to 20 μL X-Treme siRNA transfection reagent (Sigma-Aldrich 4476093001) in Opti-MEM reduced serum medium (ThermoFisher Scientific) as per manufacturer's recommendations. The siRNAs used for this study were NKX2-1 MISSION siRNA (Sigma-Aldrich HS0100189848), PROX1 siRNA (Santa Cruz Biotechnology sc-106451), ASCL1 siRNA (ThermoFisher Scientific 36758255), control siRNA-A (Santa Cruz Biotechnology sc-37007) and MISSION siRNA Universal Negative Control #1 (Sigma-Aldrich SIC001). Cell viability was measured 72 hr post-transfection using the WST-1 cell proliferation reagent (Sigma-Aldrich5015944001). Cells were resuspended and transferred to a 96-well plate (90 μL), supplemented with 10 μL cell proliferation reagent and incubated at 37°C in a humidified atmosphere containing 5% CO2 and 95% air for 2 hr. Absorbance was read using a multi-well plate reader. Each experiment was done in triplicate.
RNA extraction for quantitative RT-PCR and sequencing
Cells were harvested by centrifugation and pellets were resuspended in Trizol (ThermoFisher Scientific 15596026). Total RNA was extracted using a PicoPure™ RNA Isolation Kit (ThermoFisher, Cat# KIT0204). cDNA was synthesized using the SuperScript™ III First-Strand Synthesis SuperMix (Invitrogen, Cat# 11752050). RT-qPCR was performed on an Applied Biosystems 7500 Fast thermal cycler using Fast SYBR™ Green Master Mix (Applied Biosystems, Cat# 4385612). All reactions were performed in triplicate. PCR primer sequences used include ASCL1 (CCCAAGCAAGTCAAGCGACA; AAGCCGCTGAAGTTGAGCC), GAPDH (GTCTCCTCTGACTTCAACAGCG; ACCACCCTGTTGCTGTAGCCAA), NKX2-1 (CAGGACACCATGAGGAACAGCG; GCCATGTTCTTGCTCACGTCCC), PROX1 (CTGAAAGACCTACTTCTCCGACG; GATGGCTTGACGTGCGTACTTC). For RNA-seq, RNA was checked using a Bioanalyzer and sequenced on a NextSeq 550 DX Illumina sequencing platform.
Chromatin immunoprecipitation (ChIP) and libraries preparation
H3K27ac ChIPs were performed as described by (Lee et al., 2006). Briefly, ∼7 × 10⁷ cells were fixed in 1% formaldehyde (EMS 50980485) for 10 min at room temperature. Nuclear extracts were prepared by resuspending cell pellets in Lysis Buffer 1 (50 mM HEPES-KOH, pH 7.5, 140 mM NaCl, 1 mM EDTA, 10% glycerol, 0.5% Igepal, 0.25% Triton X-100) supplemented with protease inhibitors, followed by centrifugation and resuspension in Lysis Buffer 2 buffer (10 mM Tris-HCl, pH 8.0, 200 mM NaCl, 1 mM EDTA, 0.5 mM EGTA) supplemented with protease inhibitors. After centrifugation, pellets were resuspended in Lysis Buffer 3 (10 mM Tris-HCl, pH 8.0, 100 mM NaCl, 1 mM EDTA, 0.5 mM EGTA, 0.1% Na-Deoxycholate, 0.5% N-lauroylsarcosine) supplemented with protease inhibitors and sonicated in a Diagenode Bioruptor for 40 min, 30s:30s on:off cycles, high power. Chromatin (200 μg) was incubated overnight with 10 μg rabbit anti-H3K27ac (Abcam Ab4729) in ChIP buffer (20 mM Tris-HCl, pH 8.0, 150 mM NaCl, 1 mM EDTA, 0.1% Triton X-100) supplemented with protease inhibitors. This step was followed by incubation with 35 μL protein A/G agarose plus (50% slurry) (ThermoFisher Scientific, 20,421) for 6 hr. After 6 washes in RIPA buffer (50 mM HEPES-KOH, pH 7.6, 500 mM LiCl, 1 mM EDTA, 1.0% NP-40, 0.7% Na-Deoxycholate) followed by 1 wash in TEN buffer (10 mM Tris-HCl, pH 8.0, 1 mM EDTA, 50 mM NaCl), immunoprecipitated DNA was eluted in buffer E (50 mM Tris-HCl, pH 8.0, 10 mM EDTA, 1.0% SDS) for 30 min at 70°C and reverse cross-linked for 12 hr at 65°C. DNA was treated with proteinase K and RNAse A and DNA purified using QIAgen PCR purification kit. Transcription factor ChIPs were conducted as described above except that eluted DNA was treated with proteinase K prior to reversed cross-link for 15 hr at 65°C. Antibodies used for transcription factor ChIPs were rabbit anti-TTF1 (NKX2-1) (10 μg; Sigma-Millipore 07–601), and rabbit anti-PROX1 (10 μg; Proteintech 11067-2-AP).
Libraries were prepared using NEBNext ChIP-Seq Library Prep Master Mix (E6240, NEB) and NEBNext Multiplex Oligos for Illumina (Index Primers Set 1 E7335S, Index Primers Set 2, E7500S) with Agencourt AMPure XP magnetic beads (Beckman coulter A63881) exactly as per manufacturer's instructions. Libraries were checked using a Bioanalyzer and sequenced on a Hiseq 2500 sequencing platform.
HiChIP
HiChIP assays were performed as in (Mumbach et al., 2016). Briefly, ∼10 million cells were crosslinked with 1% Formaldehyde and lysed with Hi-C lysis buffer (10 mM Tris-HCl pH 7.5, 10 mM NaCl, 0.2% NP40) supplemented with protease inhibitors. Chromatin was digested with the MboI restriction enzyme. The digested DNA sticky ends were filled with dCTP, dGTP, dTTP and biotin-labeled dATP by DNA Polymerase I, Large Klenow Fragment, and then ligated by T4 DNA ligase. Chromatin was sonicated in Nuclear Lysis buffer (50 mM Tris-HCl pH 7.5, 10 mM EDTA, 1% SDS) and then processed with regular chromatin immunoprecipitation procedures using the H3K27ac antibody (Abcam, ab4729). The ChIP-enriched Biotin-labeled DNA fragments were then purified by Streptavidin C1 magnetic beads and processed with Nextera DNA library preparation. The DNA libraries were sequenced by Illumina NextSeq (75 bp paired end reads).
Bioinformatics analyses
Sequencing data analysis
ChIP-seq was demultiplexed using sample-specific Illumina primer sequences. The resulting datasets were aligned to the hg19 genome using Bowtie2 v2.2.6 (Langmead et al., 2009). Reads with a Bowtie2 quality score less than 10 were removed using SAMtools v1.3 (Li et al., 2009) with parameters (-bh -F 0 × 04 -q 10). Duplicate reads were removed using picardtools v1.119 (http://broadinstitute.github.io/picard), and the remaining reads were normalized to 10 million reads using HOMER v4.7 (Heinz et al., 2010). All UCSC Genome Browser plots shown (Kent et al., 2002, 2010; Raney et al., 2014; Rosenbloom et al., 2015) reflect these normalized tag counts.
RNA-seq sample reads were aligned to the human genome using TopHat 2.1.0 (Langmead et al., 2009; Trapnell et al., 2009; Trapnell and Salzberg, 2009). Default settings were used, with the exception of –G, specifying assembly to the hg19 genome, --library-type fr -first strand, and –no-novel-juncs, which disregards noncanonical splice junctions when defining alignments. Cufflinks v2.2.1 (Roberts et al., 2011a, 2011b; Trapnell et al., 2010, 2013) was used to call and quantify the transcripts from biological replicates for each sample, and identify genes, which were differentially expressed between samples, using the default parameters.
Peak calling
H3K27ac or TF ChIP-seq datasets from the SCLC samples were used to identify putative binding sites (ChIP-enriched peak regions) genome-wide based on the distribution of the aligned reads. ChIP-seq datasets for the transcription factors and the H3K27ac marks were normalized to 10 million reads. Peaks for each sample were called based on respective input samples created during immunoprecipitation. Peak calling was performed using the findPeaks library of HOMER 4.9 (Heinz et al., 2010) and identified significantly enriched peak regions from each dataset.
De novo motif discovery
HOMER v4.7 was used for all motif discovery presented here. To screen for potential DNA-binding co-factor motifs, a broader window of 150bp centered on the peak apex was used to identify enriched motifs adjacent to the primary binding site. The interval used for each analysis is noted in the text. Parameters –S 10 –bits were used unless otherwise noted. In de novo motif analysis, HOMER searches for motifs with 8, 10, or 12 bps on both strands such that flanking site preferences are not degraded.
SE identification
SEs were determined using H3K27Ac samples. H3K27ac bound enhancer regions that were significant at Poisson p value threshold of 1 × 10⁻⁹ were identified using HOMER v4.7. Using ROSE (Loven et al., 2013; Whyte et al., 2013) tool enhancers within 12.5 kb were stitched together and rank ordered based on the ChIP signal versus input to identify SEs.
SE comparison visualization in heatmap and dendrogram
We compared the SEs between all the cell lines and PDX samples by unsupervised cluster analysis to determine if SEs subtype the different SCLC. Shared SEs between a given sample pair were defined if the SEs overlapped by at least 1bp. Using this criterion, we calculated the percentage of SEs shared between cell lines and PDX samples in a pairwise fashion. Unsupervised clustering was performed using the similarity metrics (percentage values). The heatmap and phylogenetic style dendrogram were generated using R packages “gplots” and “ape” respectively.
HiChIP data analysis
HiChIP reads were mapped to hg19 using HiC-pro (v.2.11.3) (Servant et al., 2015). For alignment, MboI restriction sites in the hg19 build were used. HiC-pro uses Bowtie2 for mapping and we specified --very-sensitive -L 30 --score-min L, −0.6, −0.2 --end-to-end –reorder for global options and --very-sensitive -L 20 --score-min L, −0.6, −0.2 --end-to-end –reorder for local options. We used “GATCGATC” as the ligation site during the mapping process. We used H3K27ac enriched regions and hichipper (v.0.7.0) (Lareau and Aryee, 2018) to call loops. In this step we identified shared H3K27ac enriched regions in 6 out of 11 ASCL1 high samples and merged them to make an anchor regions set for hichipper to call loops from 8 ASCL1 high HiChIP samples. Similarly, we identified shared H3K27ac enriched regions in 4 out of 6 NEUROD1 high samples and merged them to make an anchor regions set for hichipper to call loops from 5 NEUROD1 high HiChIP samples. For Dual high HiChIP samples we identified shared anchor regions from the above ASCL1 high samples and NEUROD1 high samples and used this set as anchor regions to call loops in the 2 dual high HiChIP samples. From the hichipper results, we filtered the loops that are significant at a p value of 0.01 and supported by at least 10 paired-end tags (PETS) for further analysis. For these filtered loops, we assigned a gene target to both loop ends if either of the loop coordinates fell within 5kb around the TSS of refseq genes. Similarly, if any anchor region fell within 5kb around the TSS of refseq genes we assign that gene to the respective anchor region.
Target calling for SE and TF ChIP peaks
The genes assigned to loop coordinates and anchor regions from the above step were used to identify SE-associated targets and putative targets for TF ChIP peaks. For this we compared the coordinates of SE regions or TF ChIP peaks with loop coordinates and anchor regions that are assigned with gene targets to identify the over lapped regions and used this information to assign gene targets for a given SE region or TF ChIP peak. Using this approach, we called the SE-associated targets for 11 ASCL1 high samples and 6 NEUROD1 high samples. For ASCL1, NKX2-1, and PROX1 ChIP peaks, we used a similar method to call the putative targets. Intersectbed module from bedtools (v2.27.1) (Quinlan and Hall, 2010) was used for assigning the gene targets to loop coordinates, and comparing them SE regions and TF peaks. For POU2F3 high sample SE regions, since there is no HiCHIP data available, we used gene targets that overlapped the SE regions or two nearest genes if SE regions are not overlapping with any gene targets.
Target comparison and filtering for pathway enrichment analysis
SE-associated genes from 11 ASCL1 high samples were compared and those shared between 6 of 11 ASCL1 high samples were identified as SCLC-A SE-associated genes. A similar strategy was used for SCLC-N (4 of 6) and SCLC-P (3 of 5). To focus on abundantly expressed SE-associated genes, we used an expression cutoff of 5 FPKM in a majority of the relevant SCLC subtype. These filtered datasets used for pathway enrichment analysis.
ASCL1, NKX2-1 and PROX1 ChIP peak associated targets in NCI-H2107, NCI-H889, and NCI-H128 cells were compared and putative targets identified if they were shared in 2 out of 3 cell lines for each factor. These gene lists were compared with ASCL1-KD and 3TF-KD RNA-seq DEG lists and pathways enrichment analysis performed. All pathway enrichment analyses in this study were performed using gprofiler tool (Reimand et al., 2007) using GO biological processes, reactome, KEGG and wiki pathway databases.
For the GSEA enrichment map in Figure 4E, a gene set enrichment analysis (GSEA) was performed (Subramanian et al., 2005) from ranked list of DEG upon ASCL1 and the 3TF knockdown in NCI-H2107 cells. Default parameters were used for GSEA except the permutation type parameter. Due to the limited number of samples, we used the “geneset” permutation type for the analysis. We performed GSEA for each condition separately and the gene sets that were significantly enriched in (FDR ≤5%) at any given condition were selected for clustering analysis. Hierarchical clustering was performed on the normalized enrichment scores (NES) obtained from the significant gene sets enriched in the two conditions and plotted as an enrichment heatmap using heatmap.2 function available in “gplots” R package (Warnes et al., 2015).
Target comparison for DepMap analysis
The probability of dependency values for genome-scale CRISPR knockout screens for 18,119 genes in 769 cell lines from DepMap was downloaded from the DepMap website (DepMap, 2020; Meyers et al., 2017). From these cell lines, genome-wide probability of dependency values for 17 SCLC cell lines and 11 random NSCLC cell lines were extracted. Gene lists in Tables S1 and S6 were annotated by using these values. A heatmap format with color scale ranges from 0 to 1 is represented.
Immunoprecipitation
Nuclear fractions from ∼1 × 10⁶ NCI-H2107 cells were prepared using the NE-PER kit (ThermoFisher Scientific 78,835) as per the manufacturer's instructions and incubated with 10 μg primary antibodies overnight at 4°C followed by 90 min incubation with 35 μL protein A/G agarose plus (50% slurry) (ThermoFisher Scientific, 20,421). Immune pellets were washed 5 times in PBS containing 1% Triton X-100 and analyzed by SDS-PAGE followed by either immunoblotting or mass spectrometry (LC/MS-MS). For LC/MS-MS, 6 immunoprecipitations were pooled. Antibodies used for immunoprecipitations were mouse anti-ASCL1 antibodies (BD-Biosciences 556604) and normal mouse IgG (Santa Cruz Biotechnology sc-2025). For Figure 3B, a guinea pig anti-ASCL1 antibody was used (TX518 (Kim et al., 2008)). Nuclear extracts of NCI-H524 cells, which do not express ASCL1 were used as negative control. For NCI-H889, NCI-H2171, and NCI-H345, cells were lysed by incubation in RIPA buffer for 30 min on ice. Protein concentration of lysate was determined by BCA assay kit (Pierce 23,225) and 200 μg total lysate was incubated overnight at 4°C on an inverter with 35 μL protein A/G agarose plus (50% slurry) (ThermoFisher Scientific, 20,421) pre-loaded with guinea pig anti-ASCL1 antibody (TX518). Immune pellets were washed 5 times in PBS containing 1% Triton X-100 and analyzed by SDS-PAGE followed by immunoblotting.
Mass spectrometry analysis
For protein identification, samples were separated by SDS-PAGE electrophoresis. After Coomassie stain, bands were cut out of the gel and submitted to the UT Southwestern Proteomics core facility for LC-MS/MS analysis on an Orbitrap Fusion Lumos mass spectrometer. Proteins were identified using Proteome Discoverer 2.2.
Immunoblotting
Cellular extracts prepared as in (Pozo et al., 2013) and immune pellets were analyzed by SDS-PAGE electrophoresis using BIORAD Criterion gels and electro-transferred on PVDF membrane (EMD-Millipore IPVH85R). Membranes were incubated overnight at 4°C with primary antibodies and for 2 hr at room temperature with horseradish-conjugated secondary antibodies. Western-blots were detected using the SuperSignal West Pico PLUS Chemiluminescent Substrate (ThermoFisher Scientific 34,580) or ECL Select Western Blotting Detection Reagent (GE Healthcare RPN2235). Western-blots were quantified using Image Studio Lite quantification software (Licor).
Antibodies used for immunoblotting include mouse anti-ASCL1 (1:1000; BD-Biosciences 556604), rabbit anti-NKX2-1 (1:2000; Cell Signaling Technology 12,373), rabbit anti-PROX1 (1:2000; Proteintech 11067-2-AP), mouse anti-GAPDH (1:10,000, Santa Cruz Biotechnology sc-47724) and rabbit anti-β-tubulin (1:2000, Santa Cruz sc-5274). Secondary antibodies were HRP-conjugated goat anti-Rabbit IgG (H + L) (1:10,000, ThermoFisher Scientific 31,460) and HRP-conjugated goat anti-Mouse IgG (H + L) (1:10,000, ThermoFisher Scientific A16066).
Quantification and statistical analysis
Formazan dye formation in the WST-1 assays was quantified using a multiwell spectrophotometer. Immunoblots were quantified using Image Studio Lite (LI-COR Biosciences). Quantified data was reported as mean ± SEM and the sample size is as indicated. For Figures 4B’ and 4C, p values were determined using one-way ANOVA followed by a Bonferroni post-hoc test. For Figure 3C, the non-parametric test, Mann-Whitney, was used to determine p values. Graphpad Prism v7.0/v9.0 were used for statistical analysis.
Acknowledgments
We acknowledge the many helpful discussions with members of the SCLC interest group at UT Southwestern, Chaoying Liang in the Microarray Core at UT Southwestern for Next Generation Sequencing and Mohammad Goodarzi in the Proteomics Core facility at UT Southwestern for outstanding service. We thank Victor Stastny, Kenneth Huffman, Luc Girard, and Adi Gazdar (deceased) for work on the SCLC lines and discussions about SCLC lineage transcription factors, and Charles Rudin and J.T. Poirier for providing the SCLC PDX. Support for maintaining, authentication, and genomic characterization of the SCLC cell lines was provided in part by NCI U24CA213274. Funding for this project was provided by the NCI including U01CA213338 to J.D.M., R00 CA215244 to X.Z, a Career Development Award from the Spore Grant in Lung Cancer P50CA70907 to K.P., F30 CA228314 to D.P.K, and the Cancer Prevention Research Institute of Texas Training Grant RP160157 to K.R.
Author contributions
Conceptualization, K.P. and J.E.J.; investigation, K.P., K.E.R., D.P.K., M.S.U., and X.Z.; formal analysis, R.K.K.; resources, J.E.J., J.D.M., and X.Z.; writing-original draft, K.P., R.K.K., and J.E.J.; writing-review & editing, K.P., R.K.K., K.E.R., D.P.K., M.S.U., X.Z., J.D.M., and J.E.J.; funding acquisition, K.P., J.E.J. X.Z., and J.D.M; supervision, J.E.J.
Declaration of interests
J.D.M. receives licensing fees for lung cancer lines from the NIH and UT Southwestern Medical Center.
Inclusion and diversity
One or more of the authors of this paper self-identifies as an underrepresented ethnic minority in science.
Published: September 24, 2021
Footnotes
Supplemental information can be found online at https://doi.org/10.1016/j.isci.2021.102953.
Supplemental information
Data and code availability
-
•
ChIP-seq and RNA-seq data have been deposited at GEO and are publicly available. Accession numbers are listed in the key resources table.
-
•
This paper analyzes existing, publicly available data. These accession numbers for the datasets are listed in the key resources table.
-
•
This study did not generate new code.
-
•
Any additional information required to reanalyze the data reported in this paper is available from the lead contact upon request.
References
- Andersen J., Urbán N., Achimastou A., Ito A., Simic M., Ullom K., Martynoga B., Lebel M., Göritz C., Frisén J. A transcriptional mechanism integrating inputs from extracellular signals to activate hippocampal stem cells. Neuron. 2014;83:1085–1097. doi: 10.1016/j.neuron.2014.08.004. [DOI] [PMC free article] [PubMed] [Google Scholar]
- Augustyn A., Borromeo M., Wang T., Fujimoto J., Shao C., Dospoy P.D., Lee V., Tan C., Sullivan J.P., Larsen J.E. ASCL1 is a lineage oncogene providing therapeutic targets for high-grade neuroendocrine lung cancers. Proc. Natl. Acad. Sci. U S A. 2014;111:14788–14793. doi: 10.1073/pnas.1410419111. [DOI] [PMC free article] [PubMed] [Google Scholar]
- Ball D.W. Achaete-scute homolog-1 and Notch in lung neuroendocrine development and cancer. Cancer Lett. 2004;204:159–169. doi: 10.1016/S0304-3835(03)00452-X. [DOI] [PubMed] [Google Scholar]
- Borges M., Linnoila R.I., van de Velde H.J., Chen H., Nelkin B.D., Mabry M., Baylin S.B., Ball D.W. An achaete-scute homologue essential for neuroendocrine differentiation in the lung. Nature. 1997;386:852–855. doi: 10.1038/386852a0. [DOI] [PubMed] [Google Scholar]
- Borromeo M.D., Savage T.K., Kollipara R.K., He M., Augustyn A., Osborne J.K., Girard L., Minna J.D., Gazdar A.F., Cobb M.H., Johnson J.E. ASCL1 and NEUROD1 reveal heterogeneity in pulmonary neuroendocrine tumors and regulate distinct genetic programs. Cell Rep. 2016;16:1259–1272. doi: 10.1016/j.celrep.2016.06.081. [DOI] [PMC free article] [PubMed] [Google Scholar]
- Bruckner K., Perez L., Clausen H., Cohen S. Glycosyltransferase activity of Fringe modulates Notch-Delta interactions. Nature. 2000;406:411–415. doi: 10.1038/35019075. [DOI] [PubMed] [Google Scholar]
- Cardnell R.J., Li L., Sen T., Bara R., Tong P., Fujimoto J., Ireland A.S., Guthrie M.R., Bheddah S., Banerjee U. Protein expression of TTF1 and cMYC define distinct molecular subgroups of small cell lung cancer with unique vulnerabilities to aurora kinase inhibition, DLL3 targeting, and other targeted therapies. Oncotarget. 2017;8:73419–73432. doi: 10.18632/oncotarget.20621. [DOI] [PMC free article] [PubMed] [Google Scholar]
- Castro D.S., Martynoga B., Parras C., Ramesh V., Pacary E., Johnston C., Drechsel D., Lebel-Potter M., Garcia L.G., Hunt C. A novel function of the proneural factor Ascl1 in progenitor proliferation identified by genome-wide characterization of its targets. Genes Dev. 2011;25:930–945. doi: 10.1101/gad.627811. [DOI] [PMC free article] [PubMed] [Google Scholar]
- Chipumuro E., Marco E., Christensen C.L., Kwiatkowski N., Zhang T., Hatheway C.M., Abraham B.J., Sharma B., Yeung C., Altabef A. CDK7 inhibition suppresses super-enhancer-linked oncogenic transcription in MYCN-driven cancer. Cell. 2014;159:1126–1139. doi: 10.1016/j.cell.2014.10.024. [DOI] [PMC free article] [PubMed] [Google Scholar]
- Christensen C.L., Kwiatkowski N., Abraham B.J., Carretero J., Al-Shahrour F., Zhang T., Chipumuro E., Herter-Sprie G.S., Akbay E.A., Altabef A. Targeting transcriptional addictions in small cell lung cancer with a covalent CDK7 inhibitor. Cancer Cell. 2014;26:909–922. doi: 10.1016/j.ccell.2014.10.019. [DOI] [PMC free article] [PubMed] [Google Scholar]
- Denny S.K., Yang D., Chuang C.H., Brady J.J., Lim J.S., Gruner B.M., Chiou S.H., Schep A.N., Baral J., Hamard C. Nfib promotes metastasis through a widespread increase in chromatin accessibility. Cell. 2016;166:328–342. doi: 10.1016/j.cell.2016.05.052. [DOI] [PMC free article] [PubMed] [Google Scholar]
- DepMap B. DepMap 20Q2 public. Figshare. Dataset. 2020. [DOI]
- Fujino K., Motooka Y., Hassan W.A., Ali Abdalla M.O., Sato Y., Kudoh S., Hasegawa K., Niimori-Kita K., Kobayashi H., Kubota I. Insulinoma-associated protein 1 is a crucial regulator of neuroendocrine differentiation in lung cancer. Am. J. Pathol. 2015;185:3164–3177. doi: 10.1016/j.ajpath.2015.08.018. [DOI] [PubMed] [Google Scholar]
- Garg A., Sui P., Verheyden J.M., Young L.R., Sun X. Consider the lung as a sensory organ: a tip from pulmonary neuroendocrine cells. Curr. Top. Dev. Biol. 2019;132:67–89. doi: 10.1016/bs.ctdb.2018.12.002. [DOI] [PubMed] [Google Scholar]
- Gay C.M., Stewart C.A., Park E.M., Diao L., Groves S.M., Heeke S., Nabet B.Y., Fujimoto J., Solis L.M., Lu W. Patterns of transcription factor programs and immune pathway activation define four major subtypes of SCLC with distinct therapeutic vulnerabilities. Cancer Cell. 2021;39:346–360 e347. doi: 10.1016/j.ccell.2020.12.014. [DOI] [PMC free article] [PubMed] [Google Scholar]
- Gazdar A.F., Bunn P.A., Minna J.D. Small-cell lung cancer: what we know, what we need to know and the path forward. Nat. Rev. Cancer. 2017;17:765. doi: 10.1038/nrc.2017.106. [DOI] [PubMed] [Google Scholar]
- George J., Lim J.S., Jang S.J., Cun Y., Ozretic L., Kong G., Leenders F., Lu X., Fernandez-Cuesta L., Bosco G. Comprehensive genomic profiles of small cell lung cancer. Nature. 2015;524:47–53. doi: 10.1038/nature14664. [DOI] [PMC free article] [PubMed] [Google Scholar]
- Guillemot F., Hassan B.A. Beyond proneural: emerging functions and regulations of proneural proteins. Curr. Opin. Neurobiol. 2017;42:93–101. doi: 10.1016/j.conb.2016.11.011. [DOI] [PubMed] [Google Scholar]
- Heinz S., Benner C., Spann N., Bertolino E., Lin Y.C., Laslo P., Cheng J.X., Murre C., Singh H., Glass C.K. Simple combinations of lineage-determining transcription factors prime cis-regulatory elements required for macrophage and B cell identities. Mol. Cell. 2010;38:576–589. doi: 10.1016/j.molcel.2010.05.004. [DOI] [PMC free article] [PubMed] [Google Scholar]
- Henke R.M., Meredith D.M., Borromeo M.D., Savage T.K., Johnson J.E. Ascl1 and Neurog2 form novel complexes and regulate Delta-like3 (Dll3) expression in the neural tube. Dev. Biol. 2009;328:529–540. doi: 10.1016/j.ydbio.2009.01.007. [DOI] [PMC free article] [PubMed] [Google Scholar]
- Hnisz D., Abraham B.J., Lee T.I., Lau A., Saint-Andre V., Sigova A.A., Hoke H.A., Young R.A. Super-enhancers in the control of cell identity and disease. Cell. 2013;155:934–947. doi: 10.1016/j.cell.2013.09.053. [DOI] [PMC free article] [PubMed] [Google Scholar]
- Hnisz D., Schuijers J., Lin C.Y., Weintraub A.S., Abraham B.J., Lee T.I., Bradner J.E., Young R.A. Convergence of developmental and oncogenic signaling pathways at transcriptional super-enhancers. Mol. Cell. 2015;58:362–370. doi: 10.1016/j.molcel.2015.02.014. [DOI] [PMC free article] [PubMed] [Google Scholar]
- Huang Y.H., Klingbeil O., He X.Y., Wu X.S., Arun G., Lu B., Somerville T.D.D., Milazzo J.P., Wilkinson J.E., Demerdash O.E. POU2F3 is a master regulator of a tuft cell-like variant of small cell lung cancer. Genes Dev. 2018;32:915–928. doi: 10.1101/gad.314815.118. [DOI] [PMC free article] [PubMed] [Google Scholar]
- Ireland A.S., Micinski A.M., Kastner D.W., Guo B., Wait S.J., Spainhower K.B., Conley C.C., Chen O.S., Guthrie M.R., Soltero D. MYC drives temporal evolution of small cell lung cancer subtypes by reprogramming neuroendocrine fate. Cancer Cell. 2020;38:60–78 e12. doi: 10.1016/j.ccell.2020.05.001. [DOI] [PMC free article] [PubMed] [Google Scholar]
- Ishii J., Yazawa T., Chiba T., Shishido-Hara Y., Arimasu Y., Sato H., Kamma H. PROX1 promotes secretory granule formation in medullary thyroid cancer cells. Endocrinology. 2016;157:1289–1298. doi: 10.1210/en.2015-1973. [DOI] [PubMed] [Google Scholar]
- Ito T., Udaka N., Okudela K., Yazawa T., Kitamura H. Mechanisms of neuroendocrine differentiation in pulmonary neuroendocrine cells and small cell carcinoma. Endocr. Pathol. 2003;14:133–139. doi: 10.1385/ep:14:2:133. [DOI] [PubMed] [Google Scholar]
- Ito T., Udaka N., Yazawa T., Okudela K., Hayashi H., Sudo T., Guillemot F., Kageyama R., Kitamura H. Basic helix-loop-helix transcription factors regulate the neuroendocrine differentiation of fetal mouse pulmonary epithelium. Development. 2000;127:3913–3921. doi: 10.1242/dev.127.18.3913. [DOI] [PubMed] [Google Scholar]
- Jiang T., Collins B.J., Jin N., Watkins D.N., Brock M.V., Matsui W., Nelkin B.D., Ball D.W. Achaete-scute complex homologue 1 regulates tumor-initiating capacity in human small cell lung cancer. Cancer Res. 2009;69:845–854. doi: 10.1158/0008-5472.CAN-08-2762. [DOI] [PMC free article] [PubMed] [Google Scholar]
- Johnson B.E., Ihde D.C., Makuch R.W., Gazdar A.F., Carney D.N., Oie H., Russell E., Nau M.M., Minna J.D. Myc family oncogene amplification in tumor cell lines established from small cell lung cancer patients and its relationship to clinical status and course. J. Clin. Invest. 1987;79:1629–1634. doi: 10.1172/JCI112999. [DOI] [PMC free article] [PubMed] [Google Scholar]
- Kent W.J., Sugnet C.W., Furey T.S., Roskin K.M., Pringle T.H., Zahler A.M., Haussler D. The human genome browser at UCSC. Genome Res. 2002;12:996–1006. doi: 10.1101/gr.229102. [DOI] [PMC free article] [PubMed] [Google Scholar]
- Kent W.J., Zweig A.S., Barber G., Hinrichs A.S., Karolchik D. BigWig and BigBed: enabling browsing of large distributed datasets. Bioinformatics. 2010;26:2204–2207. doi: 10.1093/bioinformatics/btq351. [DOI] [PMC free article] [PubMed] [Google Scholar]
- Khoor A., Stahlman M.T., Johnson J.M., Olson S.J., Whitsett J.A. Forkhead box A2 transcription factor is expressed in all types of neuroendocrine lung tumors. Hum. Pathol. 2004;35:560–564. doi: 10.1016/j.humpath.2004.01.017. [DOI] [PubMed] [Google Scholar]
- Kim E.J., Battiste J., Nakagawa Y., Johnson J.E. Ascl1 (Mash1) lineage cells contribute to discrete cell populations in CNS architecture. Mol. Cell. Neurosci. 2008;38:595–606. doi: 10.1016/j.mcn.2008.05.008. [DOI] [PMC free article] [PubMed] [Google Scholar]
- Langmead B., Trapnell C., Pop M., Salzberg S.L. Ultrafast and memory-efficient alignment of short DNA sequences to the human genome. Genome Biol. 2009;10:R25. doi: 10.1186/gb-2009-10-3-r25. [DOI] [PMC free article] [PubMed] [Google Scholar]
- Lareau C.A., Aryee M.J. hichipper: a preprocessing pipeline for calling DNA loops from HiChIP data. Nat. Methods. 2018;15:155–156. doi: 10.1038/nmeth.4583. [DOI] [PMC free article] [PubMed] [Google Scholar]
- Lee T.I., Johnstone S.E., Young R.A. Chromatin immunoprecipitation and microarray-based analysis of protein location. Nat. Protoc. 2006;1:729–748. doi: 10.1038/nprot.2006.98. [DOI] [PMC free article] [PubMed] [Google Scholar]
- Lee T.I., Young R.A. Transcriptional regulation and its misregulation in disease. Cell. 2013;152:1237–1251. doi: 10.1016/j.cell.2013.02.014. [DOI] [PMC free article] [PubMed] [Google Scholar]
- Li H., Handsaker B., Wysoker A., Fennell T., Ruan J., Homer N., Marth G., Abecasis G., Durbin R. The sequence alignment/map format and SAMtools. Bioinformatics. 2009;25:2078–2079. doi: 10.1093/bioinformatics/btp352. [DOI] [PMC free article] [PubMed] [Google Scholar]
- Li Y., Linnoila R.I. Multidirectional differentiation of Achaete-Scute homologue-1-defined progenitors in lung development and injury repair. Am. J. Respir. Cell Mol. Biol. 2012;47:768–775. doi: 10.1165/rcmb.2012-0027OC. [DOI] [PMC free article] [PubMed] [Google Scholar]
- Lin C.Y., Erkek S., Tong Y., Yin L., Federation A.J., Zapatka M., Haldipur P., Kawauchi D., Risch T., Warnatz H.J. Active medulloblastoma enhancers reveal subgroup-specific cellular origins. Nature. 2016;530:57–62. doi: 10.1038/nature16546. [DOI] [PMC free article] [PubMed] [Google Scholar]
- Linnoila R.I. Functional facets of the pulmonary neuroendocrine system. Lab. Invest. 2006;86:425–444. doi: 10.1038/labinvest.3700412. [DOI] [PubMed] [Google Scholar]
- Loven J., Hoke H.A., Lin C.Y., Lau A., Orlando D.A., Vakoc C.R., Bradner J.E., Lee T.I., Young R.A. Selective inhibition of tumor oncogenes by disruption of super-enhancers. Cell. 2013;153:320–334. doi: 10.1016/j.cell.2013.03.036. [DOI] [PMC free article] [PubMed] [Google Scholar]
- Mansour M.R., Abraham B.J., Anders L., Berezovskaya A., Gutierrez A., Durbin A.D., Etchin J., Lawton L., Sallan S.E., Silverman L.B. Oncogene regulation. An oncogenic super-enhancer formed through somatic mutation of a noncoding intergenic element. Science. 2014;346:1373–1377. doi: 10.1126/science.1259037. [DOI] [PMC free article] [PubMed] [Google Scholar]
- McLean C.Y., Bristor D., Hiller M., Clarke S.L., Schaar B.T., Lowe C.B., Wenger A.M., Bejerano G. GREAT improves functional interpretation of cis-regulatory regions. Nat. Biotechnol. 2010;28:495–501. doi: 10.1038/nbt.1630. [DOI] [PMC free article] [PubMed] [Google Scholar]
- Meder L., König K., Ozretić L., Schultheis A.M., Ueckeroth F., Ade C.P., Albus K., Boehm D., Rommerscheidt-Fuss U., Florin A. NOTCH, ASCL1, p53 and RB alterations define an alternative pathway driving neuroendocrine and small cell lung carcinomas. Int. J. Cancer. 2016;138:927–938. doi: 10.1002/ijc.29835. [DOI] [PMC free article] [PubMed] [Google Scholar]
- Meuwissen R., Linn S.C., Linnoila R.I., Zevenhoven J., Mooi W.J., Berns A. Induction of small cell lung cancer by somatic inactivation of both Trp53 and Rb1 in a conditional mouse model. Cancer Cell. 2003;4:181–189. doi: 10.1016/s1535-6108(03)00220-4. [DOI] [PubMed] [Google Scholar]
- Meyers R.M., Bryan J.G., McFarland J.M., Weir B.A., Sizemore A.E., Xu H., Dharia N.V., Montgomery P.G., Cowley G.S., Pantel S. Computational correction of copy number effect improves specificity of CRISPR-Cas9 essentiality screens in cancer cells. Nat. Genet. 2017;49:1779–1784. doi: 10.1038/ng.3984. [DOI] [PMC free article] [PubMed] [Google Scholar]
- Mollaoglu G., Guthrie M.R., Bohm S., Bragelmann J., Can I., Ballieu P.M., Marx A., George J., Heinen C., Chalishazar M.D. MYC drives progression of small cell lung cancer to a variant neuroendocrine subtype with vulnerability to aurora kinase inhibition. Cancer Cell. 2017;31:270–285. doi: 10.1016/j.ccell.2016.12.005. [DOI] [PMC free article] [PubMed] [Google Scholar]
- Moloney D.J., Panin V.M., Johnston S.H., Chen J., Shao L., Wilson R., Wang Y., Stanley P., Irvine K.D., Haltiwanger R.S., Vogt T.F. Fringe is a glycosyltransferase that modifies Notch. Nature. 2000;406:369–375. doi: 10.1038/35019000. [DOI] [PubMed] [Google Scholar]
- Mumbach M.R., Rubin A.J., Flynn R.A., Dai C., Khavari P.A., Greenleaf W.J., Chang H.Y. HiChIP: efficient and sensitive analysis of protein-directed genome architecture. Nat. Methods. 2016;13:919–922. doi: 10.1038/nmeth.3999. [DOI] [PMC free article] [PubMed] [Google Scholar]
- Nakakura E.K., Sriuranpong V.R., Kunnimalaiyaan M., Hsiao E.C., Schuebel K.E., Borges M.W., Jin N., Collins B.J., Nelkin B.D., Chen H., Ball D.W. Regulation of neuroendocrine differentiation in gastrointestinal carcinoid tumor cells by notch signaling. J. Clin. Endocrinol. Metab. 2005;90:4350–4356. doi: 10.1210/jc.2005-0540. [DOI] [PubMed] [Google Scholar]
- Northcott P.A., Lee C., Zichner T., Stutz A.M., Erkek S., Kawauchi D., Shih D.J., Hovestadt V., Zapatka M., Sturm D. Enhancer hijacking activates GFI1 family oncogenes in medulloblastoma. Nature. 2014;511:428–434. doi: 10.1038/nature13379. [DOI] [PMC free article] [PubMed] [Google Scholar]
- Olsen R.R., Ireland A.S., Kastner D.W., Groves S.M., Spainhower K.B., Pozo K., Kelenis D.P., Whitney C.P., Guthrie M.R., Wait S.J. ASCL1 represses a SOX9(+) neural crest stem-like state in small cell lung cancer. Genes Dev. 2021;35:847–869. doi: 10.1101/gad.348295.121. [DOI] [PMC free article] [PubMed] [Google Scholar]
- Osborne J.K., Guerra M.L., Gonzales J.X., McMillan E.A., Minna J.D., Cobb M.H. NeuroD1 mediates nicotine-induced migration and invasion via regulation of the nicotinic acetylcholine receptor subunits in a subset of neural and neuroendocrine carcinomas. Mol. Biol. Cell. 2014;25:1782–1792. doi: 10.1091/mbc.E13-06-0316. [DOI] [PMC free article] [PubMed] [Google Scholar]
- Osborne J.K., Larsen J.E., Shields M.D., Gonzales J.X., Shames D.S., Sato M., Kulkarni A., Wistuba I.I., Girard L., Minna J.D., Cobb M.H. NeuroD1 regulates survival and migration of neuroendocrine lung carcinomas via signaling molecules TrkB and NCAM. Proc. Natl. Acad. Sci. U S A. 2013;110:6524–6529. doi: 10.1073/pnas.1303932110. [DOI] [PMC free article] [PubMed] [Google Scholar]
- Ouadah Y., Rojas E.R., Riordan D.P., Capostagno S., Kuo C.S., Krasnow M.A. Rare pulmonary neuroendocrine cells are stem cells regulated by Rb, p53, and notch. Cell. 2019;179:403–416.e423. doi: 10.1016/j.cell.2019.09.010. [DOI] [PMC free article] [PubMed] [Google Scholar]
- Park J.W., Lee J.K., Sheu K.M., Wang L., Balanis N.G., Nguyen K., Smith B.A., Cheng C., Tsai B.L., Cheng D. Reprogramming normal human epithelial tissues to a common, lethal neuroendocrine cancer lineage. Science. 2018;362:91–95. doi: 10.1126/science.aat5749. [DOI] [PMC free article] [PubMed] [Google Scholar]
- Park K.S., Liang M.C., Raiser D.M., Zamponi R., Roach R.R., Curtis S.J., Walton Z., Schaffer B.E., Roake C.M., Zmoos A.F. Characterization of the cell of origin for small cell lung cancer. Cell Cycle. 2011;10:2806–2815. doi: 10.4161/cc.10.16.17012. [DOI] [PMC free article] [PubMed] [Google Scholar]
- Peifer M., Fernandez-Cuesta L., Sos M.L., George J., Seidel D., Kasper L.H., Plenker D., Leenders F., Sun R., Zander T. Integrative genome analyses identify key somatic driver mutations of small-cell lung cancer. Nat. Genet. 2012;44:1104–1110. doi: 10.1038/ng.2396. [DOI] [PMC free article] [PubMed] [Google Scholar]
- Poirier J.T., Gardner E.E., Connis N., Moreira A.L., de Stanchina E., Hann C.L., Rudin C.M. DNA methylation in small cell lung cancer defines distinct disease subtypes and correlates with high expression of EZH2. Oncogene. 2015;34:5869–5878. doi: 10.1038/onc.2015.38. [DOI] [PMC free article] [PubMed] [Google Scholar]
- Pozo K., Castro-Rivera E., Tan C., Plattner F., Schwach G., Siegl V., Meyer D., Guo A., Gundara J., Mettlach G. The role of Cdk5 in neuroendocrine thyroid cancer. Cancer Cell. 2013;24:499–511. doi: 10.1016/j.ccr.2013.08.027. [DOI] [PMC free article] [PubMed] [Google Scholar]
- Quinlan A.R., Hall I.M. BEDTools: a flexible suite of utilities for comparing genomic features. Bioinformatics. 2010;26:841–842. doi: 10.1093/bioinformatics/btq033. [DOI] [PMC free article] [PubMed] [Google Scholar]
- Raney B.J., Dreszer T.R., Barber G.P., Clawson H., Fujita P.A., Wang T., Nguyen N., Paten B., Zweig A.S., Karolchik D., Kent W.J. Track data hubs enable visualization of user-defined genome-wide annotations on the UCSC Genome Browser. Bioinformatics. 2014;30:1003–1005. doi: 10.1093/bioinformatics/btt637. [DOI] [PMC free article] [PubMed] [Google Scholar]
- Reimand J., Kull M., Peterson H., Hansen J., Vilo J. g:Profiler--a web-based toolset for functional profiling of gene lists from large-scale experiments. Nucleic Acids Res. 2007;35:W193–W200. doi: 10.1093/nar/gkm226. [DOI] [PMC free article] [PubMed] [Google Scholar]
- Roberts A., Pimentel H., Trapnell C., Pachter L. Identification of novel transcripts in annotated genomes using RNA-Seq. Bioinformatics. 2011;27:2325–2329. doi: 10.1093/bioinformatics/btr355. [DOI] [PubMed] [Google Scholar]
- Roberts A., Trapnell C., Donaghey J., Rinn J.L., Pachter L. Improving RNA-Seq expression estimates by correcting for fragment bias. Genome Biol. 2011;12:R22. doi: 10.1186/gb-2011-12-3-r22. [DOI] [PMC free article] [PubMed] [Google Scholar]
- Rosenbloom K.R., Armstrong J., Barber G.P., Casper J., Clawson H., Diekhans M., Dreszer T.R., Fujita P.A., Guruvadoo L., Haeussler M. The UCSC Genome Browser database: 2015 update. Nucleic Acids Res. 2015;43:D670–D681. doi: 10.1093/nar/gku1177. [DOI] [PMC free article] [PubMed] [Google Scholar]
- Rudin C.M., Ismaila N., Hann C.L., Malhotra N., Movsas B., Norris K., Pietanza M.C., Ramalingam S.S., Turrisi A.T., 3rd, Giaccone G. Treatment of small-cell lung cancer: American society of clinical oncology endorsement of the American college of chest physicians guideline. J. Clin. Oncol. 2015;33:4106–4111. doi: 10.1200/JCO.2015.63.7918. [DOI] [PubMed] [Google Scholar]
- Rudin C.M., Poirier J.T., Byers L.A., Dive C., Dowlati A., George J., Heymach J.V., Johnson J.E., Lehman J.M., MacPherson D. Molecular subtypes of small cell lung cancer: a synthesis of human and mouse model data. Nat. Rev. Cancer. 2019;19:289–297. doi: 10.1038/s41568-019-0133-9. [DOI] [PMC free article] [PubMed] [Google Scholar]
- Saint-Andre V., Federation A.J., Lin C.Y., Abraham B.J., Reddy J., Lee T.I., Bradner J.E., Young R.A. Models of human core transcriptional regulatory circuitries. Genome Res. 2016;26:385–396. doi: 10.1101/gr.197590.115. [DOI] [PMC free article] [PubMed] [Google Scholar]
- Schaffer B.E., Park K.S., Yiu G., Conklin J.F., Lin C., Burkhart D.L., Karnezis A.N., Sweet-Cordero E.A., Sage J. Loss of p130 accelerates tumor development in a mouse model for human small-cell lung carcinoma. Cancer Res. 2010;70:3877–3883. doi: 10.1158/0008-5472.CAN-09-4228. [DOI] [PMC free article] [PubMed] [Google Scholar]
- Semenova E.A., Kwon M.C., Monkhorst K., Song J.Y., Bhaskaran R., Krijgsman O., Kuilman T., Peters D., Buikhuisen W.A., Smit E.F. Transcription factor NFIB is a driver of small cell lung cancer progression in mice and marks metastatic disease in patients. Cell Rep. 2016;16:631–643. doi: 10.1016/j.celrep.2016.06.020. [DOI] [PMC free article] [PubMed] [Google Scholar]
- Servant N., Varoquaux N., Lajoie B.R., Viara E., Chen C.J., Vert J.P., Heard E., Dekker J., Barillot E. HiC-Pro: an optimized and flexible pipeline for Hi-C data processing. Genome Biol. 2015;16:259. doi: 10.1186/s13059-015-0831-x. [DOI] [PMC free article] [PubMed] [Google Scholar]
- Shin H.Y. Targeting super-enhancers for disease treatment and diagnosis. Mol. Cells. 2018;41:506–514. doi: 10.14348/molcells.2018.2297. [DOI] [PMC free article] [PubMed] [Google Scholar]
- Subramanian A., Tamayo P., Mootha V.K., Mukherjee S., Ebert B.L., Gillette M.A., Paulovich A., Pomeroy S.L., Golub T.R., Lander E.S., Mesirov J.P. Gene set enrichment analysis: a knowledge-based approach for interpreting genome-wide expression profiles. Proc Natl Acad Sci U S A. 2005;102:15545–15550. doi: 10.1073/pnas.0506580102. [DOI] [PMC free article] [PubMed] [Google Scholar]
- Sueda R., Kageyama R. Regulation of active and quiescent somatic stem cells by Notch signaling. Dev. Growth Differ. 2020;62:59–66. doi: 10.1111/dgd.12626. [DOI] [PMC free article] [PubMed] [Google Scholar]
- Sui P., Wiesner D.L., Xu J., Zhang Y., Lee J., Van Dyken S., Lashua A., Yu C., Klein B.S., Locksley R.M. Pulmonary neuroendocrine cells amplify allergic asthma responses. Science. 2018;360:eaan8546. doi: 10.1126/science.aan8546. [DOI] [PMC free article] [PubMed] [Google Scholar]
- Sur I., Taipale J. The role of enhancers in cancer. Nat. Rev. Cancer. 2016;16:483–493. doi: 10.1038/nrc.2016.62. [DOI] [PubMed] [Google Scholar]
- Sutherland K.D., Proost N., Brouns I., Adriaensen D., Song J.Y., Berns A. Cell of origin of small cell lung cancer: inactivation of Trp53 and Rb1 in distinct cell types of adult mouse lung. Cancer Cell. 2011;19:754–764. doi: 10.1016/j.ccr.2011.04.019. [DOI] [PubMed] [Google Scholar]
- Tang F., Yang Z., Tan Y., Li Y. Super-enhancer function and its application in cancer targeted therapy. NPJ Precision Oncol. 2020;4:2. doi: 10.1038/s41698-020-0108-z. [DOI] [PMC free article] [PubMed] [Google Scholar]
- Thomas P.L., Madubata C.J., Aldrich M.C., Lee M.M., Owonikoko T.K., Minna J.D., Rudin C.M., Sage J., Lovly C.M. A call to action: dismantling racial injustices in preclinical Research and clinical Care of black patients living with small cell lung cancer. Cancer Discov. 2021;11:240–244. doi: 10.1158/2159-8290.CD-20-1592. [DOI] [PMC free article] [PubMed] [Google Scholar]
- Tlemsani C., Pongor L., Elloumi F., Girard L., Huffman K.E., Roper N., Varma S., Luna A., Rajapakse V.N., Sebastian R. SCLC_CellMiner: a resource for small cell lung cancer cell line genomic and pharmacology based on genomic signatures. Cell Rep. 2020;33:108296. doi: 10.1016/j.celrep.2020.108296. [DOI] [PMC free article] [PubMed] [Google Scholar]
- Trapnell C., Hendrickson D.G., Sauvageau M., Goff L., Rinn J.L., Pachter L. Differential analysis of gene regulation at transcript resolution with RNA-seq. Nat. Biotechnol. 2013;31:46–53. doi: 10.1038/nbt.2450. [DOI] [PMC free article] [PubMed] [Google Scholar]
- Trapnell C., Pachter L., Salzberg S.L. TopHat: discovering splice junctions with RNA-Seq. Bioinformatics. 2009;25:1105–1111. doi: 10.1093/bioinformatics/btp120. [DOI] [PMC free article] [PubMed] [Google Scholar]
- Trapnell C., Salzberg S.L. How to map billions of short reads onto genomes. Nat. Biotechnol. 2009;27:455–457. doi: 10.1038/nbt0509-455. [DOI] [PMC free article] [PubMed] [Google Scholar]
- Trapnell C., Williams B.A., Pertea G., Mortazavi A., Kwan G., van Baren M.J., Salzberg S.L., Wold B.J., Pachter L. Transcript assembly and quantification by RNA-Seq reveals unannotated transcripts and isoform switching during cell differentiation. Nat. Biotechnol. 2010;28:511–515. doi: 10.1038/nbt.1621. [DOI] [PMC free article] [PubMed] [Google Scholar]
- Tsherniak A., Vazquez F., Montgomery P.G., Weir B.A., Kryukov G., Cowley G.S., Gill S., Harrington W.F., Pantel S., Krill-Burger J.M. Defining a cancer dependency map. Cell. 2017;170:564–576 e516. doi: 10.1016/j.cell.2017.06.010. [DOI] [PMC free article] [PubMed] [Google Scholar]
- Vaharautio A., Taipale J. Cancer. Cancer by super-enhancer. Science. 2014;346:1291–1292. doi: 10.1126/science.aaa3247. [DOI] [PubMed] [Google Scholar]
- Warnes, G.R., Bolker, B., Bonebakker, L., Gentleman, R., Liaw, W., Lumley, T., Maechler, M., Magnusson, A., Moeller, S., Schwartz, M., et al. (2015). Gplots: Various R Programming Tools for Plotting Data. R Package Version 2.17.0. http://CRAN.R-project.org/package=gplot.
- Whyte W.A., Orlando D.A., Hnisz D., Abraham B.J., Lin C.Y., Kagey M.H., Rahl P.B., Lee T.I., Young R.A. Master transcription factors and mediator establish super-enhancers at key cell identity genes. Cell. 2013;153:307–319. doi: 10.1016/j.cell.2013.03.035. [DOI] [PMC free article] [PubMed] [Google Scholar]
- Wooten D.J., Groves S.M., Tyson D.R., Liu Q., Lim J.S., Albert R., Lopez C.F., Sage J., Quaranta V. Systems-level network modeling of Small Cell Lung Cancer subtypes identifies master regulators and destabilizers. PLoS Comput. Biol. 2019;15:e1007343. doi: 10.1371/journal.pcbi.1007343. [DOI] [PMC free article] [PubMed] [Google Scholar]
- Yamaguchi T., Hosono Y., Yanagisawa K., Takahashi T. NKX2-1/TTF-1: an enigmatic oncogene that functions as a double-edged sword for cancer cell survival and progression. Cancer Cell. 2013;23:718–723. doi: 10.1016/j.ccr.2013.04.002. [DOI] [PubMed] [Google Scholar]
- Zaret K.S., Carroll J.S. Pioneer transcription factors: establishing competence for gene expression. Genes Dev. 2011;25:2227–2241. doi: 10.1101/gad.176826.111. [DOI] [PMC free article] [PubMed] [Google Scholar]
- Zhang W., Girard L., Zhang Y.A., Haruki T., Papari-Zareei M., Stastny V., Ghayee H.K., Pacak K., Oliver T.G., Minna J.D., Gazdar A.F. Small cell lung cancer tumors and preclinical models display heterogeneity of neuroendocrine phenotypes. Transl Lung Cancer Res. 2018;7:32–49. doi: 10.21037/tlcr.2018.02.02. [DOI] [PMC free article] [PubMed] [Google Scholar]
- Zhu S.H., Shan C.J., Wu Z.F., Xu S.Z. Proliferation of small cell lung cancer cell line reduced by knocking-down PROX1 via shRNA in lentivirus. Anticancer Res. 2013;33:3169–3175. [PubMed] [Google Scholar]
Associated Data
This section collects any data citations, data availability statements, or supplementary materials included in this article.
Supplementary Materials
Data Availability Statement
-
•
ChIP-seq and RNA-seq data have been deposited at GEO and are publicly available. Accession numbers are listed in the key resources table.
-
•
This paper analyzes existing, publicly available data. These accession numbers for the datasets are listed in the key resources table.
-
•
This study did not generate new code.
-
•
Any additional information required to reanalyze the data reported in this paper is available from the lead contact upon request.