

Key Points
Question
Has the prevalence of type 1 and type 2 diabetes changed from 2001 to 2017 among those younger than 20 years in the US?
Findings
In this observational, cross-sectional, multicenter study of a mean of 3.47 million youths for each prevalence year from 6 areas in the US, the estimated prevalence of type 1 diabetes among those 19 years or younger increased significantly, from 1.48 per 1000 youths to 2.15 per 1000 youths, and the estimated prevalence of type 2 diabetes among those aged 10 to 19 years increased from 0.34 per 1000 youths to 0.67 per 1000 youths.
Meaning
In 6 areas of the US from 2001 to 2017, the estimated prevalence of diabetes among children and adolescents increased significantly for both type 1 and type 2 diabetes.
Abstract
Importance
Changes in the prevalence of youth-onset diabetes have previously been observed.
Objective
To estimate changes in prevalence of type 1 and type 2 diabetes in youths in the US from 2001 to 2017.
Design, Setting, and Participants
In this cross-sectional observational study, individuals younger than 20 years with physician-diagnosed diabetes were enumerated from 6 areas in the US (4 geographic areas, 1 health plan, and select American Indian reservations) for 2001, 2009, and 2017.
Exposures
Calendar year.
Main Outcomes and Measures
Estimated prevalence of physician-diagnosed type 1 and type 2 diabetes overall and by race and ethnicity, age, and sex.
Results
Among youths 19 years or younger, 4958 of 3.35 million had type 1 diabetes in 2001, 6672 of 3.46 million had type 1 diabetes in 2009, and 7759 of 3.61 million had type 1 diabetes in 2017; among those aged 10 to 19 years, 588 of 1.73 million had type 2 diabetes in 2001, 814 of 1.85 million had type 2 diabetes in 2009, and 1230 of 1.85 million had type 2 diabetes in 2017. The estimated type 1 diabetes prevalence per 1000 youths for those 19 years or younger increased significantly from 1.48 (95% CI, 1.44-1.52) in 2001 to 1.93 (95% CI, 1.88-1.98) in 2009 to 2.15 (95% CI, 2.10-2.20) in 2017, an absolute increase of 0.67 per 1000 youths (95%, CI, 0.64-0.70) and a 45.1% (95% CI, 40.0%-50.4%) relative increase over 16 years. The greatest absolute increases were observed among non-Hispanic White (0.93 per 1000 youths [95% CI, 0.88-0.98]) and non-Hispanic Black (0.89 per 1000 youths [95% CI, 0.88-0.98]) youths. The estimated type 2 diabetes prevalence per 1000 youths aged 10 to 19 years increased significantly from 0.34 (95% CI, 0.31-0.37) in 2001 to 0.46 (95% CI, 0.43-0.49) in 2009 to 0.67 (95% CI, 0.63-0.70) in 2017, an absolute increase of 0.32 per 1000 youths (95% CI, 0.30-0.35) and a 95.3% (95% CI, 77.0%-115.4%) relative increase over 16 years. The greatest absolute increases were observed among non-Hispanic Black (0.85 per 1000 youths [95% CI, 0.74-0.97]) and Hispanic (0.57 per 1000 youths [95% CI, 0.51-0.64]) youths.
Conclusions and Relevance
In 6 areas of the US from 2001 to 2017, the estimated prevalence of diabetes among children and adolescents increased for both type 1 and type 2 diabetes.
This cross-sectional study uses data from 6 areas in the US from 2001, 2009, and 2017 to examine whether differences exist in observed trends in youth-onset diabetes prevalence by diabetes type, race and ethnicity, age, and sex.
Introduction
Youth-onset type 1 and type 2 diabetes are serious chronic health conditions. Individuals with youth-onset diabetes are at risk for early complications, comorbidities, and excess mortality, particularly those who develop type 2 diabetes and those from racial and ethnic minority groups.1,2 The SEARCH for Diabetes in Youth Study reported increases in the prevalence of type 1 diabetes and type 2 diabetes from 2001 to 20093 and estimated that there were 187 246 US youths 19 years or younger with diabetes in 2009.4 In an article published in 2020, data from the SEARCH study demonstrated increases in the incidence of type 1 and type 2 diabetes in the US from 2002 through 2015.5 Although non-Hispanic White (hereafter referred to as White) youths (aged 19 years or younger) have the highest type 1 diabetes incidence, larger relative percent increases in incidence were observed among non-Hispanic Black (hereafter referred to as Black) and Hispanic youths from 2002 through 2015 and among Asian or Pacific Islander youths from 2011 through 2015 compared with White youths. American Indian and Black youths aged 10 to 19 years had the highest type 2 diabetes incidence. Significant increases in type 2 diabetes incidence were observed among American Indian, Asian or Pacific Islander, Black, and Hispanic youths.5
To monitor trends in youth-onset diabetes prevalence, data for 2001, 2009, and 2017 were analyzed to establish whether there were differences in any observed trends by diabetes type, race and ethnicity, age, and sex. Elucidating differences in diabetes prevalence trends by diabetes type and demographic characteristics is essential to describe the burden of disease and to estimate current and future resource needs.
Methods
The methods,6 incidence rates (2002-2015),5,7and prevalence estimates (2001 and 2009)3,4,8 for the SEARCH study have been previously published. Changes in estimated prevalence between 2001, 2009, and 2017, the 3 years for which prevalence was assessed in this study, were described in the current study. Case ascertainment was conducted under a Health Insurance Portability and Accountability Act Privacy Rule waiver of consent approved by the institutional review board(s) with jurisdiction for each of the clinical centers and the data coordinating center.
Data were collected from clinical centers located in 6 areas: California (Kaiser Permanente Southern California members in 7 counties, including Los Angeles), Colorado (residents of 14 counties, including Denver), Ohio (residents of 8 counties, including Cincinnati), South Carolina (residents of 4 counties, including Columbia), Washington State (residents of 5 counties, including Seattle), and (coordinated by the Colorado center) Indian Health Services users in select areas of Arizona and New Mexico.
Case Ascertainment
Methods of type 1 diabetes and type 2 diabetes case ascertainment and prevalence estimation were the same in the 3 periods and included an additional 22-month window of ascertainment after the end of each prevalence year. Eligible individuals included those younger than 20 years at the end of the prevalent years (ie, December 31, 2001; December 31, 2009; and December 31, 2017) with physician-diagnosed diabetes who were residing in the geographic study areas, Kaiser Permanente Southern California members, or Indian Health Services enrollees during the prevalence year. Active-duty military personnel and individuals who were institutionalized were ineligible for inclusion.
Active surveillance networks for the 5 clinical centers were composed of pediatric and adult endocrinologists and other clinicians, hospitals, and health plans in the study areas. Potential youths with diabetes identified using International Classification of Diseases, Ninth Revision or International Classification of Diseases, Tenth Revision diagnosis codes, based on prescription medications used to manage diabetes, or from laboratory values indicative of diabetes were validated by verifying the diagnosis of diabetes and date of diagnosis in the clinical notes of the medical record, direct physician confirmation, or presence of these case reports in clinical diabetes databases that required physician verification for inclusion.
Race and ethnicity were examined in this study because of their association with diabetes prevalence.3,4 Race and ethnicity were based primarily on self-reported information collected on a short survey administered to parents or guardians of children younger than 18 years and adults 18 years or older using the 2000 US census race and ethnicity categories, with medical records serving as the secondary source. When both sources were missing, race and ethnicity were imputed based on the racial and ethnic distribution of the residents of their census track in the prevalent year. Clinician-reported diabetes type was obtained from medical records via manual review. Sex and date of birth were obtained primarily from self-report, with medical records serving as the secondary source.
Population Denominators
The denominators for the geographically based sites were the 2001, 2009, and 2017 bridged-race intercensal population estimates (vintage 2018) by race and ethnicity, age, and sex.9 Counts of active-duty military personnel were removed. For Kaiser Permanente Southern California, addresses of members were geocoded to the census block level and race and ethnicity–specific proportions of the population in the census blocks were applied to these counts to estimate the racial and ethnic composition of the membership by sex and age in 1-year increments for each prevalence year.10 Users of the Indian Health Services for the 3 years preceding the prevalence years were counted to define the American Indian study population in the select areas. Race and ethnicity categories included Hispanic ethnicity (regardless of race); race-bridging methods9 were then applied to multiracial youths (those who were not Hispanic and self-reported as 2 or more races) to determine the probability of belonging to each of the 4 racial groups. The 5 race and ethnicity categories were American Indian, Asian or Pacific Islander, Black, Hispanic (regardless of race), and White. All race categories included only individuals who were not Hispanic.
Outcomes
The primary outcome was the estimated prevalence of type 1 diabetes and type 2 diabetes per 1000 youths and accompanying 95% CIs in 2001, 2009, and 2017 overall (total sample) and individually stratified by race and ethnicity, age category, and sex. The secondary outcomes were the estimated prevalence of type 1 diabetes and type 2 diabetes simultaneously stratified by race and ethnicity, age category, and sex.
Comparison of Physician-Assigned Diabetes Type and Etiologic Type
Physician-assigned diabetes type was compared with an etiologic assessment of diabetes type. Etiologic type 1 diabetes was defined as the presence of at least 1 autoantibody (glutamic acid decarboxylase, insulinoma-associated, or zinc transporter 8 autoantibody) or being insulin sensitive in the absence of diabetes autoantibodies, and type 2 diabetes was defined by insulin resistance in the absence of diabetes autoantibodies.11,12,13,14 In-person study visits, including blood collection, were conducted for some prevalent cases in 2001 but were not conducted for prevalent cases in 2009 or 2017. Therefore, antibody test results and insulin sensitivity/resistance assessed for individuals with incident diabetes in 2002, 2008, and 2016 who completed an in-person study visit were used as a proxy to estimate the concordance between physician-assigned diabetes type and etiologic type for each of the 3 adjacent prevalent years.
Statistical Analyses
Estimated prevalence was expressed as diabetes cases per 1000 youths with 95% CIs. Both the numerators (number of cases) and denominators (total population) were aggregated across the 6 areas from 5 clinical centers prior to calculating the estimated prevalence. Type 1 diabetes prevalence was reported in 4 age groups and type 2 diabetes prevalence was reported in 2 age groups, because the number of children 9 years or younger with type 2 diabetes was insufficient to calculate prevalence. Differences between prevalence estimates were calculated for 8-year intervals (2001-2009 and 2009-2017) and for the 16-year period (2001-2017) using a 2-sided skew-corrected inverted-score test assuming a binomial distribution.15 An unadjusted Poisson model using the prevalence years as a categorical variable was used to test whether 2009 prevalence was the midpoint of 2001 and 2017 prevalence. Annual percent change was calculated for each interval using the parameter estimates (β) from a continuous measure of time included in Poisson models estimating prevalence. Assuming linear trends and a significance level of 5%, initial power analyses conducted before the 2017 prevalence data were observed suggested that there was 90% power to detect changes in prevalence of 0.04 per 1000 youths for type 1 diabetes and 0.28 per 1000 youths for type 2 diabetes. In the exploratory analysis of the joint associations of race and ethnicity, age, and sex with diabetes prevalence (secondary outcome), P values with 2 degrees of freedom were used to test for significant differences among the 3 prevalent years.
Comparisons between etiologic type based on presence of diabetes autoantibodies and insulin sensitivity and clinician type for 3 three incident years were done using Fisher exact tests. The number and percent of cases in agreement with etiologic type were reported.
All tests were 2-sided, P < .05 was considered significant, and 95% CIs were reported for all prevalence estimates and differences in these estimates. All analyses were done using SAS, version 9.4 (SAS Institute).
Results
Among youths (mean of 3.47 million youths for each prevalence year from 6 areas in the US) 19 years or younger, 4958 of a total population of 3.35 million had type 1 diabetes in 2001, 6672 of 3.46 million had type 1 diabetes in 2009, and 7759 of 3.61 million had type 1 diabetes in 2017 (Table 1). Among youths aged 10 to 19 years, 588 of 1.73 million had type 2 diabetes in 2001, 814 of 1.78 million had type 2 diabetes in 2009, and 1230 of 1.85 million had type 2 diabetes in 2017. Children 9 years or younger with type 2 diabetes were excluded from the analysis because of the small sample sizes (n = 5 in 2001; n = 18 in 2009; n = 8 in 2017). Race and ethnicity data were not available from self-report or medical records for 4.5% of those with type 1 or type 2 diabetes in 2001, 3.0% of those with type 1 or type 2 diabetes in 2009, and 2.1% those with type 1 or type 2 diabetes in 2017.
Table 1. Prevalence of Type 1 and Type 2 Diabetes per 1000 Youths in 2001, 2009, and 2017.
| Characteristica | 2001 | 2009 | 2017 | |||
|---|---|---|---|---|---|---|
| No. of cases/total population | Prevalence per 1000 youths (95% CI) | No. of cases/total population | Prevalence per 1000 youths (95% CI) | No. of cases/total population | Prevalence per 1000 youths (95% CI) | |
| Type 1 diabetes | 4958/3 345 783 | 1.48 (1.44-1.52) | 6672/3 458 974 | 1.93 (1.88-1.98) | 7759/3 608 044 | 2.15 (2.10-2.20) |
| Age, y | ||||||
| ≤4 | 217/787 251 | 0.28 (0.24-0.31) | 241/832 791 | 0.29 (0.26-0.33) | 239/861 656 | 0.28 (0.24-0.31) |
| 5-9 | 977/832 686 | 1.17 (1.10-1.25) | 1145/844 923 | 1.36 (1.28-1.44) | 1195/897 489 | 1.33 (1.26-1.41) |
| 10-14 | 1727/885 604 | 1.95 (1.86-2.04) | 2336/867 403 | 2.69 (2.59-2.80) | 2687/923 366 | 2.91 (2.80-3.02) |
| 15-19 | 2037/840 242 | 2.42 (2.32-2.53) | 2950/913 857 | 3.23 (3.11-3.35) | 3638/925 533 | 3.93 (3.81-4.06) |
| Race and ethnicityb | ||||||
| American Indian | 37/123 303 | 0.30 (0.22-0.42) | 42/120 212 | 0.35 (0.26-0.47) | 56/98 533 | 0.56 (0.43-0.73) |
| Asian or Pacific Islander | 107/212 708 | 0.50 (0.42-0.61) | 157/260 846 | 0.60 (0.52-0.70) | 254/335 683 | 0.76 (0.67-0.85) |
| Black | 471/365 146 | 1.29 (1.18-1.41) | 626/383 198 | 1.63 (1.51-1.77) | 868/398 200 | 2.18 (2.04-2.33) |
| Hispanic | 624/647 656 | 0.96 (0.89-1.04) | 1039/809 267 | 1.28 (1.21-1.36) | 1475/947 365 | 1.56 (1.48-1.64) |
| White | 3718/1 996 971 | 1.86 (1.80-1.92) | 4807/1 885 451 | 2.55 (2.48-2.62) | 5107/1 828 263 | 2.79 (2.72-2.87) |
| Sex | ||||||
| Female | 2420/1 635 589 | 1.48 (1.42-1.54) | 3268/1 692 112 | 1.93 (1.87-2.00) | 3721/1 765 715 | 2.11 (2.04-2.18) |
| Male | 2538/1 710 194 | 1.48 (1.43-1.54) | 3404/1 766 862 | 1.93 (1.86-1.99) | 4038/1 842 329 | 2.19 (2.13-2.26) |
| Type 2 diabetes | 588/1 725 846 | 0.34 (0.31-0.37) | 814/1 781 260 | 0.46 (0.43-0.49) | 1230/1 848 899 | 0.67 (0.63-0.70) |
| Age, y | ||||||
| 10-14 | 136/885 604 | 0.15 (0.13-0.18) | 195/867 403 | 0.22 (0.20-0.26) | 266/923 366 | 0.29 (0.26-0.32) |
| 15-19 | 452/840 242 | 0.54 (0.49-0.59) | 619/913 857 | 0.68 (0.63-0.73) | 964/925 533 | 1.04 (0.98-1.11) |
| Race and ethnicityb | ||||||
| American Indian | 78/64 327 | 1.22 (0.98-1.52) | 70/62 573 | 1.12 (0.89-1.42) | 83/50 558 | 1.63 (1.32-2.03) |
| Asian or Pacific Islander | 39/110 560 | 0.35 (0.26-0.48) | 45/133 455 | 0.34 (0.25-0.45) | 102/173 214 | 0.59 (0.49-0.72) |
| Black | 177/186 637 | 0.95 (0.82-1.10) | 205/196 723 | 1.04 (0.91-1.20) | 359/199 521 | 1.80 (1.62-2.00) |
| Hispanic | 144/318 238 | 0.45 (0.39-0.53) | 322/402 691 | 0.80 (0.72-0.89) | 503/489 527 | 1.03 (0.94-1.12) |
| White | 149/1 046 084 | 0.14 (0.12-0.17) | 172/985 818 | 0.17 (0.15-0.20) | 183/936 079 | 0.20 (0.17-0.23) |
| Sex | ||||||
| Female | 356/843 168 | 0.42 (0.38-0.47) | 504/871 465 | 0.58 (0.53-0.63) | 745/905 028 | 0.82 (0.77-0.88) |
| Male | 232/882 678 | 0.26 (0.23-0.30) | 310/909 795 | 0.34 (0.30-0.38) | 485/943 871 | 0.51 (0.47-0.56) |
Diabetes type was based on assessment of the physician in the prevalent year abstracted from the medical records.
The Hispanic category includes all Hispanic individuals regardless of race (American Indian, Asian or Pacific Islander, Black, or White). All race categories include only individuals who are not Hispanic.
Estimated Prevalence Trends for Type 1 Diabetes
The estimated type 1 diabetes prevalence per 1000 youths for those 19 years or younger increased significantly from 1.48 (95% CI, 1.44-1.52) in 2001 to 1.93 (95% CI, 1.88-1.98) in 2009 to 2.15 (95% CI, 2.10-2.20) in 2017 (Table 1), which represented a significant absolute increase of 0.67 per 1000 youths (95%, CI, 0.64-0.70) and a 45.1% (95% CI, 40.0%-50.4%) relative increase over 16 years (Table 2). Overall, the annual percent change was 3.4% (95% CI, 2.9%-3.8%) in the first interval (2001-2009) and 1.4% (95% CI, 1.0%-1.8%) in the second interval (2009-2017); the change was not linear (P < .001). In the first interval, statistically significant increases were observed within each age, race and ethnicity, and sex subgroup, except for those 4 years or younger and American Indian youths. In the second interval, significant increases were observed among those aged 10 to 14 years and those aged 15 to 19 years in each race and ethnicity and sex subgroup. The largest absolute increases in estimated prevalence by race and ethnicity from 2001 to 2017 were among White (0.93 per 1000 [95% CI, 0.88-0.98]) and Black (0.89 per 1000 [95% CI, 0.80-0.99]) youths. Estimated prevalence increases were significantly greater in the first compared with the second interval for both sexes; the annual percent change was 3.4% (95% CI, 2.7%-4.1%) in the first interval compared with 1.1% (95% CI, 0.5%-1.7%) in the second interval for females (P < .001) and 3.3% (95% CI, 2.7%-4.0%) in the first interval compared with 1.6% (95% CI, 1.0%-2.2%) in the second for males (P = .02). The estimated prevalence increases from 2001 to 2017 were not significantly different by sex (0.71 per 1000 [95% CI, 0.66-0.75] for males vs 0.63 per 1000 [95% CI, 0.58-0.67] for females; P = .32).
Table 2. Difference and Annual Percent Change in Prevalence of Type 1 and Type 2 Diabetes Among Youths in 2001, 2009, and 2017.
| Characteristica | Difference in prevalence per 1000 youth (95% CI) | Annual percent change in estimated prevalence (95% CI), % | P value for linear changeb | |||
|---|---|---|---|---|---|---|
| 2001-2009 | 2009-2017 | 2001-2017 | 2001-2009 | 2009-2017 | ||
| Type 1 | 0.45 (0.42 to 0.48) | 0.22 (0.19 to 0.25) | 0.67 (0.64 to 0.70) | 3.4 (2.9 to 3.8) | 1.4 (1.0 to 1.8) | <.001 |
| Age, y | ||||||
| 0-4 | 0.01 (−0.01 to 0.04) | −0.01 (−0.04 to 0.01) | 0.00 (−0.02 to 0.03) | 0.6 (−1.7 to 2.9) | −0.5 (−2.7 to 1.7) | .57 |
| 5-9 | 0.18 (0.13 to 0.24) | −0.02 (−0.08 to 0.03) | 0.16 (0.11 to 0.21) | 1.8 (0.7 to 2.9) | −0.2 (−1.2 to 0.8) | .03 |
| 10-14 | 0.74 (0.67 to 0.81) | 0.22 (0.14 to 0.29) | 0.96 (0.89 to 1.03) | 4.1 (3.3 to 4.9) | 1.0 (0.3 to 1.7) | <.001 |
| 15-19 | 0.80 (0.72 to 0.88) | 0.70 (0.62 to 0.79) | 1.51 (1.42 to 1.59) | 3.6 (2.9 to 4.4) | 2.5 (1.9 to 3.1) | .05 |
| Race and ethnicityc | ||||||
| American Indian | 0.05 (−0.03 to 0.12) | 0.21 (0.12 to 0.30) | 0.26 (0.17 to 0.34) | 1.9 (−3.6 to 7.6) | 6.1 (0.9 to 11.5) | .38 |
| Asian or Pacific Islander | 0.10 (0.03 to 0.16) | 0.15 (0.09 to 0.22) | 0.25 (0.18 to 0.32) | 2.2 (−0.8 to 5.4) | 2.9 (0.3 to 5.4) | .81 |
| Black | 0.35 (0.26 to 0.43) | 0.55 (0.45 to 0.64) | 0.89 (0.80 to 0.99) | 3.0 (1.5 to 4.6) | 3.7 (2.3 to 5.0) | .60 |
| Hispanic | 0.32 (0.26 to 0.37) | 0.27 (0.22 to 0.33) | 0.59 (0.54 to 0.65) | 3.6 (2.4 to 4.9) | 2.4 (1.4 to 3.5) | .23 |
| White | 0.69 (0.64 to 0.73) | 0.24 (0.19 to 0.30) | 0.93 (0.88 to 0.98) | 4.0 (3.5 to 4.6) | 1.1 (0.7 to 1.6) | <.001 |
| Sex | ||||||
| Female | 0.45 (0.41 to 0.50) | 0.18 (0.13 to 0.22) | 0.63 (0.58 to 0.67) | 3.4 (2.7 to 4.1) | 1.1 (0.5 to 1.7) | <.001 |
| Male | 0.44 (0.40 to 0.49) | 0.27 (0.22 to 0.31) | 0.71 (0.66 to 0.75) | 3.3 (2.7 to 4.0) | 1.6 (1.0 to 2.2) | .02 |
| Type 2 | 0.12 (0.10 to 0.14) | 0.21 (0.18 to 0.23) | 0.32 (0.30 to 0.35) | 3.7 (2.4 to 5.1) | 4.8 (3.7 to 6.0) | .34 |
| Age, y | ||||||
| 10-14 | 0.07 (0.05 to 0.09) | 0.06 (0.04 to 0.09) | 0.13 (0.11 to 0.16) | 4.9 (2.0 to 7.8) | 3.1 (0.8 to 5.6) | .46 |
| 15-19 | 0.14 (0.10 to 0.18) | 0.36 (0.32 to 0.41) | 0.50 (0.46 to 0.55) | 2.9 (1.4 to 4.5) | 5.5 (4.2 to 6.9) | .04 |
| Race and ethnicityc | ||||||
| American Indian | −0.09 (−0.29 to 0.09) | 0.51 (0.29 to 0.72) | 0.42 (0.20 to 0.63) | −1.0 (−4.9 to 3.1) | 4.8 (0.7 to 9.0) | .11 |
| Asian or Pacific Islander | −0.02 (−0.09 to 0.05) | 0.26 (0.18 to 0.33) | 0.24 (0.15 to 0.32) | −0.7 (−5.9 to 4.8) | 7.3 (2.7 to 12.1) | .07 |
| Black | 0.10 (0.00 to 0.20) | 0.76 (0.64 to 0.87) | 0.85 (0.74 to 0.97) | 1.2 (−1.3 to 3.8) | 7.1 (4.8 to 9.4) | .007 |
| Hispanic | 0.34 (0.29 to 0.41) | 0.23 (0.17 to 0.29) | 0.57 (0.51 to 0.64) | 7.3 (4.7 to 10.0) | 3.2 (1.4 to 5.0) | .03 |
| White | 0.03 (0.01 to 0.05) | 0.02 (0.00 to 0.04) | 0.05 (0.03 to 0.07) | 2.5 (−0.2 to 5.4) | 1.4 (−1.2 to 4.1) | .64 |
| Sex | ||||||
| Female | 0.16 (0.12 to 0.19) | 0.24 (0.21 to 0.28) | 0.40 (0.36 to 0.44) | 4.0 (2.3 to 5.8) | 4.5 (3.0 to 6.0) | .73 |
| Male | 0.08 (0.05 to 0.10) | 0.17 (0.14 to 0.20) | 0.25 (0.22 to 0.28) | 3.3 (1.1 to 5.5) | 5.3 (3.4 to 7.2) | .27 |
Diabetes type was based on assessment of the physician in the prevalent year abstracted from the medical records.
P value is from an unadjusted Poisson model using the prevalence years as a categorical variable that was used to test whether 2009 was the midpoint of 2001 and 2017 prevalence estimates. A significant P value indicates that the trend is not linear.
The Hispanic category includes all Hispanic individuals regardless of race (White, Black, Asian or Pacific Islander, or American Indian). All race categories include only individuals who are not Hispanic.
Estimated Prevalence Trends for Type 2 Diabetes
The estimated prevalence of type 2 diabetes per 1000 youths for those aged 10 to 19 years increased significantly from 0.34 (95% CI, 0.31-0.37) in 2001 to 0.46 (95% CI, 0.43-0.49) in 2009 to 0.67 (95% CI, 0.63-0.70) in 2017 (Table 1), which represented a significant absolute increase of 0.32 per 1000 youths (95% CI, 0.30-0.35) and a 95.3% (95% CI, 77.0%-115.4%) relative increase over 16 years (Table 2). The annual percent change was 3.7% (95% CI, 2.4%-5.1%) in the first interval and 4.8% (95% CI, 3.7%-6.0%) in the second interval; the change was linear (P = .35). In the first interval, statistically significant increases in the estimated prevalence of type 2 diabetes were observed among White and Hispanic youths, within both age groups, and for both sexes. In the second interval, significant increases in estimated type 2 diabetes prevalence were observed for all subgroups by age, sex, and race and ethnicity, except for White youths.
The greatest absolute increase in the estimated prevalence of type 2 diabetes from 2001 to 2017 was among Black (0.85 per 1000 youths; 95% CI, 0.74 to 0.97) and Hispanic (0.57 per 1000 youths; 95% CI, 0.51 to 0.64) youths. Increases were not linear; Hispanic youths had a significantly greater increase in the first interval compared with the second interval (annual percent change, 7.3% [95% CI, 4.7%-10.0%] vs 3.2% [95% CI, 1.4%-5.0%]; P = .03), while Black youths had no significant increase in the first interval and a significant increase in the second interval (annual percent change, 1.2% [95% CI, −1.3% to 3.8%] vs 7.1% [95% CI, 4.8%-9.4%]; P = .007). Significant linear increases were observed in those aged 10 to 14 years, with a significant overall increase in estimated prevalence of 0.13 per 1000 youths (95% CI, 0.11-0.16) from 2001 to 2017. For those aged 15 to 19 years, the increase in estimated prevalence of type 2 diabetes was significantly greater in the second interval (0.36 per 1000 youths [95% CI, 0.32-0.41]) than in the first interval (0.14 per 1000 youths [95% CI, 0.10-0.18]) (P = .04).
Joint Associations of Race and Ethnicity, Age, and Sex
Estimated prevalence and 95% CIs over the 3 periods stratified simultaneously by race and ethnicity, age, sex are shown for type 1 diabetes in Figure 1 and for type 2 diabetes in Figure 2, with all prevalence estimates and 95% CIs shown in eTable 1 and eTable 2 in the Supplement. There was no significant difference in estimated type 1 diabetes prevalence among those aged 4 years or younger across all 3 periods. Significant differences in estimated prevalence between study years were observed among those aged 5 to 9 years for Hispanic females and White males and females and among those aged 10 to 14 years for Asian or Pacific Islander, Black, Hispanic, and White males and American Indian females (Figure 1; eTable 1 in the Supplement).
Figure 1. Estimated Prevalence of Type 1 Diabetes by Race and Ethnicity, Age, and Sex for 2001, 2009, and 2017.
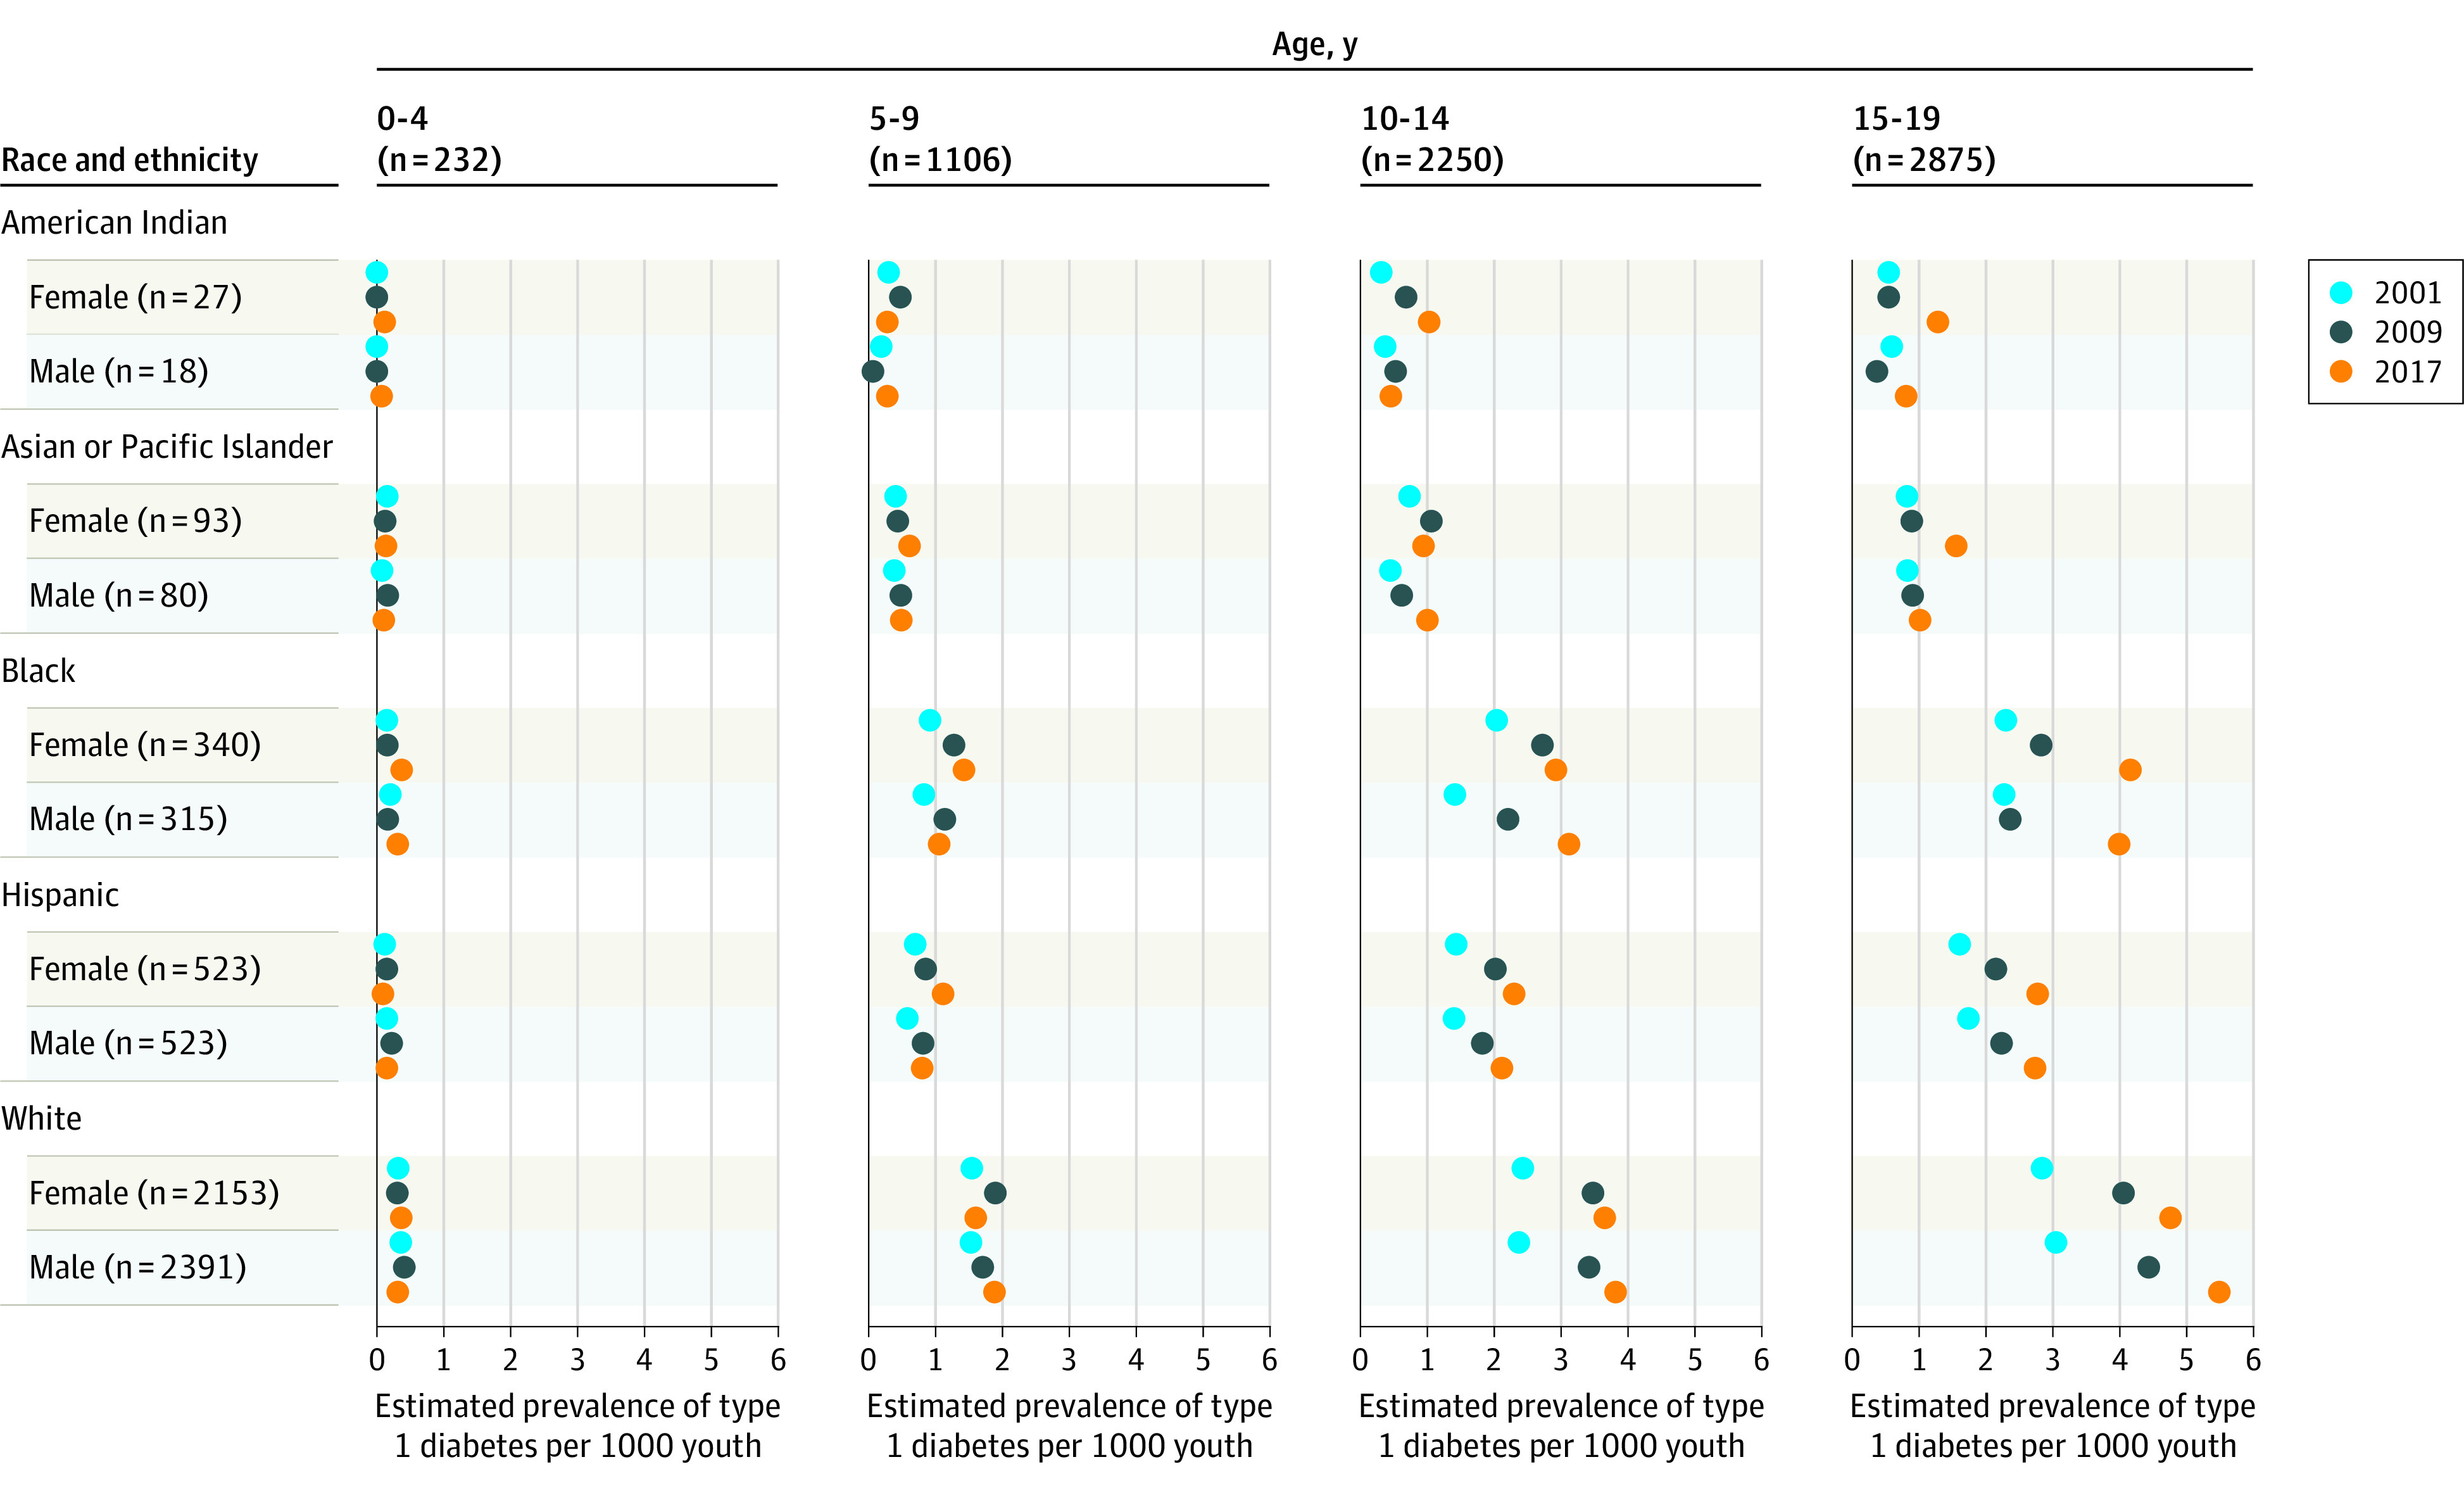
The number for each row is the mean number of youths with diabetes by sex within the race and ethnicity group across the 3 prevalence years. The number for each column is the mean number of youths with diabetes in the specific age group across the 3 prevalence years. The numbers for each group stratified by race and ethnicity, sex, and age group are shown in eTable 1 in the Supplement. The Hispanic category includes all Hispanic individuals regardless of race (American Indian, Asian or Pacific Islander, Black, or White). All race categories include only individuals who are not Hispanic.
Figure 2. Estimated Prevalence of Type 2 Diabetes by Race and Ethnicity, Age, and Sex for 2001, 2009, and 2017.

The number for each row is the mean number of youths with diabetes by sex within the race and ethnicity group across the 3 prevalence years. The number for each column is the mean number of youths with diabetes in the specific age group across the 3 prevalence years. The numbers for each group stratified by race and ethnicity, sex, and age group are shown in eTable 2 in the Supplement. The Hispanic category includes all Hispanic individuals regardless of race (American Indian, Asian or Pacific Islander, Black, or White). All race categories include only individuals who are not Hispanic.
Significant differences in estimated type 2 diabetes prevalence were observed among Black females and males and Hispanic females aged 10 to 14 years, but not among others in this age group (Figure 2; eTable 2 in the Supplement). Among those aged 15 to 19 years, significant differences were observed for females in all race and ethnicity groups, except White females, and for Black, Hispanic, and White males.
Comparison With Etiologic Type
There were no significant differences between etiologic type and physician’s diagnosis of type 1 diabetes overall or by age, sex, or race and ethnicity subgroup or for type 2 diabetes overall (Table 3). However, among White participants with physician-diagnosed type 2 diabetes, the percentage of participants who met criteria for etiologic type in 2002 (50.0%) was significantly lower than the other 2 incident years (85.7% [P = .03] for 2009 and 86.2% [P = .02] for 2017). No significant differences were observed for other race and ethnicity groups. Significant differences were observed among those aged 10 to 14 years in 2002 vs 2008 (P = .03) and among males in 2002 vs 2016 (P = .03). No significant differences were observed for those aged 15 to 19 years or for females.
Table 3. Incident Diabetes Cases That Met Etiological Criteria in the Incident Years (2002, 2008, and 2016) Closest to the Prevalent Yearsa.
| Characteristic | No. (%) of youthsb | P valuec | ||||
|---|---|---|---|---|---|---|
| 2002 | 2008 | 2016 | 2002 vs 2008 | 2008 vs 2016 | 2002 vs 2016 | |
| Clinical diabetes type 1 | ||||||
| All (aged ≤19 y) | 411 (96.0) | 624 (96.4) | 401 (94.4) | .74 | .13 | .27 |
| Age at diagnosis, y | ||||||
| 0-4 | 58 (100) | 98 (100) | 35 (100) | NA | NA | NA |
| 5-9 | 155 (98.1) | 223 (98.7) | 142 (97.9) | .69 | .68 | >.99 |
| 10-14 | 148 (94.3) | 221 (94.4) | 159 (93.0) | >.99 | .54 | .66 |
| 15-19 | 50 (90.9) | 82 (92.1) | 65 (87.8) | .77 | .43 | .78 |
| Race and ethnicityd | ||||||
| American Indian | 1 (33.3) | 1 (100) | 0 | >.99 | >.99 | >.99 |
| Asian or Pacific Islander | 7 (87.5) | 11 (100) | 18 (100) | .42 | NA | .31 |
| Black | 37 (94.9) | 53 (85.5) | 94 (92.2) | .20 | .19 | .73 |
| Hispanic | 37 (92.5) | 98 (94.2) | 128 (92.1) | .71 | .62 | >.99 |
| White | 328 (97.6) | 458 (98.3) | 160 (97.6) | .61 | .52 | >.99 |
| Othere | 1 (50.0) | 3 (100) | 1 (100) | .40 | NA | >.99 |
| Sex | ||||||
| Female | 190 (93.6) | 288 (95.4) | 194 (93.7) | .42 | .43 | >.99 |
| Male | 221 (98.2) | 336 (97.4) | 207 (95.0) | .58 | .16 | .07 |
| Clinical diabetes type 2 | ||||||
| All (aged 10-19 y) | 52 (73.2) | 84 (84.8) | 164 (84.1) | .08 | >.99 | .05 |
| Age at diagnosis, y | ||||||
| 10-14 | 27 (64.3) | 42 (85.7) | 69 (76.7) | .03 | .27 | .15 |
| 15-19 | 25 (86.2) | 42 (84.0) | 95 (90.5) | >.99 | .29 | .50 |
| Race and ethnicityd | ||||||
| American Indian | 9 (81.8) | 9 (81.8) | 9 (75.0) | >.99 | >.99 | >.99 |
| Asian or Pacific Islander | 1 (100.0) | 1 (100.0) | 6 (85.7) | NA | >.99 | >.99 |
| Black | 19 (79.2) | 29 (90.6) | 74 (86.0) | .27 | .76 | .52 |
| Hispanic | 14 (82.4) | 27 (79.4) | 50 (82.0) | >.99 | .79 | >.99 |
| White | 9 (50.0) | 18 (85.7) | 25 (86.2) | .03 | >.99 | .02 |
| Sex | ||||||
| Female | 34 (85.0) | 52 (89.7) | 101 (87.8) | .54 | .81 | .60 |
| Male | 18 (58.1) | 32 (78.0) | 63 (78.8) | .08 | >.99 | .03 |
Abbreviation: NA, not applicable.
Etiological criteria for type 1 diabetes: presence of 1 or more diabetes autoantibodies (glutamic acid decarboxylase antibody, zinc transporter 8 antibody or insulinoma associated antibody) using harmonized assays or antibody-negative and insulin-sensitive based on a clamp validated index; type 2 diabetes: no evidence of diabetes autoimmunity and presence of insulin resistance.
The number and percentage who completed the SEARCH visit that met etiologic criteria.
P value is for the comparison of the percent meeting the etiologic type criteria for the years shown.
The Hispanic category includes all Hispanic individuals regardless of race (American Indian, Asian or Pacific Islander, Black, Hispanic, and White). All race categories only include individuals who are not Hispanic.
Other includes both missing (n = 2) and multiple races reported (n = 3).
Discussion
In 6 regions in the US, significant increases in the estimated prevalence of type 1 diabetes and type 2 diabetes were observed from 2001 to 2017. Although the percentage increase in prevalence was greater for type 2 diabetes, the absolute prevalence increase was greater for type 1 diabetes, which remains more common than type 2 diabetes in youth. The absolute increases in the estimated prevalence of type 1 diabetes were greatest among Black and White youths. Type 2 diabetes remained more common among racial and ethnic minority youths, with the absolute increases in estimated type 2 diabetes prevalence being greatest among Black youth and Hispanic youth.
Estimates of type 1 diabetes prevalence based on US MarketScan Multi-State data for those younger than 18 years were 1.29 per 1000 Medicaid recipients and 1.48 per 1000 commercially insured youths for 2002, 2.04 per 1000 Medicaid recipients and 2.10 per 1000 commercially insured youths for 2009, and 2.34 per 1000 Medicaid recipients and 2.32 per 1000 commercially insured youths for 2016.16,17 These estimates were similar to the findings from the current study. Moreover, the US MarketScan data and findings from the current study highlight that the highest estimated prevalence of type 1 diabetes was among White youths, with the next highest estimates among Black youths. A study from the Netherlands reported a significant increase in prevalence of type 1 diabetes from approximately 1.0 per 1000 youths younger than 20 years to 1.5 per 1000 youths younger than 20 years from 1998 to 2011, with a significant annual percent change of 3.8% during this period,18 which is similar to the 3.4% annual percent change in the comparable period (2001-2009) for the current study.
In contrast with the present study, which yielded type 2 diabetes prevalence estimates ranging from 0.34 to 0.67 per 1000 youths for the 3 years for which prevalence was assessed and a doubling of prevalence in 16 years, a study conducted in China among those aged 7 to 17 years yielded type 2 diabetes prevalence estimates of 2.4 per 1000 youths in 2002 and 5.2 per 1000 youths in 2012.19 The US MarketScan multistate data yielded prevalence per 1000 youths of 0.70 in 2002, 2.21 in 2009, and 2.12 in 2016, which represents an absolute increase of 1.42 per 1000 youths, or 200%, in 14 years.16 The type 2 diabetes prevalence in the latter study was highest in the oldest age group (12-17 years), among Black participants, and among female participants, which mirrors the findings from the current study. A Canadian study reported an increase in the prevalence of type 2 diabetes among First Nations youths younger than 20 years from 1.7 per 1000 youths in 1995 to 5.7 per 1000 youths in 2015, an absolute increase of 4.0 per 1000 youths, or 235%, over 20 years.20 In these 3 studies, the type 2 diabetes prevalence estimates were higher than the current study, but the prevalence approximately doubled over the observation period in each study. Reports of type 2 diabetes prevalence in individuals younger than 20 years in a German study ranged from 0.23 to 0.24 per 1000 youths from 2004 to 2016,21 while prevalence of type 2 diabetes in 2012 to 2013 in the UK for those younger than 16 years (0.03 per 1000 youths) were both much lower than in the current study, although race and ethnicity variation in prevalence was observed in the UK study.22
Increases in prevalence can be driven by increased incidence, declining mortality, or both. The SEARCH study recently reported significant increases in the incidence of type 1 and type 2 diabetes from 2002 to 2015, which is likely a driver of increasing prevalence in the US.5 Steeper increases in age- and sex-adjusted incidence of type 1 diabetes from 2002 to 2015 were seen among Black and Hispanic individuals than among White individuals, which likely contributed to the narrowing in the prevalence gap by race and ethnicity. Although the etiology of type 1 diabetes is unknown, environmental factors (infectious and mucosal exposures in the first 2 years of life) interacting with type 1 diabetes susceptibility genes appear to play a role.23,24,25,26,27,28,29 Increases in type 2 diabetes incidence is a likely driver of increasing prevalence of type 2 diabetes. Changes in anthropometric risk factors appear to play a significant role. Specifically, childhood obesity increased from 13.9% in 1999-2000 to 18.5% in 2015-2016.30 Black and Mexican American teenagers experienced the greatest increase in prevalence of obesity/severe obesity from 1999 to 2018, which may contribute to race and ethnicity differences.31 Other contributing factors may include increases in exposure to maternal obesity and diabetes (gestational and type 2 diabetes)32,33 and exposure to environmental chemicals.34,35
Increasing awareness of type 2 diabetes in youth may have led to different screening practices that may also have contributed to the increases. In the current study, the diagnosis and classification of diabetes type were both based on physician report as part of clinical care. Although a change in diagnostic criteria to include hemoglobin A1c of at least 6.5% in the diagnostic criteria for adults was recommended by the American Diabetes Association in 2010,36 data for adolescents suggest that this recommendation is controversial. Expert pediatric groups do not recommend using hemoglobin A1c alone to diagnosis diabetes.37,38,39 Thus, it is unlikely that the introduction of hemoglobin A1c into the diagnostic criteria in adults had an influence on the prevalence in 2017.
Considering the entire 16-year period, the differences in estimated type 1 diabetes prevalence from 2001 to 2017 equated to 0.72 to 1.70 additional cases per 1000 Black, Hispanic, and White individuals. Prevalence differences in the second interval (2009-2017) exceeded 0.5 additional cases per 1000 individuals among Black, Hispanic, and White females and males and American Indian and Asian or Pacific Islander females. Translating the difference in estimated type 2 diabetes prevalence from 2001 to 2017 into additional cases indicated that Black and Hispanic females aged 15 to 19 years experienced an estimated increase of more than 1 additional case per 1000 females.
Limitations
This study has several limitations. First, only individuals with diagnosed diabetes were included, which missed those with undiagnosed type 2 diabetes; however, the number of individuals missed for this reason was likely small.40 Undiagnosed cases were less likely among those with type 1 diabetes due to symptom severity at onset. Second, there were relatively small numbers of individuals in some race and ethnicity groups, particularly American Indian and Asian or Pacific Islander, reducing precision of these prevalence estimates and the ability to identify trends, if present, for these groups. Third, the correspondence between physician-assigned type 2 diabetes and etiologic type was lower than for type 1 diabetes and lower in 2002 than in subsequent years, particularly for White individuals. Fourth, because 2017 was the last year of prevalent case ascertainment in this study, it is uncertain whether the findings from 2017 reflect the prevalence in 2021. Fifth, although the data in this study were collected from 6 geographic regions of the US and the populations were racially and ethnically diverse, the 2020 census data were not available for comparison with the 2017 sample and the comparisons for 2001 with the 2000 census and 2009 with the 2010 census showed underrepresentation of Black youths and overrepresentation of Asian and Pacific Islander youths.2
Conclusions
In 6 areas of the US from 2001 to 2017, the estimated prevalence of diabetes among children and adolescents increased for both type 1 diabetes and type 2 diabetes.
eTable 1. Estimated prevalence of type 1 diabetesa per 1,000 youth (95% CI) ages 0-19 years in 2001, 2009, and 2017, simultaneously stratified by race/ethnicity, age category, and sex: The SEARCH for Diabetes in Youth Study
eTable 2. Estimated prevalence of type 2 diabetes per 1000 youth (95% CI) ages 10-19 years in 2001, 2009, and 2017, simultaneously stratified by race/ethnicity, age category and sex: The SEARCH for Diabetes in Youth Study
References
- 1.Dabelea D, Stafford JM, Mayer-Davis EJ, et al. ; SEARCH for Diabetes in Youth Research Group . Association of type 1 diabetes vs type 2 diabetes diagnosed during childhood and adolescence with complications during teenage years and young adulthood. JAMA. 2017;317(8):825-835. doi: 10.1001/jama.2017.0686 [DOI] [PMC free article] [PubMed] [Google Scholar]
- 2.Reynolds K, Saydah SH, Isom S, et al. Mortality in youth-onset type 1 and type 2 diabetes: the SEARCH for Diabetes in Youth study. J Diabetes Complications. 2018;32(6):545-549. doi: 10.1016/j.jdiacomp.2018.03.015 [DOI] [PMC free article] [PubMed] [Google Scholar]
- 3.Dabelea D, Mayer-Davis EJ, Saydah S, et al. ; SEARCH for Diabetes in Youth Study . Prevalence of type 1 and type 2 diabetes among children and adolescents from 2001 to 2009. JAMA. 2014;311(17):1778-1786. doi: 10.1001/jama.2014.3201 [DOI] [PMC free article] [PubMed] [Google Scholar]
- 4.Pettitt DJ, Talton J, Dabelea D, et al. ; SEARCH for Diabetes in Youth Study Group . Prevalence of diabetes in U.S. youth in 2009: the SEARCH for diabetes in youth study. Diabetes Care. 2014;37(2):402-408. doi: 10.2337/dc13-1838 [DOI] [PMC free article] [PubMed] [Google Scholar]
- 5.Divers J, Mayer-Davis EJ, Lawrence JM, et al. Trends in incidence of type 1 and type 2 diabetes among youths—selected counties and Indian reservations, United States, 2002-2015. MMWR Morb Mortal Wkly Rep. 2020;69(6):161-165. doi: 10.15585/mmwr.mm6906a3 [DOI] [PMC free article] [PubMed] [Google Scholar]
- 6.Hamman RF, Bell RA, Dabelea D, et al. ; SEARCH for Diabetes in Youth Study Group . The SEARCH for Diabetes in Youth study: rationale, findings, and future directions. Diabetes Care. 2014;37(12):3336-3344. doi: 10.2337/dc14-0574 [DOI] [PMC free article] [PubMed] [Google Scholar]
- 7.Mayer-Davis EJ, Lawrence JM, Dabelea D, et al. ; SEARCH for Diabetes in Youth Study . Incidence trends of type 1 and type 2 diabetes among youths, 2002-2012. N Engl J Med. 2017;376(15):1419-1429. doi: 10.1056/NEJMoa1610187 [DOI] [PMC free article] [PubMed] [Google Scholar]
- 8.Liese AD, D’Agostino RB Jr, Hamman RF, et al. ; SEARCH for Diabetes in Youth Study Group . The burden of diabetes mellitus among US youth: prevalence estimates from the SEARCH for Diabetes in Youth Study. Pediatrics. 2006;118(4):1510-1518. doi: 10.1542/peds.2006-0690 [DOI] [PubMed] [Google Scholar]
- 9.Ingram DD, Parker JD, Schenker N, et al. United States Census 2000 population with bridged race categories. Vital Health Stat 2. 2003;(135):1-55. [PubMed] [Google Scholar]
- 10.Chen W, Petitti DB, Enger S. Limitations and potential uses of census-based data on ethnicity in a diverse community. Ann Epidemiol. 2004;14(5):339-345. doi: 10.1016/j.annepidem.2003.07.002 [DOI] [PubMed] [Google Scholar]
- 11.Bonifacio E, Yu L, Williams AK, et al. Harmonization of glutamic acid decarboxylase and islet antigen-2 autoantibody assays for national institute of diabetes and digestive and kidney diseases consortia. J Clin Endocrinol Metab. 2010;95(7):3360-3367. doi: 10.1210/jc.2010-0293 [DOI] [PMC free article] [PubMed] [Google Scholar]
- 12.Dabelea D, D’Agostino RB Jr, Mason CC, et al. Development, validation and use of an insulin sensitivity score in youths with diabetes: the SEARCH for Diabetes in Youth study. Diabetologia. 2011;54(1):78-86. doi: 10.1007/s00125-010-1911-9 [DOI] [PMC free article] [PubMed] [Google Scholar]
- 13.Dabelea D, Pihoker C, Talton JW, et al. ; SEARCH for Diabetes in Youth Study . Etiological approach to characterization of diabetes type: the SEARCH for Diabetes in Youth Study. Diabetes Care. 2011;34(7):1628-1633. doi: 10.2337/dc10-2324 [DOI] [PMC free article] [PubMed] [Google Scholar]
- 14.Crume TL, Hamman RF, Isom S, et al. ; SEARCH for Diabetes in Youth Study Group . The accuracy of provider diagnosed diabetes type in youth compared to an etiologic criteria in the SEARCH for Diabetes in Youth Study. Pediatr Diabetes. 2020;21(8):1403-1411. doi: 10.1111/pedi.13126 [DOI] [PMC free article] [PubMed] [Google Scholar]
- 15.Gart JJ, Nam JM. Approximate interval estimation of the difference in binomial parameters: correction for skewness and extension to multiple tables. Biometrics. 1990;46(3):637-643. doi: 10.2307/2532084 [DOI] [PubMed] [Google Scholar]
- 16.Chen Y, Wang T, Liu X, Shankar RR. Prevalence of type 1 and type 2 diabetes among US pediatric population in the MarketScan Multi-State Database, 2002 to 2016. Pediatr Diabetes. 2019;20(5):523-529. doi: 10.1111/pedi.12842 [DOI] [PubMed] [Google Scholar]
- 17.Li L, Jick S, Breitenstein S, Michel A. Prevalence of diabetes and diabetic nephropathy in a large U.S. commercially insured pediatric population, 2002-2013. Diabetes Care. 2016;39(2):278-284. [DOI] [PubMed] [Google Scholar]
- 18.Fazeli Farsani S, Souverein PC, van der Vorst MM, et al. Increasing trends in the incidence and prevalence rates of type 1 diabetes among children and adolescents in the Netherlands. Pediatr Diabetes. 2016;17(1):44-52. doi: 10.1111/pedi.12232 [DOI] [PubMed] [Google Scholar]
- 19.Chi X, Yu D, Ju L, Zhang J, Zhao L. [Prevalence of diabetes and change among 7 to 17 years old children and adolescents in China in 2002-2012]. Wei Sheng Yan Jiu. 2018;47(5):705-715. [PubMed] [Google Scholar]
- 20.Shulman R, Slater M, Khan S, et al. Prevalence, incidence and outcomes of diabetes in Ontario First Nations children: a longitudinal population-based cohort study. CMAJ Open. 2020;8(1):E48-E55. doi: 10.9778/cmajo.20190226 [DOI] [PMC free article] [PubMed] [Google Scholar]
- 21.Neu A, Feldhahn L, Ehehalt S, et al. No change in type 2 diabetes prevalence in children and adolescents over 10 years: update of a population-based survey in South Germany. Pediatr Diabetes. 2018;19(4):637-639. doi: 10.1111/pedi.12622 [DOI] [PubMed] [Google Scholar]
- 22.Khanolkar AR, Amin R, Taylor-Robinson D, Viner R, Warner J, Stephenson T. Ethnic minorities are at greater risk for childhood-onset type 2 diabetes and poorer glycemic control in England and Wales. J Adolesc Health. 2016;59(3):354-361. doi: 10.1016/j.jadohealth.2016.05.012 [DOI] [PubMed] [Google Scholar]
- 23.Lamb MM, Miller M, Seifert JA, et al. The effect of childhood cow’s milk intake and HLA-DR genotype on risk of islet autoimmunity and type 1 diabetes: the Diabetes Autoimmunity Study in the Young. Pediatr Diabetes. 2015;16(1):31-38. doi: 10.1111/pedi.12115 [DOI] [PMC free article] [PubMed] [Google Scholar]
- 24.Norris JM. Infant and childhood diet and type 1 diabetes risk: recent advances and prospects. Curr Diab Rep. 2010;10(5):345-349. doi: 10.1007/s11892-010-0131-5 [DOI] [PMC free article] [PubMed] [Google Scholar]
- 25.Norris JM, Lee HS, Frederiksen B, et al. ; TEDDY Study Group . Plasma 25-hydroxyvitamin D concentration and risk of islet autoimmunity. Diabetes. 2018;67(1):146-154. doi: 10.2337/db17-0802 [DOI] [PMC free article] [PubMed] [Google Scholar]
- 26.Knip M, Virtanen SM, Akerblom HK. Infant feeding and the risk of type 1 diabetes. Am J Clin Nutr. 2010;91(5):1506S-1513S. doi: 10.3945/ajcn.2010.28701C [DOI] [PMC free article] [PubMed] [Google Scholar]
- 27.Rewers M, Hyöty H, Lernmark Å, et al. ; TEDDY Study Group . The Environmental Determinants of Diabetes in the Young (TEDDY) study: 2018 update. Curr Diab Rep. 2018;18(12):136. doi: 10.1007/s11892-018-1113-2 [DOI] [PMC free article] [PubMed] [Google Scholar]
- 28.Ferrat LA, Vehik K, Sharp SA, et al. ; TEDDY Study Group; Committees . A combined risk score enhances prediction of type 1 diabetes among susceptible children. Nat Med. 2020;26(8):1247-1255. doi: 10.1038/s41591-020-0930-4 [DOI] [PMC free article] [PubMed] [Google Scholar]
- 29.Webb-Robertson BM, Bramer LM, Stanfill BA, et al. Prediction of the development of islet autoantibodies through integration of environmental, genetic, and metabolic markers. J Diabetes. 2021;13(2):143-153. doi: 10.1111/1753-0407.13093 [DOI] [PMC free article] [PubMed] [Google Scholar]
- 30.Hales CM, Carroll MD, Fryar CD, Ogden CL. Prevalence of obesity among adults and youth: United States, 2015-2016. NCHS Data Brief. 2017;(288):1-8. [PubMed] [Google Scholar]
- 31.Ogden CL, Fryar CD, Martin CB, et al. Trends in obesity prevalence by race and Hispanic origin—1999-2000 to 2017-2018. JAMA. 2020;324(12):1208-1210. doi: 10.1001/jama.2020.14590 [DOI] [PMC free article] [PubMed] [Google Scholar]
- 32.Deputy NP, Kim SY, Conrey EJ, Bullard KM. Prevalence and changes in preexisting diabetes and gestational diabetes among women who had a live birth: United States, 2012-2016. MMWR Morb Mortal Wkly Rep. 2018;67(43):1201-1207. doi: 10.15585/mmwr.mm6743a2 [DOI] [PMC free article] [PubMed] [Google Scholar]
- 33.Fernandez-Twinn DS, Hjort L, Novakovic B, Ozanne SE, Saffery R. Intrauterine programming of obesity and type 2 diabetes. Diabetologia. 2019;62(10):1789-1801. doi: 10.1007/s00125-019-4951-9 [DOI] [PMC free article] [PubMed] [Google Scholar]
- 34.Thayer KA, Heindel JJ, Bucher JR, Gallo MA. Role of environmental chemicals in diabetes and obesity: a National Toxicology Program workshop review. Environ Health Perspect. 2012;120(6):779-789. doi: 10.1289/ehp.1104597 [DOI] [PMC free article] [PubMed] [Google Scholar]
- 35.Vrijheid M, Fossati S, Maitre L, et al. Early-life environmental exposures and childhood obesity: an exposome-wide approach. Environ Health Perspect. 2020;128(6):67009. doi: 10.1289/EHP5975 [DOI] [PMC free article] [PubMed] [Google Scholar]
- 36.American Diabetes Association . Diagnosis and classification of diabetes mellitus. Diabetes Care. 2010;33(suppl 1):S62-S69. doi: 10.2337/dc10-S062 [DOI] [PMC free article] [PubMed] [Google Scholar]
- 37.Craig ME, Jefferies C, Dabelea D, Balde N, Seth A, Donaghue KC; International Society for Pediatric and Adolescent Diabetes . ISPAD Clinical Practice Consensus Guidelines 2014: definition, epidemiology, and classification of diabetes in children and adolescents. Pediatr Diabetes. 2014;15(suppl 20):4-17. doi: 10.1111/pedi.12186 [DOI] [PubMed] [Google Scholar]
- 38.Zeitler P, Fu J, Tandon N, et al. ; International Society for Pediatric and Adolescent Diabetes . ISPAD Clinical Practice Consensus Guidelines 2014: type 2 diabetes in the child and adolescent. Pediatr Diabetes. 2014;15(suppl 20):26-46. doi: 10.1111/pedi.12179 [DOI] [PubMed] [Google Scholar]
- 39.Mayer-Davis EJ, Kahkoska AR, Jefferies C, et al. ISPAD Clinical Practice Consensus Guidelines 2018: Definition, epidemiology, and classification of diabetes in children and adolescents. Pediatr Diabetes. 2018;19(suppl 27):7-19. doi: 10.1111/pedi.12773 [DOI] [PMC free article] [PubMed] [Google Scholar]
- 40.Kaufman FR, Hirst K, Linder B, et al. ; HEALTHY Study Group . Risk factors for type 2 diabetes in a sixth- grade multiracial cohort: the HEALTHY study. Diabetes Care. 2009;32(5):953-955. doi: 10.2337/dc08-1774 [DOI] [PMC free article] [PubMed] [Google Scholar]
Associated Data
This section collects any data citations, data availability statements, or supplementary materials included in this article.
Supplementary Materials
eTable 1. Estimated prevalence of type 1 diabetesa per 1,000 youth (95% CI) ages 0-19 years in 2001, 2009, and 2017, simultaneously stratified by race/ethnicity, age category, and sex: The SEARCH for Diabetes in Youth Study
eTable 2. Estimated prevalence of type 2 diabetes per 1000 youth (95% CI) ages 10-19 years in 2001, 2009, and 2017, simultaneously stratified by race/ethnicity, age category and sex: The SEARCH for Diabetes in Youth Study