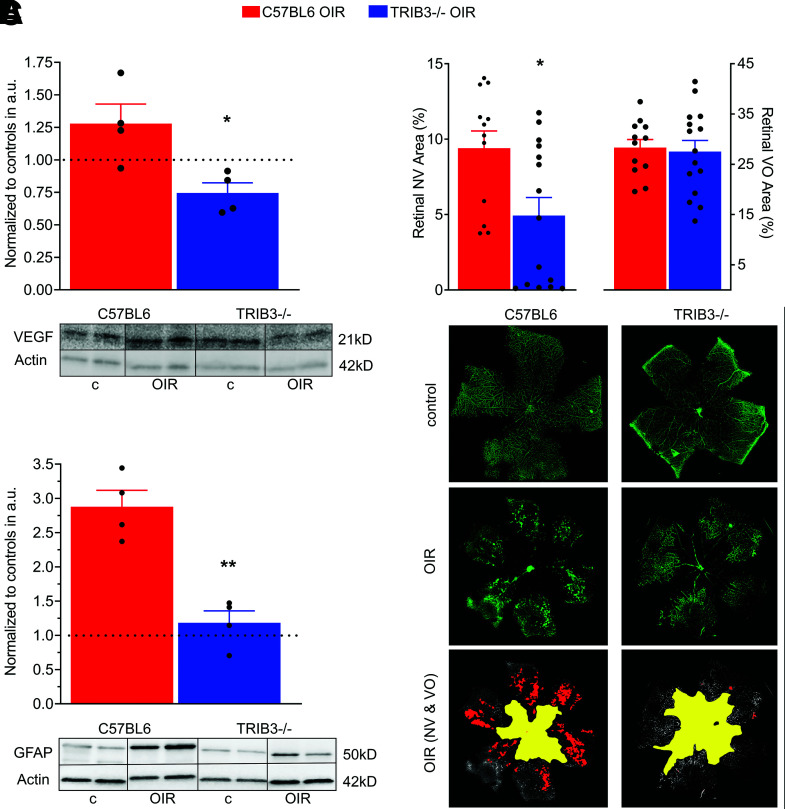
Figure 5.
TRIB3 promotes retinal vascularization during hypoxia. A: Expression of VEGF normalized to own controls (dotted line) in two hypoxic groups at P13 (n = 4). Significant reduction of VEGF in TRIB3 KO hypoxic retinas is observed. Representative images of the Western blots probed with anti-VEGF antibody are shown at the bottom. B: Ratios of the NV (left) and VO (right) areas in the hypoxic C57BL/6 and TRIB3 KO retinas (n = 6–8) to the whole retinal areas at P17. The flat mount images were used to run a computer program developed by Xiao et al. (17) to analyze areas of NV and VO. Significant reduction in NV area is observed in hypoxic TRIB3 KO retinas of pups, while no changes in VO between OIR C57BL/6 and TRIB3 are detected. Representative images for NV and avascular area in the flat mount retinas of pups were stained with isolectin (in green). C: Expression of GFAP in two diabetic C57BL/6 and TRIB3 KO groups normalized to own controls (dotted line) at P13 (n = 4). A dramatic reduction in the GFAP level in diabetic retinas with TRIB3 ablation was detected. Representative images of the Western blots probed with anti-GFAP antibody are shown at the bottom. Data are mean ± SEM. *P < 0.05, **P < 0.01. a.u., arbitrary units; c, control.

