

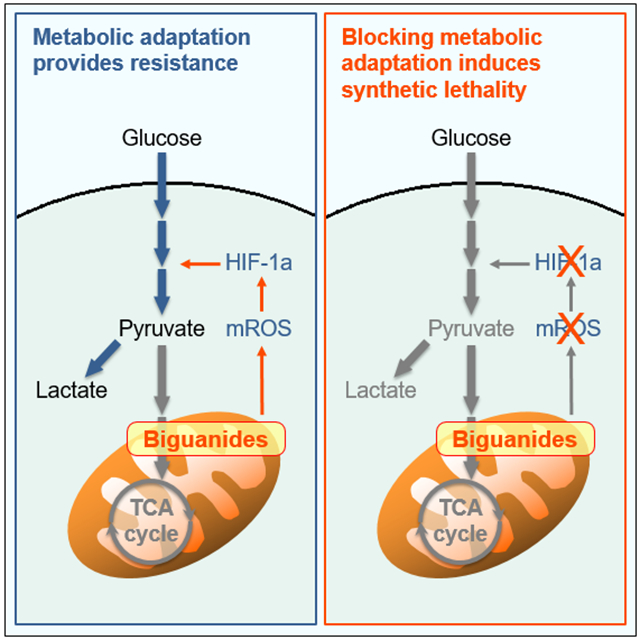
SUMMARY
Metabolic flexibility allows cells to adapt to various environments and limits efficacy of metabolic drugs. Therapeutic targeting of cancer metabolism relies on defining limiting requirements and vulnerabilities in the highly dynamic metabolic network. Here, we characterize the metabolic reprogramming and identify cancer-specific metabolic vulnerabilities in response to pharmacological inhibition of mitochondrial complex I. Our work reveals the adaptation mechanism in malignant lymphocytes providing resistance against the biguanides phenformin and metformin by transcriptionally reprogramming glucose metabolism. Metabolic adaptation to complex I inhibition is mediated by mitochondrial reactive oxygen species (mROS) serving as a mitochondrial stress signal activating hypoxia-inducible factor-1a (HIF-1a). Inhibition of the mROS/HIF-1a axis through antioxidants or direct suppression of HIF-1a selectively disrupts metabolic adaptation and survival during complex I dysfunction in malignant lymphocytes. Our results identify HIF-1a signaling as a critical factor in the resistance against biguanide-induced mitochondrial dysfunction allowing selective targeting of metabolic pathways in leukemia and lymphoma.
Keywords: metabolic flexibility, biguanides, mitochondria, HIF-1a, lymphoid malignancies
GRAPHICAL ABSTRACT
eTOC BLURB
Khan et al. characterize the signaling mechanisms underlying metabolic adaptation and fuel utilization of malignant lymphocytes in response to mitochondrial dysfunction induced by biguanides. Suppression of HIF-1a selectively targets malignant lymphocytes by inducing synthetic lethality in response to metformin and phenformin.
INTRODUCTION
Mitochondria are major metabolic and signaling hubs critically affecting cellular homeostasis in health and disease. Increasingly, cancer drug discovery is focusing on mitochondrial function as a therapeutic target with several studies indicating the critical role of mitochondrial function in tumorigenesis and cancer progression (Vyas et al., 2016; Weinberg et al., 2010). However, throughout evolution, metabolism and mitochondrial function have developed into a highly complex and dynamic network allowing adaptation to various nutrient sources and environments (Olson et al., 2016). Recent studies have shown that this flexibility also applies to cancer cells which show spatial and temporal differences in metabolic profiles and are able to support proliferation using various fuels such as fatty acids, lactate, and amino acids in addition to glucose (Davidson et al., 2016; Hui et al., 2017; Jones et al., 2018; Lehuédé et al., 2016). Moreover, metabolic signatures and preferences vary considerably between different cancers demonstrating lineage and tissue specificity of metabolic needs (Mayers and Vander Heiden, 2017). Targeting metabolism of cancer cells, therefore, requires identification of limiting metabolic requirements or simultaneous disruption of adaptive responses (Vander Heiden and DeBerardinis, 2017).
Since its discovery as a blood-glucose lowering agent in diabetic patients in 1957, use of the biguanide metformin has risen dramatically worldwide. In addition to its accepted indications of type 2 diabetes mellitus and polycystic ovary syndrome, metformin is studied intensely for its potential antineoplastic and lifespan-extending effects (Barzilai et al., 2016; Vancura et al., 2018). Part of this interest has been sparked by the observation that metformin is associated with a reduced risk of cancer in diabetic patients (Ece et al., 2012; Romero et al., 2012). Despite controversies about extent and degree of the anticancer effect of metformin as a single agent, the initial observations have drawn significant attention to the therapeutic potential of targeting mitochondrial metabolism in cancer (Dowling et al., 2016). Numerous recent studies have shown the antineoplastic effect of the two biguanides, metformin and phenformin, in various cancer cell lines (Fendt et al., 2013; Pollak, 2013). Metformin and, more potently, phenformin inhibit complex I of the mitochondrial electron transport chain (ETC) resulting in mitochondrial and bioenergetic stress associated with anticancer effects in cell culture and animal models (Liu et al., 2016; Wheaton et al., 2014). Interestingly, accumulating evidence indicates that the sensitivity of cancer cells towards biguanides varies markedly and is regulated by genetic and microenvironmental factors permitting metabolic adaptation to mitochondrial dysfunction (Birsoy et al., 2014; Gui et al., 2016; Momcilovic et al., 2015).
Reactive oxygen species (ROS) generated by the mitochondrial electron transport chain (ETC) play an important role in mitochondrial stress signaling activating signaling pathways and nuclear transcriptional responses that provide adaptation and increased stress resistance in health and disease (Holmström and Finkel, 2014; Sena and Chandel, 2012). A central pathway involved in reprogramming cancer cell metabolism is the hypoxia-inducible factor (HIF)-1a pathway activated by mitochondrial ROS (mROS) during hypoxia (Bell et al., 2007; Hamanaka et al., 2016). Several studies have highlighted the critical role of HIF and hypoxia-induced signaling in hematologic malignancies. HIF-1a signaling has been shown to regulate cancer stem cell homeostasis in mouse lymphoma and human leukemias (Giambra et al., 2015; Wang et al., 2011). Moreover, hypoxia, through HIF-1a signaling, has been shown to facilitate migration and dissemination of tumor cells in multiple myeloma, T cell lymphoma, and CML (Giambra et al., 2015; Muz et al., 2014). These studies demonstrate a critical role of HIF-1a signaling as an adaptation mechanism allowing leukemia/lymphoma cells to not only survive but exploit changes in the tumor microenvironment.
Here, we report a that HIF-1a serves as a regulator of metabolic flexibility during normoxic mitochondrial dysfunction in leukemia and lymphoma cells. Our results show that malignant lymphocytes resist biguanide-induced complex I dysfunction by rewiring their metabolism to enhance aerobic glycolysis. This pseudohypoxic adaptation is mediated by mROS as a mitochondrial stress signal that activates HIF-1a. We identify HIF-1a as a critical step in the resistance against biguanide-induced mitochondrial dysfunction allowing selective targeting of metabolic pathways providing the basis for potential novel drug combinations in lymphoid malignancies such as acute lymphoblastic leukemia (ALL) and chronic lymphocytic leukemia (CLL).
RESULTS
Phenformin induces metabolic reprogramming in malignant lymphocytes.
Phenformin and metformin have been shown to inhibit growth and induce cell death in various cancer cell lines with cytotoxic doses varying markedly between studies. At the outset of this study, we chose phenformin since it enters cells more readily than metformin and is reported to be a more potent inhibitor of ETC complex I (Wheaton et al., 2014). Various human malignant T cell lines demonstrated a partially resistant phenotype in response to phenformin with unchanged viability and only a weak reduction in proliferation (Figure 1A; Figure S1A and S1B). At those concentrations, phenformin markedly inhibited mitochondrial oxygen consumption and decreased NAD+/NADH ratio consistent with inhibition of ETC complex I (Figures 1B and 1C). Resistance against phenformin was not limited to in vitro conditions as xenograft tumors grew unaffected in mice treated with phenformin (Figure 1D). We sought to better understand underlying resistance mechanism to define therapeutic vulnerabilities in the metabolic adaptation of malignant lymphocytes to phenformin.
Figure 1. Resistance against phenformin-induced mitochondrial dysfunction is associated with metabolic reprogramming.

(A) Live cell counts of control and phenformin-treated cells of indicated lines.
(B) Mitochondrial oxygen consumption rate (OCR) during exposure to indicated doses of phenformin.
(C) NAD+/NADH ratio of cells treated with phenformin.
(D) Effect of phenformin on growth of Hut78 xenograft tumors in mice treated with phenformin (Phen; 100 mg/kg body weight) or vehicle (Ctrl).
(E and F) Extracellular lactate levels and intracellular glucose uptake of Hut78 cells treated with phenformin for 24 hrs.
(G and H) Cell viability and intracellular ATP levels in Hut78 cells grown in normal glucose (25 mM) or low-glucose (2 mM) media in absence (grey bars) and presence of phenformin (red bars).
(I) Cell viability of Hut78 cells treated for 72 hrs with LDHA inhibitor, oxamate (80 mM), in control and phenformin-treated cells.
(J) Levels of mRNA of glucose transporter 1 (GLUT1), hexokinase 2 (HK2), pyruvate kinase M (PKM), phosphofructokinase (PFK), and lactate dehydrogenase A (LDHA) in indicated cell lines after treatment with phenformin for 24 hrs
(F-J) control in grey bars, phenformin in red bars. (A, C, E-J) Cells treated with 10 μM phenformin. All data presented as mean ± SD of at least triplicate measurements; ns – non-significant.
First, we determined the effect of phenformin on glycolytic metabolism. Phenformin-treated lymphoma cells showed an increase in extracellular lactate levels and glucose uptake indicating a shift towards an enhanced glycolytic state consistent with previous studies in other cell types (Figures 1E and 1F) (Birsoy et al., 2014; Elgendy et al., 2019; Wheaton et al., 2014). Under glucose-limited conditions, phenformin-treated cells showed a marked decrease in viability (Figure 1G) along with a drop in ATP levels indicating a bioenergetic collapse (Figure 1H). Furthermore, inhibition of the final step of aerobic glycolysis, the reduction of pyruvate to lactate, with oxamate sensitized cells against phenformin (Figure 1I). Taken together, these data demonstrate that phenformin-induced respiratory stress promotes aerobic glycolysis and a glucose-dependent state allowing cells to resist mitochondrial dysfunction.
We next asked whether the shift in bioenergetic metabolism is linked to reprogramming at the transcriptional level rather than passive flow of metabolites. Phenformin led to increased expression of several key glycolysis genes (Figure 1J) including glucose transporter 1 (GLUT1), hexokinase 2 (HK2), pyruvate kinase 2 (PK2), and lactate dehydrogenase A (LDHA) indicating adaptation of the “glycolytic hardware”. We next compared the metabolic adaption observed in malignant T cells with normal CD4+ T cells isolated from healthy donors (NTC). While normal T cells showed a similar resistance against phenformin with an enhanced glycolytic profile (Figure S1C-S1G), contrary to malignant T cells, we did not detect upregulated expression of glycolysis genes in response to phenformin (Figure S1H). These data demonstrate that malignant T cells seem uniquely equipped to elicit glycolytic reprogramming during phenformin-induced mitochondrial complex I dysfunction. Characterizing the underlying adaptation mechanism might reveal potentially druggable metabolic targets in lymphoid malignancies.
Metabolic adaptation to phenformin is mediated by redox-dependent signaling.
Exposure to phenformin led to increased levels of mROS in various malignant T and B cell lines as detected by mitoSOX fluorescence (Figure 2A; Figure S2A). We hypothesized that mROS functions as a mitochondrial stress signal inducing metabolic reprogramming in response to phenformin similar to its role in hypoxia. To test this, we used the antioxidants N-acetylcysteine (NAC) and the mitochondria-targeted superoxide scavenger, mitoTEMPO (mitoT). Consistent with a critical role of mROS in metabolic adaptation, NAC and mitoTEMPO attenuated the phenformin-induced increase of extracellular lactate levels (Figure 2B). Furthermore, we observed a marked drop in ATP levels under those conditions indicating a critical dependency of adaptive aerobic glycolysis and bioenergetic homeostasis on mROS (Figure 2B). Importantly, this effect was not specific for phenformin as we observed similar effects using metformin. Metformin led to a marked increase in levels of mROS in various cell lines (Figure S2A). Moreover, metabolic adaptation to metformin was also redox-dependent as NAC and mitoTEMPO inhibited increase of extracellular lactate levels and ATP balance (Figure S2B).
Figure 2. Mitochondrial ROS promote metabolic adaption and survival during exposure to phenformin.

(A) Mitochondrial ROS levels detected by mitoSOX Red fluorescence after treatment with 10 μM phenformin for 24 hrs (representative histograms).
(B) Effect of antioxidants, 4 mM N-acetylcysteine (NAC) and 30 μM mitoTEMPO (mitoT), on lactate production and intracellular ATP levels after exposure to 10 μM phenformin for 24 hrs.
(C) Effect of antioxidant mitoTEMPO (mitoT) on levels of mRNA of key glycolytic proteins after 24 hours of treatment with 10 μM phenformin (Phen).
(D) Cell viability in response to 10 μM phenformin in presence and absence of antioxidants, NAC and mitoTEMPO.
(E) Effect of phenformin (100 mg/kg body weight) and/or NAC (1 g/L in drinking water) on Hut78 xenograft tumor growth. Data presented as mean ± SD, n=4 tumors per group. All other data presented as mean ± SD of at least triplicate measurements.
We next asked whether mROS mediated metabolic reprogramming at the transcriptional level. Indeed, we found that antioxidants reduced phenformin-induced expression of glycolysis genes GLUT1, HK2, PKM, and LDHA (Figure 2C). Consistent with the dependence on glucose and critical role of enhanced aerobic glycolysis for survival, NAC and mitoTEMPO also led to reduced viability when combined with phenformin demonstrating that both metabolic adaptation and survival during mitochondrial stress are dependent on mROS (Figure 2D). Treatment of mice with NAC also sensitized xenograft tumors against phenformin with marked reduction in tumor growth confirming that the effect of mROS is not specific for in vitro conditions (Figure 2E). Interestingly, while normal T cells showed increased mROS levels in response to phenformin (Figure S2C), we did not find an effect of antioxidants on lactate levels or survival suggesting some selectivity of the metabolic signaling for malignant cells (Figure S2D). Taken together, these results suggest that mROS act as a cytoprotective mitochondrial stress signal initiating glycolytic reprogramming in cancer cells during exposure to biguanides.
We next sought to characterize the molecular link between mROS and glycolytic adaptation. Due to the fact that mROS have been shown to be important activators HIF, we hypothesized that the observed metabolic rewiring in response to phenformin is mediated by HIF-1a (Chandel et al., 1998; Hamanaka et al., 2016). Indeed, we found stabilization of HIF-1a in various phenformin-treated malignant lymphocyte lines (Figure 3A). Next, we asked whether HIF stabilization is mediated by mROS. The failure of antioxidant-treated cells to stabilize HIF-1a in response to phenformin similar to the activation of HIF-1a after treatment with hydrogen peroxide (H2O2) demonstrates the redox-dependent nature of HIF upregulation placing it downstream of mROS (Figures 3B and S3A) consistent with previously published data (Pan et al., 2007; Selak et al., 2005; Sullivan et al., 2013). However, some TCA cycle intermediates such as fumarate have been shown to stabilize HIF-1a through increased ROS by reacting with reduced glutathione and consuming NADPH subsequently decreasing antioxidant capacity of cells (Sullivan et al., 2013). This metabolic activation pathway of HIF-1a might play in conjunction with increased mROS generation in response to complex I inhibition by phenformin. Similarly, xenograft tumors from animals treated with NAC (Figure 2E) also showed reduced levels of HIF-1a (Figure S3B). To further examine the role of mROS in phenformin-induced HIF-1a stabilization, we determined its proline hydroxylation status. We found that phenformin-induced reduction of prolyl hydroxylation and therefore stabilization of HIF-1a was reversed by mitoTEMPO and NAC suggesting that mROS works through inhibition of prolyl hydroxylases (PHD) similar to hypoxia-induced activation of HIF-1a (Figure 3C; Figure S3C) (Guzy et al., 2005; Pan et al., 2007). Next, we asked how mROS leads to inactivation of PHD after exposure to phenformin. Prolyl hydroxylase is an oxygen-, Fe(II)-, and 2-oxoglutarare-dependent dioxygenase. Depletion of the intracellular pool of reduced iron, Fe(II), by oxidation to Fe(III) has been identified as a critical mechanism of PHD inactivation and subsequent HIF-1a accumulation in response to a change in the cellular redox state (Gerald et al., 2004; Knowles et al., 2006; Lee et al., 2011; Nandal et al., 2011; Pan et al., 2007). To test whether phenformin treated cells show a similar mechanism, we determined the levels of Fe(III) and Fe(II) in cells treated with phenformin. Consistent with increased oxidative conditions during exposure to phenformin, we observed a marked increase in the Fe(III)/Fe(II) ratio which was completely reversed by NAC (Figure 3D). Treatment with H2O2 served as a control for these experiments. Under those conditions, supplementation with Fe(II) restored PHD activity with maintained hydroxylation of HIF-1a indicating that phenformin-induced ROS inactivate PHD through depleting Fe(II) for its catalytic site (Figure 3E).
Figure 3. Redox-dependent stabilization of HIF-1a mediates glycolytic adaptation.

(A) Immunoblots of nuclear extracts of indicated T cell lines show upregulation of HIF-1a levels in response to treatment with 10 μM phenformin. Antibody against histone H2A-Z was used as a loading control.
(B) Immunoblots of Hut78 cells treated with 10 μM phenformin and antioxidants, NAC (4 mM) and/or mitoTEMPO (30 μM) for 24 hrs.
(C) Immunoblots of whole cell lysates of Hut78 cells treated as indicated with antibodies specific to hydroxylated HIF-1a (OH-HIF-1a), total HIF-1a. Proteasome activity was inhibited with 25 μM MG-132 for 4 hours prior to cell lysis. β-Actin was used as a loading control.
(D) Fe(III)/Fe(II) ratio in Hut78 cells treated with 10 μM phenformin, 500 μM H2O2, 4 mM NAC for 24 hours.
(E) Immunoblots of whole cell lysates of Hut78 cells with antibodies specific to hydroxylated HIF-1a (OH-HIF-1a), total HIF-1a, β-Actin. Proteasome activity was inhibited with 25 μM MG-132 for 4 hours prior to cell lysis. Cells were treated with 100 μM Fe(II) along with 10 μM phenformin or 500 μM H2O2 for 24 hours
(F) Levels of mRNA of key glycolytic proteins in wild-type (WT) and two different HIF-1a knockout clones (HKO1 and HKO2) derived from Hut78 cells.
(G and H) Extracellular lactate and intracellular ATP levels in wild-type (WT) and HIF-1a knockout clones (HKO1&2) in response to 10 μM phenformin.
(I and J) Immunoblots of nuclear extracts and lactate output of Hut78 cells treated with small molecule inhibitor of HIF-1a, PX-478 (30 μM), and phenformin (10 μM) for 24 hrs. All data presented as mean ± SD of triplicate measurements.
Since our observations suggest that normal T cells from healthy donors differ in their metabolic adaptation mechanism, we asked whether NTC increase HIF levels during phenformin. Interestingly, NTC showed no stabilization of HIF-1a, a finding that is consistent with numerous studies in solid cancers demonstrating biguanide-induced inhibition of HIF-1a activation (Figure S3D) (Hulea et al., 2018; Wheaton et al., 2014; Zhou et al., 2015). Together, these data suggest that biguanide-induced mitochondrial complex I dysfunction stabilizes HIF-1a through mROS signaling in malignant lymphocytes.
To test whether glycolytic reprogramming is mediated by HIF-1a, we generated two CRISPR-mediated HIF-1a knockout clones (Figure S3E). Phenformin-induced upregulation of key glycolysis genes was markedly reduced in HIF-1a-deficient cells (Figure 3F) demonstrating its role in metabolic reprogramming. Moreover, cells with deficient HIF-1a were unable to raise lactate levels and maintain ATP levels during exposure to phenformin confirming that phenformin-induced metabolic adaptation requires HIF-1a (Figure 3G and 3H). Similarly, pharmacologic suppression of HIF-1a with the small-molecule inhibitor PX-478 (Figure 3I) prevented the phenformin-induced increase in extracellular lactate levels further supporting the critical role of HIF signaling in glycolytic adaptation (Figure 3J).
HIF-1a is critical for resistance against mitochondrial complex I dysfunction.
Given that metabolic reprogramming is mediated by HIF-1a, we next investigated the role of HIF-1a in surviving mitochondrial complex I dysfunction. Consistent with the critical role of HIF-1a in metabolic rewiring, treatment of HIF-1a knockout cells with phenformin led to increased cell death compared to wild-type cells (Figure 4A). Apoptotic cell death was confirmed by flow cytometry showing increased Annexin V and 7-AAD staining (Figure 4B) and immunoblotting for cleaved PARP and Caspase 3 (Figure 4C). Consistent with these genetic studies, pharmacological suppression of HIF-1a with PX-478 induced marked toxicity in response to phenformin in malignant lymphocyte lines (Figure 4D). Importantly, we observed this effect in various T and B leukemia and lymphoma cells indicating that the HIF-dependence during mitochondrial stress is generalizable. Moreover, PX-478 also sensitized cells against metformin indicating that HIF-1a-mediated survival is not limited to phenformin (Figure 4D). These results are consistent with the observed stabilization of HIF-1a in response to metformin described above. Next, we chose the non-biguanide complex I inhibitor rotenone which also decreased viability in HIF-1a-suppressed cells indicating that the dependence on HIF-1a is not biguanide-specific. In contrast, oligomycin which inhibits the mitochondrial respiratory chain at the level of ATP synthase did not show increased toxicity during HIF suppression suggesting that the mROS/HIF-1a-mediated adaptation is specific for complex I dysfunction (Figure 4E). Consistent with the lack of HIF stabilization in normal T cells, we observed no toxicity after treatment with phenformin, metformin, or rotenone and the HIF-1a inhibitor, PX-478 (Figure S3F). These results demonstrate the critical role of HIF-1a during ETC complex I dysfunction in lymphoid malignancies.
Figure 4. Targeting HIF-1a sensitizes cancer cells against mitochondrial complex I dysfunction.

(A) Viability of wild-type (WT) and HIF-1a KO clones (HKO1&2) transfected with HIF-1a cDNA after exposure to 10 μM phenformin for 72 hrs.
(B) Representative flow-cytometric analysis of 7-AAD and annexin V staining of Hut78 cells treated with phenformin (10 μM) for 72 hrs with percentage of early and late apoptotic cells indicated in red.
(C) Immunoblots of whole-cell lysates of Hut78 wild-type (WT) and HIF-1a KO (HKO1&2) cells.
(D) Cell viability of indicated cells lines after treatment with phenformin (10 μM), metformin (5 mM) and/or HIF-1a inhibitor, PX-478 (30 μM), for 72 hrs.
(E) Cell viability of Hut78 and Toledo cells treated with rotenone (1 μM), oligomycin (1 μg/mL) for 72 hrs. All data presented as mean ± SD of at least triplicate measurements.
To confirm that mROS mediates metabolic adaptation to biguanides through HIF-1a, we used a prolyl hydroxylation-defective, redox-insensitive mutant. Immunoblotting for HA-tagged protein confirmed stable expression levels of mutant HIF-1a (HIFmut) even when mROS were blocked (Figure 5A). The expression of mutant HIF-1a restored upregulation of glycolysis genes (Figure 5B) along with restored extracellular lactate levels in mitoTEMPO-treated cells in response to phenformin (Figure 5C). Parallel to restored metabolic adaptation, expression of redox-insensitive HIF-1a rescued cells from synthetic lethality induced by phenformin and antioxidants (Figure 5D). These findings were confirmed through pharmacological stabilization of HIF-1a with the small-molecule prolyl hydroxylase inhibitor, IOX2 (Figures 5E and S3G). Taken together, these results indicate that mROS-mediated activation of HIF-1a signaling is the critical driver of metabolic reprogramming during dysfunction of mitochondrial complex I in malignant lymphocytes (Figure 5F).
Figure 5. Redox-insensitive HIF-1a protects against defective mitochondrial signaling during respiratory stress.

(A and B) Immunoblots of nuclear fractions and relative mRNA levels of indicated genes of Hut78 cells transfected with either mutant HA-tagged-HIF-1a P402A/P564A (HIFmut) or wild-type HA-tagged HIF-1a (WT) treated as indicated for 24 hrs.
(C and D) Lactate output and viability of Hut78 cells transfected with either mutant HA-tagged-HIF-1a P402A/P564A (HIFmut) or wild-type HA-tagged HIF-1a (WT).
(E) Viability of Hut78 cells treated with prolyl hydroxylase inhibitor, IOX2 (50 μM), in response to phenformin (10 μM).
(F) Schematic summary of redox-mediated HIF-1a signaling during metabolic adaptation to mitochondrial complex I inhibition with biguanides. All data presented as mean ± SD of at least triplicate measurements.
Suppression of HIF-1a sensitizes lymphoma xenografts and human leukemic cells to biguanides.
Next, we sought to confirm the dependence of glucose utilization on HIF-1a in mouse xenograft tumors and human leukemia. Consistent with our in vitro results, we found that xenograft tumors in mice derived from HIF-1a knockout cells showed dramatically decreased growth upon administration of phenformin. While wild-type-derived xenograft tumors grew markedly quicker, they were not affected by administration of phenformin confirming the critical role of HIF-1a during exposure to biguanides (Figure 6A). Consistent with our in vitro data, co-treatment with phenformin and PX-478 also markedly reduced tumor size compared to vehicle control, phenformin, or PX-478 alone (Figure 6B). Immunoblotting analysis confirmed absent or suppressed HIF-1a levels in mouse xenograft tumors derived from HIF-1a-deficient cell lines and mice treated with PX-478 (Figure 6C). Imaging by 18F-FDG PET/CT demonstrated collapse of glycolytic activity in HIF-1a-suppressed tumors during treatment with phenformin, consistent with impaired metabolic reprogramming observed in vitro (Figure 6D and 6E). Collectively, our data support the redox-mediated, hypoxia-independent activation of HIF-1a reprogramming metabolism during inhibition of mitochondrial complex I.
Figure 6. Biguanides suppress growth of xenograft tumors and induce synthetic lethality in human leukemia with suppressed HIF-1a.

(A) Effect of phenformin (100 mg/kg body weight) on wild-type (WT) and HIF-KO (HKO1&2) Hut78 cell-derived xenograft tumor growth. Mean ± SD, n=6 tumors per group.
(B) Small-molecule inhibition of HIF-1a by PX-478 (100 mg/kg body weight) sensitizes Hut78-derived xenograft tumors to phenformin. Data presented as mean ± SD, n=4 tumors per group.
(C) Corresponding immunoblots of nuclear extracts of xenograft tumor tissue.
(D) 18F-FDG PET/CT studies demonstrate the glycolytic collapse (decreased 18F-FDG uptake) of HIF-1a suppressed tumors (outlined in green) during treatment with 10 μM phenformin (b=bladder).
(E) Quantification of PET data as percent of injected dose per gram of tissue (%ID/g). Mean ± SD, n=6 tumors per group.
(F) Immunoblots of isolated ALL and CLL cells treated with phenformin (10 μM) and metformin (5 mM) combined with PX-478 (30 μM) for 24 hours. Characteristics of leukamic samples are listed in Supplemental Table S1.
(G) Effect of small-molecule HIF-1a inhibitor, PX-478 (30 μM), on lactate output in CLL and ALL cells treated with indicated concentrations of phenformin and metformin for 24 hours.
(H) Viability of isolated ALL and CLL cells treated with indicated concentration of phenformin and metformin in absence or presence of 30 μM PX-478.
Data shown as mean ± SD of at least triplicate measurements; **p < 0.01; ***p < 0.001; ns, non-significant.
To validate our findings from leukemia and lymphoma cell lines and to test whether this metabolic adaptation presents a therapeutic vulnerability in human leukemia, we used freshly isolated leukemic cells from patients with acute lymphoblastic leukemia (ALL) and chronic lymphocytic leukemia (CLL). Similar to the various malignant B and T cell lines examined in this study, leukemic ALL and CLL cells showed stabilization of HIF-1a in response to metformin and phenformin providing validation of this unique feature observed in malignant lymphocytes contrary to several solid cancer cell lines (Figure 6F). Moreover, treatment with PX-478 blocked stabilization of HIF-1a consistent with our findings in cell lines.
Next, we tested whether metabolic adaptation during biguanide exposure was dependent on HIF-1a in freshly isolated leukemic cells of patients with ALL and CLL (disease specifics summarized in Table S1). Increased levels of extracellular lactate during treatment with phenformin or metformin confirmed the adaptive upregulation of aerobic glycolysis (Figure 6G). Importantly, treatment with PX-478 blocked increased generation of lactate in response to biguanides validating the reliance of metabolic adaption on HIF-1a in isolated human leukemia cells (Figure 6G). Marked synthetic lethality of cells treated with PX-478 and metformin or phenformin confirms the critical role of HIF-1a in the resistance of human leukemia cells against biguanides (Figure 6H). In summary, these results confirm our findings from malignant lymphoid cell lines and suggest that the adaptive mechanism of redox-mediated metabolic reprogramming during exposure to biguanides presents a therapeutic vulnerability in human leukemic cells. Moreover, as already suggested by our findings in several different B and T lymphoma and leukemia lines, the HIF-1a-dependency of metabolic flexibility during exposure to biguanides seems to be generalizable for malignant lymphocytes given the highly similar response to metformin and phenformin across all examined ALL and CLL samples irrespective of T or B lineage (Table S1).
DISCUSSION
Our work demonstrates a critical role of HIF-1a in lymphoid malignancies during mitochondrial stress. Leukemia and lymphoma cells rely on the mROS/HIF-1a axis for metabolic adaptation during mitochondrial stress. Pharmacological inhibition of mitochondrial complex I led to mROS-mediated activation of HIF-1a with subsequent metabolic reprogramming to enhance aerobic glycolysis. While these findings are consistent with the role of mROS as a critical signaling molecule connecting the mitochondrial respiratory chain with nuclear gene expression, activation of the mitochondria-nucleus signaling axis during adaptation to biguanides had not been described before. Biguanides induce a glucose-dependent state in lymphocytes similar to that observed in other cell types (Birsoy et al., 2014; Wheaton et al., 2014). As long as nutrient conditions were optimal, malignant lymphocytes could survive and grow in spite of diminished oxidative phosphorylation. The narrow fuel selection during mitochondrial dysfunction represents a metabolic vulnerability with several recent studies demonstrating synthetic lethality by inhibiting glycolysis, blocking lactate export, decreasing glucose, serine, or glutamine supply, or preventing activation of AMPK (Birsoy et al., 2014; Chiche et al., 2019; Gravel et al., 2014; Lea et al., 2016; Marchiq et al., 2015; Miskimins et al., 2014; Momcilovic et al., 2015; Wheaton et al., 2014). The in vivo relevance of limited glucose supply sensitizing cancer against biguanides is illustrated by a recent study demonstrating the synergistic anti-tumor effect of metformin administered during periods of fasting-induced hypoglycemia (Elgendy et al., 2019). Identification of the molecular events underlying metabolic flexibility allows a novel treatment approach blocking metabolic rewiring as demonstrated here in leukemia and lymphoma cells.
The basis for this approach is the finding that increased glucose utilization of malignant lymphocytes during exposure to biguanides is dependent on mROS/HIF-1a. Interestingly, dependency on this pseudohypoxic response has not been reported in other cancer cells and we also did not observe it in normal CD4+ T cells isolated from healthy donors. While NTCs showed increased generation of lactate and mROS in response to phenformin, simultaneous treatment with antioxidants or suppression of HIF-1a did not impair lactate output or viability. Given the lack of upregulated expression of glycolysis genes in NTCs, failure to activate HIF-1a is not surprising and, in fact, consistent with data from other studies suggesting an inhibitory effect of biguanides on HIF-1a activation in solid cancer cell lines (Guimaraes et al., 2016; Wheaton et al., 2014; Zhou et al., 2015). The observed activation and dependency on HIF-1a in malignant B and T lymphocytes and isolated leukemia cells presents a vulnerability that could be exploited for metabolic therapies of leukemia and lymphoma.
Normoxic activation of the HIF pathway has been shown to occur in cancer for example as a result of mutations of tricarboxylic acid cycle enzymes. In particular, mutations in the tricarboxylic acid cycle enzymes isocitrate dehydrogenase, succinate dehydrogenase, or fumarate hydratase leads to the accumulation of metabolites that stabilize HIF-1a by inhibiting prolyl hydroxylase (Selak et al., 2005; Sullivan et al., 2013; Zhao et al., 2009). The importance of redox-induced HIF activation on cancer was demonstrated by work showing that treatment with antioxidants N-acetylcysteine or vitamin C inhibited lymphoma xenograft growth in a HIF-dependent manner (Gao et al., 2007). Moreover, normoxic activation of the mROS/HIF-1a axis was identified to be a critical event downstream of defective SIRT3 in breast cancer (Bell et al., 2011; Finley et al., 2011). Our finding that leukemia and lymphoma cells rely on mROS/HIF-1a signaling during normoxic mitochondrial complex I dysfunction highlights the central role of this axis in the adaptation to cellular stress. Interestingly, this normoxic mitochondrial stress response is similar to an observation in the nematode Caenorhabditis elegans, where mROS generated during impaired ETC activity under normoxic conditions increases HIF activation leading to increased lifespan (Lee et al., 2010). In general, modest increases in ROS increase stress resistance and extend lifespan by triggering the expression of cytoprotective, adaptive pathways, termed mitohormesis (Sun et al., 2016; Yun and Finkel, 2014). Cancer cells seem to have adopted this highly conserved signaling mechanism to regulate their stress response during tumor progression or, as we show here, metabolic adaptation to mitochondrial stress (Kenny et al., 2019).
Our results identify the mitoROS/HIF-1a axis as a critical mechanism to reprogram the metabolic profile in leukemia and lymphoma cells during normoxic ETC dysfunction. While it is unclear why malignant lymphocytes depend on activation of HIF-1a signaling during exposure to biguanides, this unique feature compared to other previously examined cancers could be used as the basis for therapeutic interventions selectively targeting leukemia and lymphoma cells. These findings also highlight the fact that rational drug combinations are likely to be the best way forward for therapies targeting the highly dynamic metabolic network of cancer cells. Our work suggests that the combination of metformin and the HIF-1a inhibitor, PX-478, both agents with limited effects as single agents, might have therapeutic potential in lymphoid leukemia.
STAR METHODS
LEAD CONTACT AND MATERIALS AVAILABILITY
Further information and requests for resources and reagents should be directed to and will be fulfilled by the Lead Contact, Stefan Schieke (schieke@wisc.edu). This study did not generate new unique reagents.
EXPERIMENTAL MODEL AND SUBJECT DETAILS
Cell culture
The human malignant T-cell lines, Hut78, HH and Jurkat, and human malignant B-cell lines Daudi, Toledo, were obtained from the American Tissue Culture Collection (ATCC, Manassas, VA). Human CTCL line MyLa was generous gift from Dr. Reinhard Dummer, Dr. Emmanuel Contassot, and Dr. Lars French (University of Zurich). HH, Jurkat, Myla, Daudi and Toledo were propagated in RPMI-1640 media (ATCC) and Hut78 was propagated in Iscove's Modified Dulbecco's Medium (IMDM; ATCC). The following compounds were added to the media: 10% heat-inactivated fetal bovine serum, 100 U/mL penicillin, 0.1 mg/mL streptomycin, and 0.1 mg/mL Amphotericin B (Gibco, Gaithersburg, MD). Cells were kept in a humidified incubator at 37°C with a 5% CO2 atmosphere. Normal CD4+ T-cells (NTCs) from healthy donors were obtained from Astarte Biologics, Bothell, WA and maintained in X-VIVO15 (Lonza) media supplemented with human CD3/CD28/CD2 T cell activator (Immunocult, Stemcell Technologies, Cambridge, MA) and 50 IU/mL IL2 (BioVision, Milpitas, CA). Where indicated, cells were incubated with phenformin (10 μM), metformin (5 mM), N-acetylcysteine (4 mM), mitoTEMPO (30 μM), rotenone (1 μM), oligomycin (1 μg/mL), CoCl2 (100 μM) all from Sigma-Aldrich, St. Louis; MO, PX-478 (30 μM), MG-132 (25 μM), and IOX2 (50 μM), are from Selleckchem, Houston, TX.
Mouse xenograft studies
For xenograft assays, 4x10⁶ cells were injected subcutaneously into both flanks of immunodeficient NOD scid gamma NSG female mice (NOD.Cg-Prkdcscid Il2rgtm1Wjl/SzJ; 8-10 weeks old) (The Jackson Laboratory, Bar Harbor, ME) following a protocol approved by the Institutional Animal Care and Usage Committees (IACUC) at the Medical College of Wisconsin and the University of Wisconsin-Madison. Once small tumors had developed (approximately 5x5 mm in size), animals were treated with daily intraperitoneal injections of either phenformin (100 mg), PX-478 (100 mg), or vehicle. NAC treatment was provided through the diet at 1 g/liter in drinking water. Tumor size was recorded daily and tumor weight was assessed after the animals had been sacrificed.
Human Leukemia Samples
De-identified blood samples from patients diagnosed with ALL and CLL were used with approval from the Health Sciences Institutional Review Board, University of Wisconsin, Madison, WI. Characteristics of leukemic samples, patient age and sex are listed in Table S1. The leukemic burden was detected by flow cytometry for CLL as CD19+, CD20dim, CD5+, CD23+, CD200+, kappa or lambda light chain restricted and ALL as low side scatter and CD45dim with cytoplasmic CD3+, TdT+ with variable expression of CD4, CD8, CD1a, CD5 for T-ALL blasts or CD19+, TdT+ with variable expression of CD22, CD20, CD79a for B-ALL blasts. PBMCs from blood samples were isolated via Ficoll (GE, Pittsburgh, PA) gradient centrifugation according to manufacturer’s instructions. Isolated PBMCs were treated as indicated.
METHOD DETAILS
CRISPR/Cas9-mediated knockout of HIF-1a
Knockout of HIF-1a in the Hut78 cell line was made using the Edit-R system following the manufacturer’s protocol (Dharmacon, Lafayette, CO). Briefly, pre-designed CRISPR RNAs (crRNAs) targeting human HIF-1a were co-transfected into Hut78 cells along with Edit-R transactivating CRISPR RNA (tracrRNA), and an Edit-R SMARTCas9 expression plasmid bearing an mKate2 fluorescence marker. Transfected cells were sorted for enrichment of edited cells based on expression of the mKate2 marker using a BD FACS Aria instrument (Becton Dickinson, San Jose, CA). Cells positive for the knockout were confirmed by western blot analysis demonstrating loss of HIF-1a expression.
Plasmids and transfection
Plasmids for prolyl hydroxylation defective HA-HIF-1α P402A/P564A-pcDNA3 (Addgene plasmid #18955) and wildtype HA-HIF-1α-pcDNA3 (Addgene plasmid #18949) were a gift from William Kaelin. Hut78 cells were transfected using TurboFect Transfection Reagent (ThermoFisher Scientific, Waltham, MA) according to the manufacturer’s protocol. Experiments with transfected cells were performed three days after transfection.
Proliferation and cell viability analysis
For cell proliferation analysis, 25x104 number of T-cells were seeded in triplicate in 24-well plates and cell counts were taken every 24 hours for 4 days after treatment with phenformin or with normal saline vehicle. For cell viability analysis, at the end of the experiments cells were stained with SYTOX Green Nucleic Acid Stain (ThermoFisher Scientific, Waltham, MA) for 15 minute before flow cytometric analysis. In case of apoptosis assays, cells were incubated with 7-AAD and Annexin V in 1X binding buffer for 15 minutes in dark before flow cytometric analysis. Samples were acquired on BD LSR II Flow Cytometer (Becton Dickinson, San Jose, CA) and data was analyzed using FlowJo software (Tree Star Inc., Ashland, OR).
Immunoblot analysis
Nuclear extracts were prepared with the BioVision Nuclear/Cytosol Fractionation Kit (BioVision, Milpitas, CA) as per manufacturer protocol. For whole tumor and cell lysates, samples were prepared by lysis of cells or tissue in radio immunoprecipitation assay (RIPA) buffer containing a protease inhibitor cocktail (Complete-mini, EDTA-free protease inhibitor cocktail; Roche Applied Science, Indianapolis, IN). Protein concentration was quantified using the Bio-Rad Protein Assay (Bio-Rad, Hercules, CA). Proteins were then subjected to standard SDS-PAGE and Western blot analysis using antibodies against HIF-1a, OH-HIF-1a (Pro564), H2A-Z, β-Actin, HA tag, PARP, or caspase-3 obtained from Cell Signaling Technology (Boston, MA). H2A-Z and β-actin were utilized as a loading control for nuclear fractions and whole cell lysates, respectively.
Metabolite measurements
NAD+/NADH ratio, lactate levels, and ATP levels were measured using NAD+/NADH Quantitation Colorimetric Kit, Lactate Colorimetric/Fluorometric Assay Kit (BioVision, Milpitas, CA) and ATP-based Cell Titer-Glo assay (Promega, Madison, WI), respectively, according to the manufacturer protocols. Fe(II) and Fe(III) level was determined using Iron Colorimetric Assay Kit (BioVision, Milpitas, CA) according to the manufacturer protocols. Equal numbers of cells from each group were used for analysis. Glucose uptake was determined using the Glucose Uptake Cell-Based Assay Kit (Cayman Chemical, Ann Arbor, MI) according to the manufacturer’s protocol. Samples were acquired on a BD LSR II Flow Cytometer.
Oxygen consumption rate measurements
The Seahorse XF-96 Flux Analyzer (Seahorse Bioscience, Billerica, MA) was used to determine oxygen consumption rate (OCR). Briefly, 1x10⁵ Hut78, or NTC cells per well were seeded in 100 μL of Dulbecco's Modified Eagle's Medium without sodium bicarbonate in a V3-PET cell culture plate. An additional 80 μL of DMEM medium was added prior to XF analysis. The rate of oxygen consumption in phenformin-treated and untreated cells was measured under basal conditions. OCR was expressed as a percentage of the baseline oxygen consumption. In this study, baseline oxygen consumption refers to rates prior to the addition of phenformin or vehicle.
ROS analysis
The mitochondrial superoxide level was measured with MitoSOX Red reagent (ThermoFisher Scientific, San Diego, CA) according to manufacturer’s instructions. Briefly, cells were stained with MitoSOX red for 10 minutes in HBSS buffer, followed by washing with HBSS. Fluorescence intensity of MitoSOX Red was quantified by LSR II flow cytometer (Becton Dickinson, San Jose, CA). Data are presented as fluorescence intensity versus flow cytometer events.
Real time PCR of HIF-1a target genes
To evaluate the expression level of a gene by RT-PCR, total RNA was extracted from cell or tissue lysates using the RNeasy kit (Qiagen, Valencia, CA) and then converted to cDNA by reverse transcription with the RT First Strand Kit (SABiosciences, Valencia, CA). Real-time PCR was performed on a Step-One Plus Real-time PCR system (Applied Biosystems, Carlsbad, CA). β-actin was used as the endogenous control.
Primer sequences:
GLUT1: Forw. GGATGAAGATGATGCTCAGC; rev. GTCACCCACAGCCCTTC
HK2: Forw. AGCCCTTTCTCCATCTCCTT; rev. TCTGCTTGCCTACTTCTTCAC
PKM: Forw. GAAGACCTTCTCTGCAGGAATC; rev. CAGCAAATCGAGAATCTGAGG
LDHA: Forw. GCAAGGAACACTAAGGAAGACA; rev. TGGGCTATTGGACTCTCTGTA
PFK: Forw. TGCCATAGAGATGTAGGGAAGA; rev. GGAAGGAAGAAAGAAGGAAGGG
β-actin: Forw. CCTTGCACATGCCGGAG; rev. ACAGAGCCTCGCCTTTG
Positron Emission Tomography (PET)/Computed Tomography (CT) imaging
All mice were fasted for 12 hours prior to intravenous injection of approximately 8 MBq of 2′-deoxy-2′-(18F)fluoro-D-glucose (FDG) 1 hour before imaging. Mice were warmed after injection and anesthetized with inhalation gas using 2% isoflurane mixed with 1L/min of pure oxygen. Mice were imaged with the Siemens Inveon Hybrid microPET/CT (Siemens Medical Solutions, Knoxville, TN) in the prone position. Forty-million counts per mouse were collected for the PET scan to obtain adequate signal-to-noise. PET data were histogrammed into one static frame and subsequently reconstructed using ordered-subset expectation maximization (OSEM) of three dimensions followed by the maximum a posteriori algorithm, and CT attenuation and scatter correction were applied based on the NEMA NU 4 image-quality parameters. All PET and CT images were co-registered. Image data were analyzed using the General Analysis tools provided in the Siemens Inveon Research Workplace (Siemens Medical Solutions, Knoxville, TN). Data were identically window/leveled and scaled according to each animal’s decay corrected injection activity. Based on the PET and CT images, a reference volume of interest (VOI) was drawn around each tumor and a separate VOI was drawn for muscle as the background tissue. VOI thresholding within the reference tumor VOI was adjusted to include all signal greater than sixty percent of the maximum signal. Data were reported as percent injected dose normalized by the mass of the tissue VOI (%ID/g tissue), assuming a tissue density of water of 1g/mL. Data were then averaged within groups and compared.
QUANTIFICATION AND STATISTICAL ANALYSIS
Data are presented as the mean ± SD of at least triplicate measurements representative of 2 - 4 biologically independent experiments unless stated otherwise. Comparisons between different treatments were performed using student’s t-test and ANOVA for multiparametric comparisons in GraphPad Prism versions 7.0 and 8.0. A p value of less than 0.05 was considered statistically significant (* p < 0.05, ** p < 0.01, *** p < 0.001, *** p < 0.0001).
DATA AND CODE AVAILABILITY
This study did not generate any unique datasets or code.
Supplementary Material
Key Resources Table
| REAGENT or RESOURCE | SOURCE | IDENTIFIER |
|---|---|---|
| Antibodies | ||
| HIF-1a | Cell Signaling Technology | Cat#3716 |
| OH-HIF-1a | Cell Signaling Technology | Cat#3434 |
| HA tag-HIF-1a | Cell Signaling Technology | Cat#3724 |
| PARP | Cell Signaling Technology | Cat#9542 |
| Caspase-3 | Cell Signaling Technology | Cat#9662 |
| β-Actin | Cell Signaling Technology | Cat#12620 |
| H2A-Z | Cell Signaling Technology | Cat#2718 |
| CD19-APC | Becton Dickinson | Cat#340722 |
| CD20-APC-H7 | Becton Dickinson | Cat#641405 |
| CD20-FITC | Becton Dickinson | Cat#340673 |
| CD5-BV421 | Becton Dickinson | Cat#659479 |
| CD23-PE | Becton Dickinson | Cat#341008 |
| CD200-APC | Becton Dickinson | Cat#655428 |
| CD45-V200C | Becton Dickinson | Cat#647450 |
| CD3-APC-H7 | Becton Dickinson | Cat#349201 |
| CD3-PerCP | Becton Dickinson | Cat#340663 |
| CD3-FITC | Becton Dickinson | Cat#349201 |
| TdT-FITC | Life Technologies | Cat#MHTDT01-5 |
| CD4-APC | Becton Dickinson | Cat#341653 |
| CD8-PE | Becton Dickinson | Cat#340046 |
| CD8-APC-H7 | Becton Dickinson | Cat#641409 |
| CD1a-PE | Becton Dickinson | Cat#341641 |
| CD22-PE | Becton Dickinson | Cat#340708 |
| CD79a-PerCP5.5 | Becton Dickinson | Cat#341633 |
| Biological Samples | ||
| Human ALL and CLL samples | University of Wisconsin, Madison, WI | N/A |
| Human CD4+ T Cells | Astarte Biologics | Cat#1023-3123AP16 |
| Chemicals, Peptides, and Recombinant Proteins | ||
| IL-2, human recombinant | BioVision | Cat#4131 |
| ImmunoCult | STEMCELL Technologies Inc | Cat#10970 |
| Phenformin hydrochloride | Sigma-Aldrich | Cat#P7045 |
| Metformin hydrochloride | Sigma-Aldrich | Cat#PHR1084 |
| Sodium oxamate | Sigma-Aldrich | Cat#O2751 |
| N-acetylcysteine | Sigma-Aldrich | Cat#A7250 |
| MitoTEMPO | Sigma-Aldrich | Cat#SML0737 |
| Rotenone | Sigma-Aldrich | Cat#R8875 |
| Oligomycin | Sigma-Aldrich | Cat#75351 |
| CoCl2 | Sigma-Aldrich | Cat#232696 |
| MG-132 | Selleckchem | Cat#S2619 |
| Iron(II) chloride | Sigma-Aldrich | Cat#372870 |
| PX-478 | Selleckchem | Cat#S7612 |
| IOX2 | Selleckchem | Cat#S2919 |
| Critical Commercial Assays | ||
| SYTOX Green | ThermoFisher Scientific | Cat#S7020 |
| Apoptosis Detection Kit | BioLegend | Cat#640922 |
| Nuclear/Cytosol Fractionation Kit | BioVision | Cat#K266 |
| NAD+/NADH Quantitation Colorimetric Kit | BioVision | Cat#K337 |
| Iron Colorimetric Assay Kit | BioVision | Cat#K390 |
| Lactate Colorimetric/Fluorometric Assay Kit | BioVision | Cat#K607 |
| ATP-based Cell Titer-Glo assay | Promega | Cat#G7570 |
| Glucose Uptake Cell-Based Assay Kit | Cayman Chemical | Cat#600470 |
| MitoSOX Red | ThermoFisher Scientific | Cat#M36008 |
| RNeasy kit | Qiagen | Cat#74004 |
| RT First Strand Kit | Qiagen | Cat#330401 |
| SYBR Green Master Mix | Applied Biosystems | Cat#A25742 |
| Experimental Models: Cell Lines | ||
| Hut78 | American Type Culture Collection | Cat#TIB-161 |
| HH | American Type Culture Collection | Cat#CRL-2105 |
| Jurkat | American Type Culture Collection | Cat#TIB-152 |
| Myla | (Contassot et al., 2008) | NA |
| Toledo | American Type Culture Collection | Cat#CRL-2631 |
| Daudi | American Type Culture Collection | Cat#CCL-213 |
| Experimental Models: Organisms/Strains | ||
| NOD.Cg-Prkdcscid Il2rgtm1Wjl/SzJ, NSG mice | Jackson Laboratory | Stock No:#005557 |
| Oligonucleotides | ||
| Edit-R SMARTCas9 | GE Healthcare Dharmacon, Inc. | Cat#U-004100-120 |
| tracrRNA | GE Healthcare Dharmacon, Inc. | Cat#U-002000-05 |
| crRNAs | GE Healthcare Dharmacon, Inc. | Cat#CR-004018-01 |
| Recombinant DNA | ||
| HA-HIF-1α P402A/P564A-pcDNA3 plasmid | Yan et al., 2007 | Addgene Plasmid#18955 |
| Wildtype HA-HIF-1a-pcDNA3 plasmid | Kondo et al., 2002 | Addgene Plasmid#18949 |
| Software and Algorithms | ||
| Prism 8 | GraphPad | https://www.graphpad.com/scientificsoftware/prism |
| FlowJo X, v10.0.7r2 | Tree Star | http://docs.flowjo.com/vx/installation |
HIGHLIGHTS.
Malignant lymphocytes show intrinsic resistance against metformin and phenformin
Resistance against biguanides relies on metabolic reprogramming through HIF-1a
Targeting of HIF-1a selectively sensitizes malignant lymphocytes against biguanides
ACKNOWLEDGMENTS
We thank Steven Komas of the Medical College of Wisconsin Cancer Center Redox and Bioenergetics Shared Resource for expert technical assistance in determining oxygen consumption rate. This work was supported by funding to S.M.S. from a University of Wisconsin Skin Disease Research Center Pilot Grant, University of Wisconsin Carbone Cancer Center Support Grant (#P30 CA014520), American Cancer Society Institutional Research Grant (#86-004-26), a Dermatology Foundation Medical Dermatology Career Development Award, and the Medical College of Wisconsin Cancer Center.
Footnotes
DECLARATION OF INTERESTS
The authors declare no competing interests.
REFERENCES
- Barzilai N, Crandall JP, Kritchevsky SB, and Espeland MA (2016). Metformin as a Tool to Target Aging. Cell Metab 23, 1060 1065. [DOI] [PMC free article] [PubMed] [Google Scholar]
- Bell E, Emerling B, Ricoult S, and Guarente L (2011). SirT3 suppresses hypoxia inducible factor 1α and tumor growth by inhibiting mitochondrial ROS production. Oncogene 30, 2986. [DOI] [PMC free article] [PubMed] [Google Scholar]
- Bell E, Klimova T, Eisenbart J, Schumacker P, and Chandel N Mitochondrial Reactive Oxygen Species Trigger Hypoxia-Inducible Factor-Dependent Extension of the Replicative Life Span during Hypoxia. Molecular and Cellular Biology 27, 5737–5745. [DOI] [PMC free article] [PubMed] [Google Scholar]
- Birsoy K, Possemato R, Lorbeer FK, Bayraktar EC, Thiru P, Yucel B, Wang T, Chen WW, Clish CB, and Sabatini DM (2014). Metabolic determinants of cancer cell sensitivity to glucose limitation and biguanides. Nature 508, 108. [DOI] [PMC free article] [PubMed] [Google Scholar]
- Chandel N, Maltepe E, Goldwasser E, Mathieu C, Simon M, and Schumacker P (1998). Mitochondrial reactive oxygen species trigger hypoxia- induced transcription. Proceedings of the National Academy of Sciences 95, 11715 11720. [DOI] [PMC free article] [PubMed] [Google Scholar]
- Chiche J, Reverso-Meinietti J, Mouchotte A, Rubio-Patiño C, Mhaidly R, Villa E, Bossowski JP, Proics E, Grima-Reyes M, Paquet A, et al. (2019). GAPDH Expression Predicts the Response to R-CHOP, the Tumor Metabolic Status, and the Response of DLBCL Patients to Metabolic Inhibitors. Cell Metab 1 45. [DOI] [PubMed] [Google Scholar]
- Contassot E, Kerl K, Roques S, Shane R, Gaide O, Dupuis M, Rook AH, French LE (2008). Resistance to FasL and tumor necrosis factor-related apoptosis-inducing ligand-mediated apoptosis in Sezary syndrome T-cells associated with impaired death receptor and FLICE-inhibitory protein expression. [DOI] [PubMed] [Google Scholar]
- Davidson SM, Papagiannakopoulos T, Olenchock BA, Heyman JE, Keibler MA, Luengo A, Bauer MR, Jha AK, O’Brien JP, Pierce KA, et al. (2016). Environment Impacts the Metabolic Dependencies of Ras-Driven Non-Small Cell Lung Cancer. Cell Metab 23, 517–528. [DOI] [PMC free article] [PubMed] [Google Scholar]
- Dowling RJ, Lam S, Bassi C, Mouaaz S, Aman A, Kiyota T, Al-awar R, Goodwin PJ, and Stambolic V (2016). Metformin Pharmacokinetics in Mouse Tumors: Implications for Human Therapy. Cell Metab 23, 567 568. [DOI] [PubMed] [Google Scholar]
- Ece H, Cigdem E, Yuksel K, Ahmet D, Hakan E, and Oktay T (2012). Use of Oral Antidiabetic Drugs (Metformin and Pioglitazone) in Diabetic Patients with Breast Cancer: How Does It Effect on Serum Hif-1 Alpha and 8Ohdg Levels? Asian Pac J Cancer P 13, 5143–5148. [DOI] [PubMed] [Google Scholar]
- Elgendy M, Cirò M, Hosseini A, Weiszmann J, Mazzarella L, Ferrari E, Cazzoli R, Curigliano G, DeCensi A, Bonanni B, et al. (2019). Combination of Hypoglycemia and Metformin Impairs Tumor Metabolic Plasticity and Growth by Modulating the PP2A-GSK3β-MCL-1 Axis. Cancer Cell 1 41. [DOI] [PubMed] [Google Scholar]
- Fendt S-M, Bell EL, Keibler MA, Davidson SM, Wirth GJ, Fiske B, Mayers JR, Schwab M, Bellinger G, Csibi A, et al. (2013). Metformin Decreases Glucose Oxidation and Increases the Dependency of Prostate Cancer Cells on Reductive Glutamine Metabolism. Cancer Res 73, 4429–4438. [DOI] [PMC free article] [PubMed] [Google Scholar]
- Finley L, Carracedo A, Lee J, Souza A, Egia A, Zhang J, Teruya-Feldstein J, Moreira PI, Cardoso SM, Clish CB, et al. (2011). SIRT3 Opposes Reprogramming of Cancer Cell Metabolism through HIF1α Destabilization. Cancer Cell 19, 416–428. [DOI] [PMC free article] [PubMed] [Google Scholar]
- Gao P, Zhang H, Dinavahi R, Li F, Xiang Y, Raman V, Bhujwalla ZM, Felsher DW, Cheng L, Pevsner J, et al. (2007). HIF-dependent antitumorigenic effect of antioxidants in vivo. Cancer Cell 12, 230 238. [DOI] [PMC free article] [PubMed] [Google Scholar]
- Gerald D, Berra E, Frapart YM, Chan DA, Giaccia AJ, Mansuy D, Pouysségur J, Yaniv M, Mechta-Grigoriou F (2004). JunD reduces tumor angiogenesis by protecting cells from oxidative stress. Cell. 118, 781–794. [DOI] [PubMed] [Google Scholar]
- Giambra V, Jenkins CE, Lam SH, Hoofd C, Belmonte M, Wang X, Gusscott S, Gracias D, and Weng AP (2015). Leukemia stem cells in T-ALL require active Hif1α and Wnt signaling. Blood 125, 3917–3927. [DOI] [PMC free article] [PubMed] [Google Scholar]
- Gravel S, Hulea L, Toban N, Birman E, Blouin M, Zakikhani M, Zhao Y, Topisirovic I, St-Pierre J, and Pollak M (2014). Serine Deprivation Enhances Antineoplastic Activity of Biguanides. Cancer Res 74, 7521 7533. [DOI] [PubMed] [Google Scholar]
- Gui DY, Sullivan LB, Luengo A, Hosios AM, Bush LN, Gitego N, Davidson SM, Freinkman E, Thomas CJ, and Vander Heiden MG (2016). Environment Dictates Dependence on Mitochondrial Complex I for NAD+ and Aspartate Production and Determines Cancer Cell Sensitivity to Metformin. Cell Metab 24, 716–727. [DOI] [PMC free article] [PubMed] [Google Scholar]
- Guimaraes T, Farias L, Santos E, de Fraga C, Orsini L, de Teles L, Feltenberger J, de Jesus S, de Souza M, Santos S, et al. (2016). Metformin increases PDH and suppresses HIF-1 alpha under hypoxic conditions and induces cell death in oral squamous cell carcinoma. Oncotarget 7, 55057 55068. [DOI] [PMC free article] [PubMed] [Google Scholar]
- Guzy RD, Hoyos B, Robin E, Chen H, Liu L, Mansfield KD, Simon CM, Hammerling U, and Schumacker PT (2005). Mitochondrial complex III is required for hypoxia-induced ROS production and cellular oxygen sensing. Cell Metab 1, 401 408. [DOI] [PubMed] [Google Scholar]
- Hamanaka RB, Weinberg SE, Reczek CR, and Chandel NS (2016). The Mitochondrial Respiratory Chain Is Required for Organismal Adaptation to Hypoxia. Cell Reports 15, 451–459. [DOI] [PMC free article] [PubMed] [Google Scholar]
- Vander Heiden MG, and DeBerardinis RJ (2017). Understanding the Intersections between Metabolism and Cancer Biology. Cell 168, 657–669. [DOI] [PMC free article] [PubMed] [Google Scholar]
- Holmström KM, and Finkel T (2014). Cellular mechanisms and physiological consequences of redox-dependent signalling. Nat Rev Mol Cell Bio 15, 411–421. [DOI] [PubMed] [Google Scholar]
- Hui S, Ghergurovich JM, Morscher RJ, Jang C, Teng X, Lu W, Esparza LA, Reya T, Zhan L, Guo J, et al. (2017). Glucose feeds the TCA cycle via circulating lactate. Nature 551, 115. [DOI] [PMC free article] [PubMed] [Google Scholar]
- Hulea L, Gravel S-P, Morita M, Cargnello M, Uchenunu O, Im Y, Lehuédé C, Ma EH, Leibovitch M, McLaughlan S, et al. (2018). Translational and HIF-1α-Dependent Metabolic Reprogramming Underpin Metabolic Plasticity and Responses to Kinase Inhibitors and Biguanides. Cell Metab 28, 817–832.e8. [DOI] [PMC free article] [PubMed] [Google Scholar]
- Jones CL, Stevens BM, D’Alessandro A, Reisz JA, Culp-Hill R, Nemkov T, Pei S, Khan N, Adane B, Ye H, et al. (2018). Inhibition of Amino Acid Metabolism Selectively Targets Human Leukemia Stem Cells. Cancer Cell 34, 724–740.e4. [DOI] [PMC free article] [PubMed] [Google Scholar]
- Kenny TC, Craig AJ, Villanueva A, and Germain D (2019). Mitohormesis Primes Tumor Invasion and Metastasis. Cell Reports 27, 2292–2303.e6. [DOI] [PMC free article] [PubMed] [Google Scholar]
- Knowles HJ, Mole DR, Ratcliffe PJ, Harris AL (2006). Normoxic stabilization of hypoxia-inducible factor-1alpha by modulation of the labile iron pool in differentiating U937 macrophages: effect of natural resistance-associated macrophage protein 1. Cancer Res. 66, 2600–2607. [DOI] [PubMed] [Google Scholar]
- Kondo K, Klco J, Nakamura E, Lechpammer M, Kaelin WG (2002). Inhibition of HIF is necessary for tumor suppression by the von Hippel-Lindau protein. Cancer Cell 1, 237–246. [DOI] [PubMed] [Google Scholar]
- Lea MA, Guzman Y, and Desbordes C (2016). Inhibition of Growth by Combined Treatment with Inhibitors of Lactate Dehydrogenase and either Phenformin or Inhibitors of 6-Phosphofructo-2-kinase/Fructose-2,6-. Anticancer Res 1 10. [PubMed] [Google Scholar]
- Lee S-J, Hwang AB, and Kenyon C (2010). Inhibition of Respiration Extends C. elegans Life Span via Reactive Oxygen Species that Increase HIF-1 Activity. Curr Biol 20, 2131–2136. [DOI] [PMC free article] [PubMed] [Google Scholar]
- Lee HY, Lee T, Lee N, Yang EG, Lee C, Lee J, Moon EY, Ha J, Park H (2011). Src activates HIF-1α not through direct phosphorylation of HIF-1α specific prolyl-4 hydroxylase 2 but through activation of the NADPH oxidase/Rac pathway. Carcinogenesis. 32, 703–712. [DOI] [PubMed] [Google Scholar]
- Lehuédé C, Dupuy F, Rabinovitch R, Jones RG, and Siegel PM (2016). Metabolic Plasticity as a Determinant of Tumor Growth and Metastasis. Cancer Res 76, 5201–5208. [DOI] [PubMed] [Google Scholar]
- Liu X, Romero IL, Litchfield LM, Lengyel E, and Locasale JW (2016). Metformin Targets Central Carbon Metabolism and Reveals Mitochondrial Requirements in Human Cancers. Cell Metab 24, 728–739. [DOI] [PMC free article] [PubMed] [Google Scholar]
- Marchiq I, Floch LR, Roux D, Simon M, and Pouyssegur J (2015). Genetic Disruption of Lactate/H+ Symporters (MCTs) and Their Subunit CD147/BASIGIN Sensitizes Glycolytic Tumor Cells to Phenformin. Cancer Res 75, 171 180. [DOI] [PubMed] [Google Scholar]
- Mayers JR, and Vander Heiden MG (2017). Nature and Nurture: What Determines Tumor Metabolic Phenotypes? Cancer Res 77, 3131–3134. [DOI] [PubMed] [Google Scholar]
- Miskimins KW, Ahn H, Kim J, Ryu S, Jung Y-S, and Choi J (2014). Synergistic Anti-Cancer Effect of Phenformin and Oxamate. Plos One 9, e85576 14. [DOI] [PMC free article] [PubMed] [Google Scholar]
- Momcilovic M, McMickle R, Abt E, Seki A, Simko SA, Magyar C, Stout DB, Fishbein MC, Walser TC, Dubinett SM, et al. (2015). Heightening Energetic Stress Selectively Targets LKB1-Deficient Non–Small Cell Lung Cancers. Cancer Res 75, 4910–4922. [DOI] [PMC free article] [PubMed] [Google Scholar]
- Muz B, de la Puente P, Azab F, Luderer M, and Azab A (2014). The Role of Hypoxia and Exploitation of the Hypoxic Environment in Hematologic Malignancies. Mol Cancer Res 12, 1347–1354. [DOI] [PubMed] [Google Scholar]
- Nandal A, Ruiz JC, Subramanian P, Ghimire-Rijal S, Sinnamon RA, Stemmler TL, Bruick RK, Philpott CC (2011). Activation of the HIF prolyl hydroxylase by the iron chaperones PCBP1 and PCBP2. Cell Metab 14, 647–657. [DOI] [PMC free article] [PubMed] [Google Scholar]
- Olson KA, Schell JC, and Rutter J (2016). Pyruvate and Metabolic Flexibility: Illuminating a Path Toward Selective Cancer Therapies. Trends Biochem Sci 41, 219–230. [DOI] [PMC free article] [PubMed] [Google Scholar]
- Pan Y, Mansfield K, Bertozzi C, Rudenko V, Chan D, Giaccia A, and Simon M (2007). Multiple Factors Affecting Cellular Redox Status and Energy Metabolism Modulate Hypoxia-Inducible Factor Prolyl Hydroxylase Activity In Vivo and In Vitro. Mol Cell Biol 27, 912 925. [DOI] [PMC free article] [PubMed] [Google Scholar]
- Pollak M (2013). Targeting Oxidative Phosphorylation: Why, When, and How. Cancer Cell 23, 263–264. [DOI] [PubMed] [Google Scholar]
- Romero IL, McCormick A, McEwen KA, Park S, Karrison T, Yamada DS, Pannain S, and Lengyel E (2012). Relationship of Type II Diabetes and Metformin Use to Ovarian Cancer Progression, Survival, and Chemosensitivity. Obstetrics Gynecol 119, 61–67. [DOI] [PMC free article] [PubMed] [Google Scholar]
- Selak MA, Armour SM, MacKenzie ED, Boulahbel H, Watson DG, Mansfield KD, Pan Y, Simon CM, Thompson CB, and Gottlieb E (2005). Succinate links TCA cycle dysfunction to oncogenesis by inhibiting HIF-α prolyl hydroxylase. Cancer Cell 7, 77 85. [DOI] [PubMed] [Google Scholar]
- Sena LA, and Chandel NS (2012). Physiological Roles of Mitochondrial Reactive Oxygen Species. Mol Cell 48, 158–167. [DOI] [PMC free article] [PubMed] [Google Scholar]
- Sullivan LB, Martinez-Garcia E, Nguyen H, Mullen AR, Dufour E, Sudarshan S, Licht JD, DeBerardinis RJ, and Chandel NS (2013). The Proto-oncometabolite Fumarate Binds Glutathione to Amplify ROS-Dependent Signaling. Mol Cell 51, 236 248. [DOI] [PMC free article] [PubMed] [Google Scholar]
- Sun N, Youle RJ, and Finkel T (2016). The Mitochondrial Basis of Aging. Mol Cell 61, 654–666. [DOI] [PMC free article] [PubMed] [Google Scholar]
- Vancura A, Bu P, Bhagwat M, Zeng J, and Vancurova I (2018). Metformin as an Anticancer Agent. Trends Pharmacol Sci 39, 867–878. [DOI] [PMC free article] [PubMed] [Google Scholar]
- Vyas S, Zaganjor E, and Haigis MC (2016). Mitochondria and Cancer. Cell 166, 555 566. [DOI] [PMC free article] [PubMed] [Google Scholar]
- Wang Y, Liu Y, Malek SN, Zheng P, and Liu Y (2011). Targeting HIF1α Eliminates Cancer Stem Cells in Hematological Malignancies. Cell Stem Cell 8, 399–411. [DOI] [PMC free article] [PubMed] [Google Scholar]
- Weinberg F, Hamanaka R, Wheaton WW, Weinberg S, Joseph J, Lopez M, Kalyanaraman B, Mutlu GM, Budinger SG, and Chandel NS (2010). Mitochondrial metabolism and ROS generation are essential for Kras-mediated tumorigenicity. Proc National Acad Sci 107, 8788–8793. [DOI] [PMC free article] [PubMed] [Google Scholar]
- Wheaton WW, Weinberg SE, Hamanaka RB, Soberanes S, Sullivan LB, Anso E, Glasauer A, Dufour E, Mutlu GM, Budigner SG, et al. (2014). Metformin inhibits mitochondrial complex I of cancer cells to reduce tumorigenesis. Elife 3, e02242. [DOI] [PMC free article] [PubMed] [Google Scholar]
- Yan Q, Bartz S, Mao M, Li L, Kaelin WG (2007). The hypoxia-inducible factor 2alpha N-terminal and C-terminal transactivation domains cooperate to promote renal tumorigenesis in vivo. Mol Cell Biol 27, 2092–2102. [DOI] [PMC free article] [PubMed] [Google Scholar]
- Yun J, and Finkel T (2014). Mitohormesis. Cell Metab 19, 757–766. [DOI] [PMC free article] [PubMed] [Google Scholar]
- Zhao S, Lin Y, Xu W, Jiang W, Zha Z, Wang P, Yu W, Li Z, Gong L, Peng Y, et al. (2009). Glioma-Derived Mutations in IDH1 Dominantly Inhibit IDH1 Catalytic Activity and Induce HIF-1α. Science 324, 261–265. [DOI] [PMC free article] [PubMed] [Google Scholar]
- Zhou X, Chen J, Yi G, Deng M, Liu H, Liang M, Shi B, Fu X, Chen Y, Chen L, et al. (2015). Metformin suppresses hypoxia-induced stabilization of HIF-1α through reprogramming of oxygen metabolism in hepatocellular carcinoma. Oncotarget 7, 873–884. [DOI] [PMC free article] [PubMed] [Google Scholar]
Associated Data
This section collects any data citations, data availability statements, or supplementary materials included in this article.
Supplementary Materials
Data Availability Statement
This study did not generate any unique datasets or code.