

Abstract
For epidemic prevention and control, the identification of SARS-CoV-2 subpopulations sharing similar micro-epidemiological patterns and evolutionary histories is necessary for a more targeted investigation into the links among COVID-19 outbreaks caused by SARS-CoV-2 with similar genetic backgrounds. Genomic sequencing analysis has demonstrated the ability to uncover viral genetic diversity. However, an objective analysis is necessary for the identification of SARS-CoV-2 subpopulations. Herein, we detected all the mutations in 186 682 SARS-CoV-2 isolates. We found that the GC content of the SARS-CoV-2 genome had evolved to be lower, which may be conducive to viral spread, and the frameshift mutation was rare in the global population. Next, we encoded the genomic mutations in binary form and used an unsupervised learning classifier, namely PhenoGraph, to classify this information. Consequently, PhenoGraph successfully identified 303 SARS-CoV-2 subpopulations, and we found that the PhenoGraph classification was consistent with, but more detailed and precise than the known GISAID clades (S, L, V, G, GH, GR, GV and O). By the change trend analysis, we found that the growth rate of SARS-CoV-2 diversity has slowed down significantly. We also analyzed the temporal, spatial and phylogenetic relationships among the subpopulations and revealed the evolutionary trajectory of SARS-CoV-2 to a certain extent. Hence, our results provide a better understanding of the patterns and trends in the genomic evolution and epidemiology of SARS-CoV-2.
Keywords: SARS-CoV-2, genetic mutation, PhenoGraph, subpopulation
Introduction
Since late 2019, the sudden emergence of severe acute respiratory syndrome coronavirus 2 (SARS-CoV-2, also known as 2019-nCoV), which caused the coronavirus disease 2019 (COVID-19) pandemic, and its subsequent continuing spread have posed serious threats to both global public health and economic prosperity [1]. SARS-CoV-2 is the third highly pathogenic coronavirus introduced into the human population [2, 3], and it is more infectious than the previous SARS-CoV at different temperatures [4]. Due to its high transmissibility and pathogenicity, this novel coronavirus has rapidly spread worldwide [5]. As of 12 January 2021, more than 88 million cases of COVID-19 and over 1.9 million associated deaths have been reported [6]. Evolutionary analysis suggests that SARS-CoV-2 has adaptively evolved in the process of human infection and human-to-human transmission, which explains its abundant genetic diversity [7, 8]. Hence, extensive genomic data collection and prompt trend discovery would play a vital role in global epidemic surveillance and provide important support for decision-making in the prevention and control of COVID-19.
Currently, there are more than 235 038 publicly available complete or near-complete genomic sequences of SARS-CoV-2 (as of 7 December 2020), and the number continues to grow. The full length of the SARS-CoV-2 genome is about 30 kb, and the detailed protein-coding genes in the genome predicted by ZCURVE_CoV 2.0 can be found at http://tubic.tju.edu.cn/CoVdb [9]. Its large genome size and high evolutionary rate (a striking feature of RNA viruses) facilitate easy accumulation of genomic polymorphisms during epidemic outbreaks [10, 11]. Based on the growing number of available sequences, genomic epidemiology generates a wealth of information, which may answer the evolutionary and epidemiological questions, ranging from global transmission dynamics to genotype/phenotype relationship. There is a need for an objective and robust classification method to partition and describe the genetic diversity of SARS-CoV-2, making it possible to capture the COVID-19 pandemic dynamics and reveal the evolutionary change of its intermediate stages [12, 13]. At present, there are two main types of classifications: single nucleotide polymorphism (SNP)-based and phylogeny-based classifications. The SNP-based classification is generally simple and straightforward, and it is suitable for viruses with small-scale pandemic outbreaks (e.g., Ebola virus [14]), slowly evolving viruses (e.g., John Cunningham virus [15]), or rapidly evolving viruses with low lineage turnover rates (e.g., hepatitis C virus [16]). Chinese lineage [17] and Nextstrain clade [18] typing are SNP-based classification methods, which primarily depend on marker mutations or mutations with significant frequency and geographic spread. Hence, it is difficult to completely resolve the complex genetic diversity of SARS-CoV-2 [19]. As for the phylogeny-based classification, there are two main methods, namely the Pangolin lineage [20] and GISAID cluster [21] typing methods. The Pangolin lineage is defined based on a set of predefined conditions from a phylogenetic tree built from 27 767 SARS-CoV-2 genomes, and the GISAID cluster is informed by the statistical distribution of the distance calculated from a phylogenetic tree [22], avoiding the arbitrariness of determining the intra/inter-cluster diversity thresholds. Although the phylogeny-based method provides more detailed clusters, it has some limitations [23]. For example, the alignment used for constructing a phylogenetic tree demands all the sequences to be continuously homologous, which may lead to the loss of useful information [23]. However, this is not always the case, as it is almost impossible to simultaneously align thousands of complete genomes due to huge computation time and memory consumption, and a similar problem is also associated with the construction of a phylogenetic tree. Furthermore, the phylogeny-based classification relies heavily on the genetic distance thresholds to define the maximum genetic divergence among closely related viruses [22]. Even though Han et al. defined genetic distance thresholds based on statistical criteria [22], it is important to recognize that this approach has statistical uncertainty [20].
As previously reported, coronaviruses frequently recombine [24]. So, there are concerns that the classification of SARS-CoV-2 may be affected by recombination events, and the phylogeny-based classification may not accurately reflect the evolutionary relationships among clades and/or lineages. It was found that there was a strong linkage disequilibrium among the polymorphic sites, and the clonal pattern of inheritance was not disrupted, which indicated that the recombinant strains of SARS-CoV-2 were not widespread [25]. Varabyou et al. carried out a recombination analysis of SARS-CoV-2 sequences collected before October 2020 (available in the GISAID database), and identified 225 anomalous genomes of likely recombinant origins from 87 695 high-quality SARS-CoV-2 genomes with a recombinant frequency of only 0.26% [26]. A more recent research (15 March 2021) has come to a similar conclusion the recombination frequency of SARS-CoV-2 is only about 0.21% based on 537 000 strains, and the number of circulating recombinant viruses is much lower, accounting for only <5% of recombinants [27]. Therefore, the recombination of SARS-CoV-2 is very rare, which may be mainly caused by the following factors. First, co-infections rarely occur. Second, recombinant viruses are more likely to appear in the late stage of infection, hence less likely to spread after the infection is confirmed. Third, local genetic diversity remains limited, and the recombination is undetectable since the genetic material exchanged at the time of recombination is identical. Considering these facts, even if recombination may affect the classification of SARS-CoV-2, its effect could be basically negligible.
In recent years, a wide variety of clustering methods, including the supervised and unsupervised methods, have been successfully developed for classification. The supervised method requires training data with associated labels, whereas the unsupervised method does not require the user-assigned training labels and only uses the inherent structure of data, providing more objectivity in the classification of species, subspecies, or quasispecies [28, 29]. PhenoGraph is a top-performing unsupervised tool, which can run efficiently on high-dimensional data with substantially scaling and process millions of samples only with modest computational resources [30]. By comparing PhenoGraph with other cluster methods including the FLOCK [31], flowMeans [32], SamSPECTRAL [33], Gaussian mixture modeling (GMM) and hierarchical linkage clustering, Levine et al. found that PhenoGraph displayed superior precision, recall, and robustness based on benchmark datasets [30]. Liu et al. compared nine methods based on six independent benchmark datasets, and found that PhenoGraph performed better than other unsupervised tools in precision, coherence, and stability. In addition, PhenoGraph is more robust when detecting refined sub-clusters [34]. Hence, PhenoGraph may be one of the best choices for the classification of SARS-CoV-2.
As discussed above, PhenoGraph was originally developed to algorithmically dissect functionally distinct subpopulations from high-dimensional single-cell data with an accurate classification rate of up to 99.85% [30]. Although it is frequently used in data-intensive biological fields, PhenoGraph has not been used for genetic data. In this study, we applied the PhenoGraph classifier for the classification of SARS-CoV-2 based on a matrix coded by the probability of every component in every position of the genomic sequence, and this binary-coded genomic data would not result in the loss of useful information. The computational power of this machine learning-based unsupervised tool makes it possible to achieve a detailed classification of hundreds of thousands of SARS-CoV-2 genomes. Further, we integrated the subpopulations of SARS-CoV-2 with its temporal and spatial distributions in a genomic epidemiology framework to enhance the inference of origin and transmission of COVID-19 outbreak. This provides invaluable information on the evolution and molecular epidemiology of SARS-CoV-2 in the ongoing pandemic and will probably play an important role in the surveillance, prediction, control, and mitigation of COVID-19.
Materials and methods
Data collection and filtering
As of 7 December 2020, 5:00 CST (sequence submission date), 240 781 genomic sequences of SARS-CoV-2 were retrieved from the Global Initiative on Sharing All Influenza Data (GISAID) EpiCoV repository (https://www.epicov.org) [35]. A comprehensive table (Supplementary Table 1) that acknowledges data contributors was prepared by using the EpiCoV browser of the GISAID. The genomic sequences of <29 000 bp length, with more than 1% unknown bases, lacking geographic information, or belonging to non-human or unknown hosts were excluded, leaving a total of 186 682 sequences for the downstream analysis.
Detection of genetic variation
A custom PERL script was implemented to perform the alignment of every genome against the Wuhan-Hu-1 reference genome (EPI_ISL_402125, NC_045512.2) [36] using MAFFT v7.475 [37, 38] and to identify the mutations (SNP, INS/DEL). The deletion and insertion events located at both ends of the sequence, which may be caused by incomplete assembly, were excluded.
Dissection of population structure
PhenoGraph is a data-driven approach developed for classifying subpopulations by Levine et al. in 2015 [30]. It is considered one of the most popular and best methods for the classification of high-dimensional single-cell RNA-seq data into distinct subpopulations [34]. Herein, we applied this method to genomic data to dissect the global population structure of SARS-CoV-2. To make genomic data suitable for the PhenoGraph method and make the classification more accurate and reliable, we encoded the genomic data in a specific manner. To be specific, we integrated the genetic variations of all the isolates into a large dimensionality of the resulting data, in which each component (there were six components, the base A, T, C, G, and the +(INS) and -(DEL) variations, respectively) of every sample was coded using a vector (Supplementary Figure 1), and the binary values 0 or 1 stored at each component in every site represented the absence or presence of this component. Furthermore, to obtain the final high-dimensional genomic data, we filtered these vectors with a mutation frequency of less than 0.01% in the global population because such ultra-low-frequency variations were very likely to be caused by sequencing errors or mutations blocking virus propagation. Finally, we used the t-SNE [39] implemented in R package (Rtsne, version 0.15) with non-default parameters (pca = FALSE, theta = 0.0) to reduce the high-dimensional genomic data to a two-dimensional representation, and the distribution of SARS-CoV-2 population structure was also plotted. We further compared GISAID and PhenoGraph classifications to estimate the effect of PhenoGraph classification and reveal their internal relationships.
Phylogenetic and network analyses
To estimate the phylogenetic relationships among subpopulations, we randomly sampled every subpopulation and obtained 100 sample sets representing these subpopulations. For every sample set, multiple genome alignments were performed using MAFFT v7.475 [37], and only the SNPs in multiple alignments were concatenated using a custom Perl script and analyzed using FastTree v2.1.11 [40] with default settings to construct the maximum likelihood tree. To fully represent the phylogenetic relationship of subpopulations, the resulting trees constructed from 100 sample sets were integrated into a coalescent phylogenetic tree using the ASTRAL program [41], which was displayed along with the relevant information through the Interactive Tree Of Life (iTOL) v4 [42]. The median-joining networks of Network 10 (https://www.fluxus-engineering.com/sharenet.htm) were used to further estimate the phylogenetic network relationships of the subpopulations [43, 44], where only the genomic sites with SNP occurrence frequency ≥ 80% in one or more subpopulations were used to construct the haplotype network between subpopulations.
Results
Geographical distribution of SARS-CoV-2
We screened 186 682 genomic sequences of the SARS-CoV-2 isolates with definite sources and high integrity from the GISAID database. We analyzed the distribution of these isolates in different countries and regions. As shown in Figure 1, the countries with the most SARS-CoV-2 isolates in Europe, North America, Oceania, Asia, South America and Africa were the UK, USA, Australia, India, Brazil and South Africa, respectively. In particular, the number of sequenced SARS-CoV-2 isolates in the United Kingdom far exceeds that in other countries. In general, this distribution reflects both the sequencing capacity of the country and, indirectly, the prevalence of the virus.
Figure 1 .
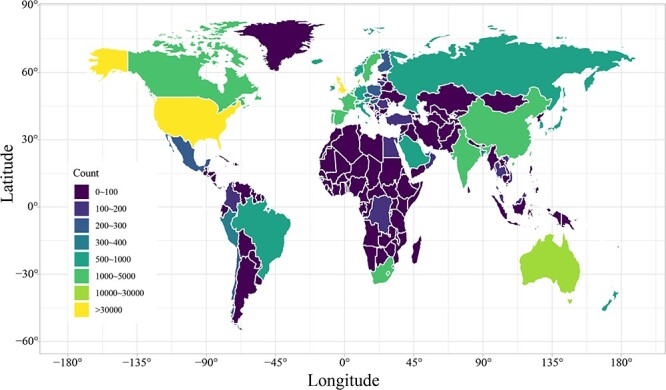
Global distribution of SARS-CoV-2. The number of SARS-CoV-2 isolates present in every country is indicated by color depth.
Variant statistics
We totally detected 2 451 596 SNPs, 16 997 DELs and 933 INSs in 186 682 SARS-CoV-2 isolates. Then, we investigated the change in SARS-CoV-2 mutations over time. As shown in Figure 2, the number of newly emerged mutations and isolates with mutations increased considerably from February to May 2020 (the first wave of the COVID-19 epidemic). Until October 2020, the newly emerged mutations became increasingly scarce, but the number of mutated isolates seemed to grow at an increasing rate. This indicated that a large number of dominant mutations occurred, which might make the isolates carrying these mutations more accommodating and diffusible because the number of isolates carrying those mutations continue to rise sharply. We also estimated the distribution of mutations over different genomic regions, finding that the T- > C and T- > G changes were far lower than those of C- > T and G- > T, respectively, whereas the A- > C change was also far lower than that of C- > A, and the difference between A- > G and G- > A changes was not significant (Supplementary Figure 2a). These changes indicate that the GC content of the SARS-CoV-2 genome became lower, and this may be beneficial to its replication because the A-T and C-G pairs were able to form double and triple hydrogen bonds, respectively, with the double hydrogen bond being more easily unwound using less energy than triple hydrogen bonds. The length of DEL/INS (especially the DEL) that emerged in the CDS region was primarily concentrated in the multiple of three (Supplementary Figure 2b) because such mutations did not cause the frameshift mutation that completely altered the coding of functional genes, which usually does not have a fatal effect on SARS-CoV-2. In contrast, the length of DEL/INS in the non-CDS regions was primarily concentrated in one and two bases (Supplementary Figure 2b). All the results suggested that SARS-CoV-2 had selectively evolved under the heredity laws and the rules of survival of the fittest.
Figure 2 .
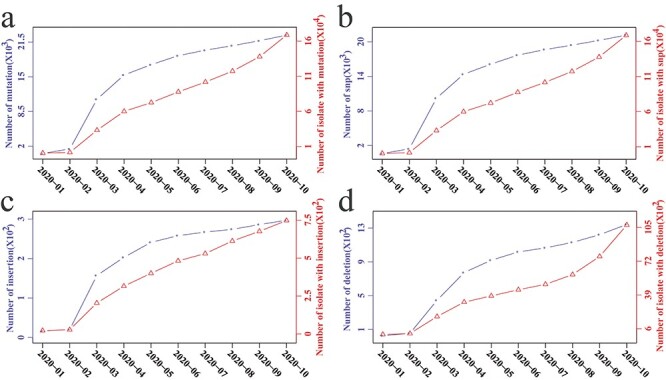
Time series of SARS-CoV-2 mutation. Changing tendency of all mutations (namely, SNPs, INSs and DELs) (a), SNPs (b), INSs (c) and DELs (d) in the first 10 months of 2020. Dotted lines with circles and triangles indicate the cumulative number of newly emerged mutations and isolates with these mutations, respectively.
Subpopulations of SARS-CoV-2
Over the course of a few months, SARS-CoV-2 has already mutated and evolved in a way that facilitates its spread [45]. However, there is currently a lack of objective and robust classification methods for viral genetic diversity below the species level [20]. Herein, we determined the subpopulations of SARS-CoV-2 using an unsupervised machine learning approach and then estimated the variation in the number of its subpopulations. SARS-CoV-2 was classified into 303 subpopulations (Figure 3b). It can be observed clearly that there is a predominant decreasing tendency for the increase of the number of subpopulations as the number of SARS-CoV-2 isolates increased, indicating that growth rate of SARS-CoV-2 genetic diversity has slowed down significantly, consistent with the trend of newly emerged mutations (Figure 2a).
Figure 3 .
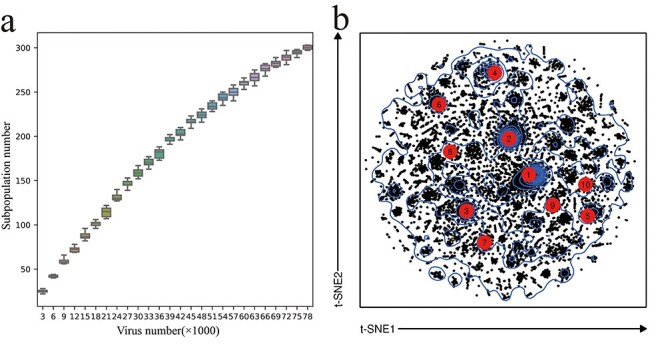
SARS-CoV-2 subpopulations classified by the PhenoGraph classifier. (a) Change trend of the number of subpopulations with increasing isolates. (b) t-SNE plot based on the genetic data from mutations. Top 10 subpopulations with the highest number of isolates are marked in red circle.
To determine the origin of the subpopulations, we performed statistical analysis on the distribution of SARS-CoV-2 isolates in every subpopulation across different countries and assessed the country where each subpopulation first appeared (Supplementary Figure 3). We found that the first five subpopulations (S1, S2, S3, S4 and S5, consecutively) with the largest number of isolates were first found in the UK, France, China, Australia and the UK, respectively. As shown in Supplementary Figure 3 and Supplementary Table 2, five countries with the largest number of newly emerged subpopulation were the UK, USA, Denmark, Australia, and China, and the corresponding number was 121, 55, 19, 12 and 12, respectively. Furthermore, we analyzed the monthly changes in the number of isolates in each subpopulation in the first 10 months of 2020 and preliminarily determined the monthly changing trend of isolates in each subpopulation (Supplementary Figure 4). Of the top 10 subpopulations, S10 was the last to appear. In the last month (October 2020), S5, S8, S13, S14, S10 and S23 were the top six subpopulations (Supplementary Figure 4). We also observed that some subpopulations appeared or disappeared in the last 2 months. We further estimated the average difference in mutation frequency between these subpopulations based on SNPs. As shown in Supplementary Figure 5, there are different degrees of differences between subpopulations, most of which are obvious, which reflects their relatedness to a certain extent. To understand the homogeneity of each subpopulation, the mutation frequency of each genomic site in these subpopulations is shown in Supplementary Figure 6, from which it can be observed that there are specific patterns of marker variants with higher homogeneity for each subpopulation. As shown in Supplementary Tables 3 and 4, some mutations are heavily weighted in defining a subpopulation, but there are also a few mutations present in most of subpopulations such as C241, C3037, C14408 and A23403 (Supplementary Table 3). Therefore, we preliminarily determined the population structure of SARS-CoV-2 and the changing trend in each subpopulation.
Phylogenetic relationship of subpopulations
By random sampling, phylogenetic analysis, and reconstruction of the coalescent tree, we determined the evolutionary relationship among different SARS-CoV-2 subpopulations (Figure 4), which uncovered a well-structured classification of the SARS-CoV-2 global population. GISAID has developed a well-known nomenclature system that defines the clades of SARS-CoV-2 based on the statistical criteria of PhyCLIP [22]. Hence, we established a connection between the subpopulations and GISAID clades based on the classified isolates; we found that the PhenoGraph classification was almost consistent with GISAID classification, except for six subpopulations obviously mixed by different GISAID clades (Supplementary Figure 7). We further investigated this inconsistency via hierarchical clustering analysis and found that the clustering result supported the PhenoGraph classification (Supplementary Figure 8), indicating that we obtained a reliable classification of SARS-CoV-2 through the PhenoGraph classifier.
Figure 4 .

Maximum-likelihood phylogeny of SARS-CoV-2 subpopulations. Clade refers to eight major clades defined in GISAID; Number is reflected by the log10 value (number of isolates). Country refers to the country that has the largest number of isolates in corresponding subpopulation. Date corresponds to the earlist sampling date for each subpopulation, ranging from 24 December 2019 to 05 October 2020.
Next, we directly matched the subpopulations with the major GISAID clades, and when a subpopulation corresponded to multiple GISAID clades, the clade with the highest number of isolates was matched with such subpopulation. As shown in Figure 4, all the GISAID clades almost matched the phylogenetic clusters of SARS-CoV-2 subpopulations, except the G and L clades, which were split into two different clusters. In fact, GISAID classification is not strictly based on phylogenetic relationships, but relies more on several marker variants, which could be observed in NextStrain website (https://www.gisaid.org/phylodynamics/global/nextstrain/) [18]. Furthermore, we found that the division of major GISAID clades appeared to be challenging, as some clades (GR, GV and GH) corresponded to the big phylogenetic clusters but others (G, L, O, S and V) only matched the small clusters (Figure 4), indicating the limitation of statistical classification. We found that the subpopulations with a high number of isolates were fairly evenly distributed in different phylogenetic clusters (Figure 4), and the recently emerged subpopulations were primarily concentrated in the GV clade of GISAID. When a SARS-CoV-2 subpopulation existed in more than one country, we considered the country with the most virus isolates in this subpopulation as its primary country and associated each tree node to these countries. We found that the UK, USA, Denmark, Australia, India, and China had the largest number of subpopulations: 173 (GH, 17; G, 23; L, 4; GV, 54; V, 5; GR, 70), 55 (G, 12; L, 1; GH, 33; GR, 3; S, 6), 20 (GV, 4; G, 5; GH, 5; GR, 6), 11 (O, 1; S, 1; GR, 9), 7 (G, 1; GH, 1; O, 2; GR, 3) and 5 (S, 1;V, 1;L, 2;GR, 1) subpopulations, respectively.
Phylogenetic network of subpopulations
As reported by Forster et al., the global SARS-CoV-2 population has formed a clear phylogenetic network as the epidemic continues to spread on a massive scale [43]. Herein, we constructed the genealogical relationship of SARS-CoV-2 using a median-joining network analysis based on 785 SNP sites with occurrence frequency ≥ 80% in one or more subpopulations (Supplementary Table 3). The network relationship of 303 subpopulations is illustrated in Figure 5, through which we can track the spread of pandemics and the evolution of SARS-CoV-2. From this haplotype network (Figure 5), we observed many nodes, each of which was a subpopulation, also known as an outbreak cluster or infection cluster [11]. Overall, these subpopulations showed a relationship between intra-clade aggregation and inter-clade association. Consistent with what the GISAID team had described but with slight differences (https://www.gisaid.org/references/statements-clarifications/clade-and-lineage-nomenclature-aids-in-genomic-epidemiology-of-active-hcov-19-viruses/), our results showed that the S clade is actually a branch of the L clade (Figure 5a) because the L clade is located on the torso of median-joining network, but the S clade is extended from the L clade instead of on the torso of this network. Along the torso of this haplotype network, the L clade was divided into two major clades, namely the G and V clades, and the O clade was actually a branch of the median vector located between the L and V clades. The G clade was split into the GR and GH clades, and the GV clade evolved from the GH clade with a large evolutionary distance. By comparison, we also found that this haplotype network was highly consistent with the phylogenetic relationships (Figure 4). Consistent with the evolutionary sequence reported by the GISAID team (Figure 5a), the SARS-CoV-2 isolate sampled on 24 December 2019 belonged to the L clade, and all the subpopulations corresponding to the GV clade were the latest to appear (Figure 5b). Overall, most of the surrounding subpopulations in the network are relatively recent. Figure 5c shows the association of subpopulations with country in the haplotype network. Therefore, we identified the temporal, spatial, and phylogenetic relationships among different subpopulations, which would be useful for investigating the evolutionary and epidemiological dynamics of the global SARS-CoV-2 population.
Figure 5 .

Haplotype network of SARS-CoV-2 inferred with the median-joining method. The torso of network is marked in bold lines, and the size of dots represents the relative number of SARS-CoV-2 isolates in each subpopulation.
Discussion
In the early outbreak, the Global Initiative on Sharing All Influenza Data (GISAID) followed the definition of SARS-CoV-2 lineages made by Tang et al. [17] and divided SARS-CoV-2 into two major clades ‘L’ and ‘S’ based on the mutation L84S in ORF8 protein [21]. For the purpose of consistent reporting, GISAID further defined the other six major clades (the V, O, G, GH, GR, and GV) based on marker mutations within the high-level phylogenetic groupings [46]. In these clades, S and L are the earliest known clades, and L is the characteristic of the Wuhan outbreak. V and G clades are descendants of L clade, and V clade is genetically closely related to L clade. O refers to other clades designated for virus isolates that do not meet the clade definition of GISAID [47]. G clade is further split into GH and GR clade, and the GV clade is evolved from the GH clade. These clades can split further when they meet the definition of a new clade. The marker mutations for each clade are provided in GISAID website, from which we can see that these mutations used for defining clades are so limited that it is hard to fully represent the genetic diversity of SARS-CoV-2.
Similar to SARS-CoV, SARS-CoV-2 is an RNA virus characterized by a high mutation rate [9]. SARS-CoV-2 frequently adapts to environmental changes (such as the changes in temperature, humidity, acidity, atmospheric pressure, UV irradiation, host genetic background, ionic strength, drug, immunity, etc.) in real time via random mutations that are subject to natural selection [48, 49]. Evidence has suggested that one or more mutations are needed for a virus to cope with a new environmental challenge or create an adaptive advantage [50]. Previous studies have shown that certain levels of variation exist between isolates from different patients and between isolates from different tissues of the same patient [51–54]. In a genome-wide analysis of 24 strains, Xiong et al. found that the virus mutated at a rate similar to those of other coronaviruses [55]. As this virus is highly infectious [5], it produces a large number of mutations in the process of human-to-human infection and transmission [11]. In most cases, the fate of the emerging mutants is determined by natural selection, and those that have a competitive advantage in viral replication, transmission, or immune evasion will spread widely, whereas unfavorable mutants slowly disappear from the viral population [56]. In this study, we found that a large number of SARS-CoV-2 mutants have emerged, and some have circulated widely in the human population. These widespread mutants usually have different adaptive advantages, such as immune evasion [57–59], enhanced replication and transmission [60, 61], and increased viral entry efficiency [62]. We also found that the genetic diversity of SARS-CoV-2 is approaching saturation (Figure 2), and the population structure has become more stable (Figure 3a). We found that the GC content of the SARS-CoV-2 genome was reduced. In fact, AT and GC base pairs in DNA contain two and three hydrogen bonds respectively, hence less energy is required to unwind the AT base pair compared to GC base pair [63]. In addition, lower GC content may also reduce biochemical costs of GC base synthesis [64]. Hence, the decrease of GC content may be beneficial to virus replication. In addition, the number of frameshift mutation is very low, indicating that a drastic change in the function of any protein would be detrimental to this virus.
Genetic diversity of SARS-CoV-2 would continually grow as SARS-CoV-2 continues to spread around the world and mutate to adopt various environments or hosts [65]. Due to the continuously expanding diversity, the present GISAID clades are not sufficient for us to understand the patterns and determinants of the global COVID-19 pandemic spread. Hence, it is needed to be improved with detailed lineages assigned by other tools [21]. The identification of SARS-CoV-2 subpopulations is essential for better characterization of the genetic diversity and evolutionary trajectory that accompany its global expansion. Since the outbreak of COVID-19 pandemic, different studies have classified SARS-CoV-2 population. Tang et al. classified SARS-CoV-2 into L and S lineages based on two closely linked SNPs. Forster et al. classified this virus into three types (A, B and C) based on amino acid mutations. GISAID team further divided SARS-CoV-2 into eight branches, namely S, L, V, G, GV, GR, GH and O, based on a series of amino acid mutations in each phylogenetic branch. Moreover, Nextstrain team classified virus isolates with mutations of more than 20% global frequency as new branches and Rambaut et al. defined different levels of pedigree according to a set of conditions based on a phylogenetic framework. Owing to distinct algorithm and focus, the aforementioned methods have different outcomes. Herein, we used the PhenoGraph classifier to automatically segment the genetic data of SARS-CoV-2 isolates into an optimum number of subpopulations. We used PhenoGraph because it is a graph-based partitioning method that takes a matrix composed of genetic data of N viral isolates as input and partitions the data into genotypically distinct subpopulations by clustering a weighted graph constructed based on the k-nearest neighbors for each isolate. PhenoGraph is an effective method for the spatial organization of mass cytometry and single-cell RNA-sequencing data [66]. We thought that the graph-based clustering nature of PhenoGraph would facilitate the identification of genetic differences among SARS-CoV-2 subpopulations.
Phylogeny-based classification primarily utilizes SNPs in multiple sequence alignment. Because the deletion mutations are often present in one or more sequences in sequence alignment, SNPs in these regions will also be excluded, thus reducing the available information for this classification. In this study, we coded each sequence position using a probability vector with as many numbers of components as possible to capture more information, in which the component in each position was composed of six characters, A, C, G, T, −(DEL), +(INS), and the values stored at each component were 0 or 1 (0 represented the absence, and 1 represented the presence). Considering that these ultra-low frequency mutations may be caused by sequencing errors, we filtered out these mutations, which helped to improve the accuracy of the classification. All SARS-CoV-2 isolates were grouped into 303 subpopulations. With the increase in the number of isolates, the number of subpopulations increased more slowly. By comparison, the PhenoGraph classification is highly consistent with the clade of GISAID with little difference. Hierarchical clustering analysis of obviously inconsistent subpopulations revealed that the PhenoGraph classification was more reliable and meticulous than GISAID. Phylogenetic analysis and phylogenetic network analysis showed that the PhenoGraph classification was well structured and could be used to improve the GISAID clades. We also determined the evolutionary relationships of the SARS-CoV-2 subpopulations and their spatial and temporal distributions.
As discussed above, SARS-CoV-2 already has rich genetic diversity, in which mutations are its main source, and recombination contributes very little though recombination event caused by co-infection of a single patient with viral particles of distinct clades may lead to the emergence of novel lineages [26]. However, regardless of the origin of the genetic diversity, our classification can accurately determine its refined subpopulations because our method is designed to dissect the inner structure of global SARS-CoV-2 population. Based on our classification, it is possible to capture the local and global patterns of SARS-CoV-2 genetic diversity in a timely and coherent manner, and track newly emerging lineages as they move between regions or human populations. It also involves but is not limited to the following potential applications [67]: (1) assist in developing the subpopulation-specific vaccines according to the structural differences in antigens; (2) contribute to develop specific tests to characterize whether a COVID-19 patient is caused by imported viruses or by viruses circulating in the domestic community and (3) identify viral subpopulations associated with different clinical outcomes in different regions and patients.
Conclusion
In conclusion, genetic diversification is a key factor in the continuous global outbreak of COVID-19, affecting epidemic prevention and control. SARS-CoV-2 subpopulations are almost clinically indistinguishable, but they have a molecular genotype that allows enhanced inference of the time origin and transmission dynamics of disease outbreaks that influences disease outcomes. The identification of SARS-CoV-2 subpopulations is of utmost importance for understanding its ongoing evolution and epidemiology during the pandemic and will possibly play an important role in surveillance and its eventual mitigation and control. Although researchers have established some rules for the genotyping and naming of SARS-CoV-2, different classification rules have their respective limitations; hence, there are needs for improvement [19]. In this study, we detected genetic mutations in 186 682 SARS-CoV-2 isolates. Our results indicated that the genome of SARS-CoV-2 evolved into a genome with lower GC content, and its genetic diversity soon approached saturation; therefore, it is necessary to perform objective classification. The PhenoGraph classification reported here adopted an unsupervised learning algorithm to perform an unbiased cluster analysis of the SARS-CoV-2 population, which has an advantage over other classifications. In summary, this study provides comprehensive information on the evolution of SARS-CoV-2 and objectively distinguishes the subpopulations of global SARS-CoV-2.
Key Points
Mutational characteristics reflect the effects of mutant selection. Our results suggest that the SARS-CoV-2 genome has evolved into a genome with lower GC content, which may facilitate rapid mass reproduction. We also found that the frameshift mutation was rare because such mutations may deter SARS-CoV-2 from completing the entire replication process or from evading natural immunity.
One major challenge in classifying genetic diversity below the species level is the inability to accurately dissect the population structure from its population divergence. PhenoGraph is a top-performing unsupervised tool for partitioning high-dimensional data into subpopulations according to the natural structure of the data. Herein, we first applied this algorithm to the classification of SARS-CoV-2 and successfully identified 303 subpopulations that were highly consistent with GISAID classification, but more objective, reliable and meticulous.
SARS-CoV-2 has accumulated many mutations since the outbreak. Herein, we analyzed the monthly changes in the cumulative number of newly emerged mutations and isolates carrying these mutations and the change in the number of subpopulations with increasing isolates. Our results suggest that growth rate of SARS-CoV-2 diversity has slowed down significantly.
Using phylogenetic network and correlation analyses, we determined the temporal, spatial and phylogenetic relationships of subpopulations, which was useful for investigating the evolutionary and epidemiological dynamics of the global SARS-CoV-2 population.
Supplementary Material
Acknowledgements
We would like to thank Prof. Chun-Ting Zhang for the invaluable assistance and inspiring discussions. We gratefully acknowledge the authors from the originating and submitting laboratories of the genomic sequences from GISAID’s EpiFlu™ Database on which this research is based.
Zhi-Kai Yang is an associate professor in the Fifth Affiliated Hospital of Guangzhou Medical University. His research interests are the bioinformatics and genomics with a special focus on microbial genomics, and functional genomics.
Lingyu Pan is a settlement specialist in the Guangzhou Nanxin Pharmaceutical Co., Ltd. Her research interests are the collection, processing, and presentation of big data.
Yanming Zhang is an associate researcher in the SinoGenoMax Co., Ltd./Chinese National Human Genome Center. His research interests are the bioinformatics and microbial metagenome.
Hao Luo is an assistant professor in the Department of Physics, School of Science, Tianjin University. His research focuses on DNA replication, gene essentiality and bioinformatics.
Feng Gao is a professor in the Department of Physics, School of Science, and the Frontiers Science Center for Synthetic Biology and Key Laboratory of Systems Bioengineering (Ministry of Education), Tianjin University. His researches are performed in the fields of computational biology and bioinformatics with a special focus on microbial genomics and functional genomics.
Contributor Information
Zhi-Kai Yang, Fifth Affiliated Hospital of Guangzhou Medical University, Guangzhou 510700, China.
Lingyu Pan, Guangzhou Nanxin Pharmaceutical Co., Ltd., Guangzhou 510700, China.
Yanming Zhang, SinoGenoMax Co., Ltd./Chinese National Human Genome Center, Guangzhou 510700, China.
Hao Luo, Department of Physics, School of Science, Tianjin University, Tianjin University, Tianjin 300072, China.
Feng Gao, Department of Physics, School of Science, and the Frontiers Science Center for Synthetic Biology and Key Laboratory of Systems Bioengineering (Ministry of Education), Tianjin University, Tianjin 300072, China.
Funding
The National Key Research and Development Program of China (grant number 2018YFA0903700); the Guangzhou Key Laboratory Fund (grant number 201905010004); the National Natural Science Foundation of China (grant numbers 21621004, 31571358 and 31801104).
References
- 1.Hartley DM, Perencevich EN. Public health interventions for COVID-19: emerging evidence and implications for an evolving public health crisis. JAMA 2020;323(19):1908–9. [DOI] [PubMed] [Google Scholar]
- 2.Jiang RD, Liu MQ, Chen Y, et al. Pathogenesis of SARS-CoV-2 in transgenic mice expressing human angiotensin-converting enzyme 2. Cell 2020;182(1):50–8. [DOI] [PMC free article] [PubMed] [Google Scholar]
- 3.Guan WJ, Ni ZY, Hu Y, et al. Clinical characteristics of coronavirus disease 2019 in China. New England J Med 2020;382(18):1708–20. [DOI] [PMC free article] [PubMed] [Google Scholar]
- 4.Yan FF, Gao F. Comparison of the binding characteristics of SARS-CoV and SARS-CoV-2 RBDs to ACE2 at different temperatures by MD simulations. Brief Bioinform 2021;22(2):1122–36. [DOI] [PMC free article] [PubMed] [Google Scholar]
- 5.Hu B, Guo H, Zhou P, et al. Characteristics of SARS-CoV-2 and COVID-19. Nat Rev Microbiol 2020;19(3):141–54. [DOI] [PMC free article] [PubMed] [Google Scholar]
- 6.WHO . Coronavirus disease (COVID-2019) situation reports. 2021. https://www.who.int/emergencies/diseases/novel-coronavirus-2019/situation-reports. (18 January 2021, date accessed).
- 7.Benvenuto D, Giovanetti M, Salemi M, et al. The global spread of 2019-nCoV: a molecular evolutionary analysis. Pathogens and Global Health 2020;114(2):64–7. [DOI] [PMC free article] [PubMed] [Google Scholar]
- 8.Wei X, Li X, Cui J. Evolutionary perspectives on novel coronaviruses identified in pneumonia cases in China. Natl Sci Rev 2020;7(2):239–42. [DOI] [PMC free article] [PubMed] [Google Scholar]
- 9.Gao F, Ou HY, Chen LL, et al. Prediction of proteinase cleavage sites in polyproteins of coronaviruses and its applications in analyzing SARS-CoV genomes. FEBS Lett 2003;553(3):451–6. [DOI] [PMC free article] [PubMed] [Google Scholar]
- 10.Holmes EC, Duchêne S. Evolutionary stasis of viruses? Nat Rev Microbiol 2019;17(5):329. [DOI] [PubMed] [Google Scholar]
- 11.Liu Q, Zhao S, Shi CM, et al. Population Genetics of SARS-CoV-2: Disentangling Effects of Sampling Bias and Infection Clusters. Genomics Proteomics Bioinformatics 2021. 10.1016/j.gpb.2020.06.001. [DOI] [PMC free article] [PubMed] [Google Scholar]
- 12.Foote AD. Sympatric speciation in the genomic era. Trends Ecol Evol 2018;33(2):85–95. [DOI] [PubMed] [Google Scholar]
- 13.Razifard H, Ramos A, Della Valle AL, et al. Genomic evidence for complex domestication history of the cultivated tomato in Latin America. Mol Biol Evol 2020;37(4):1118–32. [DOI] [PMC free article] [PubMed] [Google Scholar]
- 14.Ng S, Cowling BJ. Association between temperature, humidity and ebolavirus disease outbreaks in Africa, 1976 to 2014. Eur Secur 2014;19(35):20892. [DOI] [PubMed] [Google Scholar]
- 15.Kitchen A, Miyamoto MM, Mulligan CJ. Utility of DNA viruses for studying human host history: case study of JC virus. Mol Phylogenet Evol 2008;46(2):673–82. [DOI] [PubMed] [Google Scholar]
- 16.Smith DB, Bukh J, Kuiken C, et al. Expanded classification of hepatitis C virus into 7 genotypes and 67 subtypes: updated criteria and genotype assignment web resource. Hepatology 2014;59(1):318–27. [DOI] [PMC free article] [PubMed] [Google Scholar]
- 17.Tang X, Wu C, Li X, et al. On the origin and continuing evolution of SARS-CoV-2. Natl Sci Rev 2020;7(6):1012–23. [DOI] [PMC free article] [PubMed] [Google Scholar]
- 18.Hadfield J, Megill C, Bell SM, et al. Nextstrain: real-time tracking of pathogen evolution. Bioinformatics 2018;34(23):4121–3. [DOI] [PMC free article] [PubMed] [Google Scholar]
- 19.Song Y, Xu W. Genomic analysis platforms and typing methods for SARS-CoV-2 genome sequences. Chinese Journal of Virology 2021;37(01):181–90. [Google Scholar]
- 20.Rambaut A, Holmes EC, Hill V, et al. A dynamic nomenclature proposal for SARS-CoV-2 lineages to assist genomic epidemiology. Nat Microbiol 2020;5(11):1403–7. [DOI] [PMC free article] [PubMed] [Google Scholar]
- 21.GISAID . Clade and lineage nomenclature. 2021. https://www.gisaid.org/references/statements-clarifications/clade-and-lineage-nomenclature-aids-in-genomic-epidemiology-of-active-hcov-19-viruses/ (8 March 2021, date accessed).
- 22.Han AX, Parker E, Scholer F, et al. Phylogenetic clustering by linear integer programming (PhyCLIP). Mol Biol Evol 2019;36(7):1580–95. [DOI] [PMC free article] [PubMed] [Google Scholar]
- 23.Zielezinski A, Vinga S, Almeida J, et al. Alignment-free sequence comparison: benefits, applications, and tools. Genome Biol 2017;18(1):186. [DOI] [PMC free article] [PubMed] [Google Scholar]
- 24.Li X, Giorgi EE, Marichannegowda MH, et al. Emergence of SARS-CoV-2 through recombination and strong purifying selection. Sci Adv 2020;6(27):eabb9153. [DOI] [PMC free article] [PubMed] [Google Scholar]
- 25.Nie Q, Li X, Chen W, et al. Phylogenetic and phylodynamic analyses of SARS-CoV-2. Virus Res 2020;287:198098. [DOI] [PMC free article] [PubMed] [Google Scholar]
- 26.Varabyou A, Pockrandt C, Salzberg SL, et al. Rapid detection of inter-clade recombination in SARS-CoV-2 with Bolotie. Genetics 2021. 10.1093/genetics/iyab074. [DOI] [PMC free article] [PubMed] [Google Scholar]
- 27.VanInsberghe D, Neish AS, Lowen AC, et al. Recombinant SARS-CoV-2 genomes are currently circulating at low levels. bioRxiv 2021;2020–08. doi: 10.1101/2020.08.05.238386 2020, preprint: not peer reviewed. [DOI] [PMC free article] [PubMed] [Google Scholar]
- 28.Derkarabetian S, Castillo S, Koo PK, et al. A demonstration of unsupervised machine learning in species delimitation. Mol Phylogenet Evol 2019;139:106562. [DOI] [PMC free article] [PubMed] [Google Scholar]
- 29.Gao R, Zu W, Liu Y, et al. Quasispecies of SARS-CoV-2 revealed by single nucleotide polymorphisms (SNPs) analysis. Virulence 2021;12(1):1209–26. [DOI] [PMC free article] [PubMed] [Google Scholar]
- 30.Levine JH, Simonds EF, Bendall SC, et al. Data-driven phenotypic dissection of AML reveals progenitor-like cells that correlate with prognosis. Cell 2015;162(1):184–97. [DOI] [PMC free article] [PubMed] [Google Scholar]
- 31.Qian Y, Wei C, Eun-Hyung Lee F, et al. Elucidation of seventeen human peripheral blood B-cell subsets and quantification of the tetanus response using a density-based method for the automated identification of cell populations in multidimensional flow cytometry data. Cytometry B Clin Cytom 2010;78(S1):S69–82. [DOI] [PMC free article] [PubMed] [Google Scholar]
- 32.Aghaeepour N. flowType: Phenotyping Flow Cytometry Assays. Bioconductor Repository 2011. [Google Scholar]
- 33.Zare H, Shooshtari P, Gupta A, et al. Data reduction for spectral clustering to analyze high throughput flow cytometry data. BMC Bioinformatics 2010;11:403. [DOI] [PMC free article] [PubMed] [Google Scholar]
- 34.Liu X, Song W, Wong BY, et al. A comparison framework and guideline of clustering methods for mass cytometry data. Genome Biol 2019;20(1):297. [DOI] [PMC free article] [PubMed] [Google Scholar]
- 35.Shu Y, McCauley J. GISAID: global initiative on sharing all influenza data–from vision to reality. Eur Secur 2017;22(13):30494. [DOI] [PMC free article] [PubMed] [Google Scholar]
- 36.Wu F, Zhao S, Yu B, et al. A new coronavirus associated with human respiratory disease in China. Nature 2020;579(7798):265–9. [DOI] [PMC free article] [PubMed] [Google Scholar]
- 37.Katoh K, Standley DM. A simple method to control over-alignment in the MAFFT multiple sequence alignment program. Bioinformatics 2016;32(13):1933–42. [DOI] [PMC free article] [PubMed] [Google Scholar]
- 38.Katoh K, Rozewicki J, Yamada KD. MAFFT online service: multiple sequence alignment, interactive sequence choice and visualization. Brief Bioinform 2019;20(4):1160–6. [DOI] [PMC free article] [PubMed] [Google Scholar]
- 39.van der Maaten LJP, Hinton GE. Visualizing high-dimensional data using t-SNE. J Mach Learn Res 2008;9:2579–605. [Google Scholar]
- 40.Price MN, Dehal PS, Arkin AP. FastTree: computing large minimum evolution trees with profiles instead of a distance matrix. Mol Biol Evol 2009;26(7):1641–50. [DOI] [PMC free article] [PubMed] [Google Scholar]
- 41.Mirarab S, Reaz R, Bayzid MS, et al. ASTRAL: genome-scale coalescent-based species tree estimation. Bioinformatics 2014;30(17):i541–8. [DOI] [PMC free article] [PubMed] [Google Scholar]
- 42.Letunic I, Bork P. Interactive tree of life (iTOL) v4: recent updates and new developments. Nucleic Acids Res 2019;47(W1):W256–9. [DOI] [PMC free article] [PubMed] [Google Scholar]
- 43.Forster P, Forster L, Renfrew C, et al. Phylogenetic network analysis of SARS-CoV-2 genomes. Proceedings of the National Academy of the Sciences of the United States of America 2020;117(17):9241–3. [DOI] [PMC free article] [PubMed] [Google Scholar]
- 44.Bandelt HJ, Forster P, Rohl A. Median-joining networks for inferring intraspecific phylogenies. Mol Biol Evol 1999;16:37–48. [DOI] [PubMed] [Google Scholar]
- 45.Day T, Gandon S, Lion S, et al. On the evolutionary epidemiology of SARS-CoV-2. Curr Biol 2020;30(15):R849–57. [DOI] [PMC free article] [PubMed] [Google Scholar]
- 46.Potdar V, Vipat V, Ramdasi A, et al. Phylogenetic classification of the whole-genome sequences of SARS-CoV-2 from India & evolutionary trends. Indian J Med Res 2021;153(1):166. [DOI] [PMC free article] [PubMed] [Google Scholar]
- 47.Mercatelli D, Giorgi FM. Geographic and genomic distribution of SARS-CoV-2 mutations. Front Microbiol 2020;11:1800. [DOI] [PMC free article] [PubMed] [Google Scholar]
- 48.Goldhill DH, Turner PE. The evolution of life history trade-offs in viruses. Curr Opin Virol 2014;8:79–84. [DOI] [PubMed] [Google Scholar]
- 49.Khalilov R, Hosainzadegan M, Eftekhari A, et al. Overview of the environmental distribution, resistance, mortality, and genetic diversity of new coronavirus (COVID-19). Advances in Biology & Earth Sciences 2020;5:7–12. [Google Scholar]
- 50.Wasik BR, Turner PE. On the biological success of viruses. Annu Rev Microbiol 2013;67:519–41. [DOI] [PubMed] [Google Scholar]
- 51.Zhou P, Yang XL, Wang XG, et al. A pneumonia outbreak associated with a new coronavirus of probable bat origin. Nature 2020;579(7798):270–3. [DOI] [PMC free article] [PubMed] [Google Scholar]
- 52.Lu R, Zhao X, Li J, et al. Genomic characterisation and epidemiology of 2019 novel coronavirus: implications for virus origins and receptor binding. Lancet 2020;395(10224):565–74. [DOI] [PMC free article] [PubMed] [Google Scholar]
- 53.Wang Y, Wang D, Zhang L, et al. Intra-host variation and evolutionary dynamics of SARS-CoV-2 populations in COVID-19 patients. Genome Med 2021;13(1):1–13. [DOI] [PMC free article] [PubMed] [Google Scholar]
- 54.Xiao M, Liu X, Ji J, et al. Multiple approaches for massively parallel sequencing of SARS-CoV-2 genomes directly from clinical samples. Genome Med 2020;12(1):1–15. [DOI] [PMC free article] [PubMed] [Google Scholar]
- 55.Xiong C, Jiang L, Chen Y, et al. Evolution and variation of 2019-novel coronavirus. Biorxiv 2020. doi: 10.1101/2020.01.30.926477 30 January 2020, preprint: not peer reviewed. [DOI] [Google Scholar]
- 56.Lauring AS, Hodcroft EB. Genetic variants of SARS-CoV-2-what do they mean? JAMA 2021;325(6):529–31. [DOI] [PubMed] [Google Scholar]
- 57.Hoffmann M, Arora P, Groß R, et al. SARS-CoV-2 variants B. 1.351 and P. 1 escape from neutralizing antibodies. Cell 2021;184(9):2384–2393.e12. [DOI] [PMC free article] [PubMed] [Google Scholar]
- 58.Chen RE, Zhang X, Case JB, et al. Resistance of SARS-CoV-2 variants to neutralization by monoclonal and serum-derived polyclonal antibodies. Nat Med 2021;27(4):717–26. [DOI] [PMC free article] [PubMed] [Google Scholar]
- 59.Wang P, Nair MS, Liu L, et al. Antibody resistance of SARS-CoV-2 variants B. 1.351 and B. 1.1. 7. Nature 2021;593(7857):130–5. [DOI] [PubMed] [Google Scholar]
- 60.Zhou B, Thao TTN, Hoffmann D, et al. SARS-CoV-2 spike D614G change enhances replication and transmission. Nature 2021;592(7852):122–7. [DOI] [PubMed] [Google Scholar]
- 61.Davies NG, Abbott S, Barnard RC, et al. Estimated transmissibility and impact of SARS-CoV-2 lineage B. 1.1. 7 in England. Science 2021;372(6538):eabg3055. [DOI] [PMC free article] [PubMed] [Google Scholar]
- 62.Ozono S, Zhang Y, Ode H, et al. SARS-CoV-2 D614G spike mutation increases entry efficiency with enhanced ACE2-binding affinity. Nat Commun 2021;12(1):848. [DOI] [PMC free article] [PubMed] [Google Scholar]
- 63.Mo Y. Probing the nature of hydrogen bonds in DNA base pairs. J Mol Model 2006;12(5):665–72. [DOI] [PubMed] [Google Scholar]
- 64.Šmarda P, Bureš P, Horová L, et al. Ecological and evolutionary significance of genomic GC content diversity in monocots. Proc Natl Acad Sci 2014;111(39):E4096–102. [DOI] [PMC free article] [PubMed] [Google Scholar]
- 65.Wang D, Wang Y, Sun W, et al. Population bottlenecks and intra-host evolution during human-to-human transmission of SARS-CoV-2. Front Med 2021;8:585358. [DOI] [PMC free article] [PubMed] [Google Scholar]
- 66.Chen H, Lau MC, Wong MT, et al. Cytofkit: a bioconductor package for an integrated mass cytometry data analysis pipeline. PLoS Comput Biol 2016;12(9):e1005112. [DOI] [PMC free article] [PubMed] [Google Scholar]
- 67.Liang H, Zheng L, Xia H, et al. SARS-CoV-2 infection in China—before the pandemic. PLoS Negl Trop Dis 2020;14(8):e0008472. [DOI] [PMC free article] [PubMed] [Google Scholar]
Associated Data
This section collects any data citations, data availability statements, or supplementary materials included in this article.