

Abstract
This study examines the extent to which iron deficiency in infancy contributes to adverse neurocognitive and educational outcomes in young adulthood directly and indirectly, through its influence on poor verbal cognition and attention problems in childhood. Young adults (N = 1,000, M age = 21.3 years, 52% female; of mixed Spanish and indigenous descent) from working-class families in Santiago, Chile, completed instruments assessing memory, processing speed, mental flexibility, and educational attainment. Iron status was assessed at ages 6, 12, and 18 months, and verbal intelligence, inattention, and sluggish cognitive tempo (SCT) symptoms were assessed at age 10. Results indicated that young adults who had iron-deficiency in infancy had poor executive control at age 21. Severity of iron deficiency during infancy was associated with lower verbal IQ and more frequent inattention and SCT symptoms in childhood, and with lower educational attainment in young adulthood through its effect on inattention. No additional indirect effects were found. Interventions directed toward improving cognitive and attention deficits linked to early-life iron deficiency appear warranted and could alter the course to adult functioning. Further research on the impact of such interventions would be helpful.
Keywords: iron deficiency, executive function, inattention, memory, verbal intelligence
Iron deficiency is the world’s leading nutrient deficiency, affecting more than 1.5 million U.S. children and approximately 115 million children worldwide (Gupta et al., 2017; Kassebaum, 2016). Iron deficiency during the critical 6- to 24-month postnatal window of rapid brain development is particularly damaging. There is evidence of brain structure and function alterations related to early-life iron deficiency, with several studies noting disruptions in myelination, neurogenesis, dendrite growth, and brain connectivity (Algarin et al., 2017; Bastian et al., 2016; Georgieff, 2011). Alterations in these brain processes can impinge on neurocognition, including speed of processing, mental focus, and executive control (Doom & Georgieff, 2014; Radlowski & Johnson, 2013). Indeed, children who were iron-deficient anemic in infancy show deficits in recognition memory, response inhibition, and have slower auditory and visual system functioning (Algarin et al., 2003, 2013; Congdon et al., 2012). Several studies have also noted attention deficits, with former iron-deficient children exhibiting a lower ability to focus, sustain, or shift attention (found at ages 2, 10, and 19 years) (Fuglestad et al., 2013; Lozoff et al., 2000; Lukowski et al., 2010). Such children also show high levels of sluggish cognitive tempo (SCT) symptoms, an attention deficit subtype involving mental fogginess, confusion, and slow responsivity (found at ages 4, 5, and 10 years of age) (Chang et al., 2011; Lozoff et al., 2007). Lower verbal intelligence, or the ability to express and understand language, has also been linked to iron deficiency in infancy (Arija et al., 2006; Larson et al., 2018; reviewed in McCann & Ames, 2007). One study found that children who were born with low iron stores showed decreased language development at age 5 relative to children with normal iron stores at birth (Tamura et al., 2002). In a sample of internationally-adopted 2- to 5-year-old children, more severe iron deficiency was associated with both more frequent attention deficient/hyperactivity symptoms and lower IQ scores, the latter measured as receptive and expressive language abilities (Doom et al., 2015).
Given the consistency of findings indicating attention and verbal cognition deficits associated with postnatal iron deficiency, a cascade analysis of interconnected effects across development would seem informative. A developmental cascade framework asserts that suboptimal functioning in one domain disrupts the developing scaffolding of related abilities, setting into motion a chain of deficits that negatively affect subsequent development (Masten & Cicchetti, 2010). We are unaware of any study that has followed children who were iron deficient in infancy and examined how childhood attention and cognitive impairments affect their functioning as adults. This would seem important as childhood inattention is associated with a wide range of neurobehavioral and functional impairments, such as poor inhibitory control, self-regulation, working memory, and lower educational attainment (Barkley, 2012, 2013; Wåhlstedt & Bohlin, 2010). Children with SCT symptoms exhibit deficits in mental processing speed, selective attention, and planning, and have lower levels of completed education as adults than non-affected controls (Becker et al., 2016; Becker & Barkley, 2018). Low verbal intelligence can hinder overall adaptation as it is paramount to general intellectual functioning (Skuse et al., 2009). Verbal intelligence shows strong links to working memory and mental processing abilities, which are essential for learning and educational attainment (Alloway & Alloway, 2010; Fry & Hale, 2000). Thus, supported by the findings cited above, the developmental cascade theoretical framework would contend that the cognitive and attention deficits that derive from early-life iron deficiency trickle down to adversely affect individuals’ subsequent neurocognitive and educational functioning. Understanding developmental pathways that begin in childhood and explicate a temporal ordering would be useful to preventive efforts so that modifiable risks could be targeted and minimized.
As a result of the brain processing and structure alterations associated with iron-deficiency, direct long-term effects also seem likely. Findings from a follow-up study of Costa Rican infants who had severe, chronic iron-deficiency anemia (i.e., defined as iron-deficient anemia first identified at 1 to 2 years of age and accompanied by elevated erythrocyte protoporphyrin 3 months after receiving iron therapy) showed deficits in recognition memory, inhibitory control, set-shifting, and planning at age 19 (Lukowski et al., 2010). When studied at age 25 years, participants were less likely to have completed secondary school or to have pursued further education or training (Lozoff et al., 2013). These findings point to the long-lasting effects of early-life iron deficiency and reinforce the importance of understanding mediating cognitive processes that link to subsequent adult functioning.
The Current Study
The current study has three aims. First, we examine the extent to which severity of iron deficiency during infancy is associated with verbal intelligence and inattentive and SCT symptoms within a large cohort of Chilean children. Iron deficiency severity is operationalized as the continuous physiological progression of iron status, ranging from iron sufficient to iron deficient-without anemia to iron-deficient with anemia (Georgieff, 2017). Second, we determine whether direct associations exist between iron deficiency severity in infancy and functioning in young adulthood. For this aim, we examine participants’ memory, processing speed, executive function, and educational attainment. Third, we examine how possible deficits in children’s verbal and attention abilities that stem from infant iron deficiency contribute to downstream functioning in young adulthood (Figure 1). Specifically, we test whether childhood cognitive and attention deficits mediate the association between iron deficiency in infancy and neurocognitive and educational outcomes in young adulthood. Findings from the current sample have shown that iron-deficiency anemia in infancy relates to lower verbal abilities at age 5 (East et al., 2019) and more frequent SCT symptoms at ages 5 and 10 years (East et al., 2017, 2018). It remains unclear, however, whether these deficits that derive from prior iron deficiency interfere with neurocognitive functioning or educational level at young adulthood. Such findings would provide evidence that iron deficiency in infancy initiates a cascade of effects that contributes to a multitude of suboptimal outcomes in later life.
Figure 1.
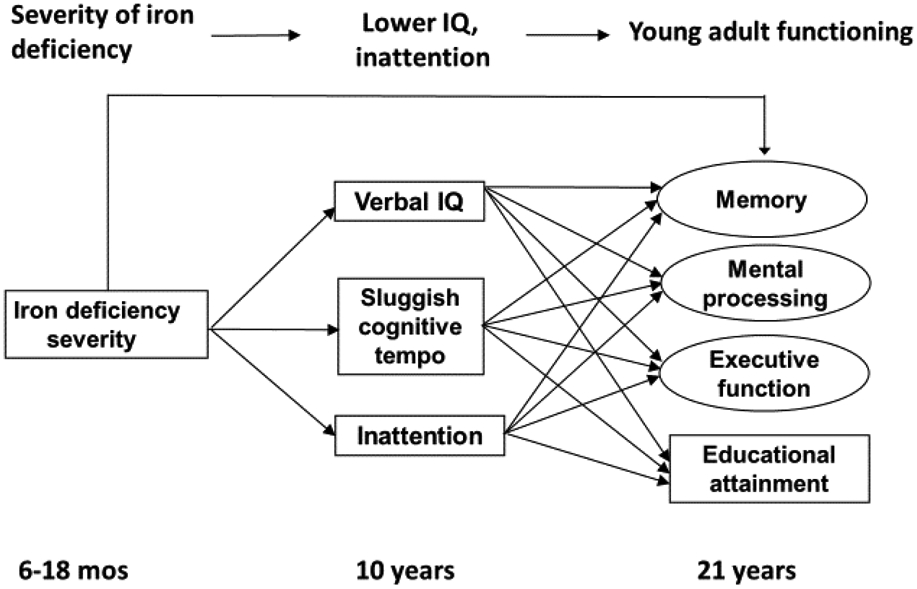
Conceptual figure of the long-term effects related to iron deficiency severity in infancy as mediated by verbal IQ, sluggish cognitive tempo symptoms, and inattention at age 10. The outcomes at age 21 years were analyzed in separate models.
In addition to examining effects stemming from iron deficiency severity, we also compare the three iron status groups to assess effects associated with each condition. For example, analyses comparing participants who were iron sufficient (IS) to those who were iron deficient-only (ID without anemia) in infancy would be important as ID without anemia is roughly 2.5 times more common than ID with anemia (Gupta et al., 2017). Moreover, ID-without anemia is asymptomatic and, therefore, often goes undetected. Animal models demonstrate that brain iron can be affected by deficiency prior to the onset of anemia (Georgieff, 2011), and there is growing evidence that early-life ID without anemia can disrupt children’s learning, memory, and socioemotional adjustment (Doom et al., 2014, 2020; Fretham et al., 2011). Comparisons involving children who were iron-deficient anemic (IDA) to children who were ID-only in infancy could reveal whether IDA is associated with deficits above and beyond those associated with ID without anemia. Again, few studies have examined this issue, with limited results indicating more severe impairment in children who had IDA compared to those who had ID-only in infancy (Akman et al., 2004; Doom et al., 2019; Lozoff et al., 2008). The key distinguishing characteristic between ID and IDA is that in IDA there are lower concentrations of serum hemoglobin, the oxygen-carrying protein found in red blood cells that transports oxygen to all organs of the body, including the brain (Lopez et al., 2016). Anemia is the most severe and end-stage form of deficiency, and the state wherein the brain is already iron deficient owing to the prioritization of available iron to red blood cells over all other tissues, including the brain (Georgieff, 2017). Given that different levels of iron deficiency are proxies for levels of brain iron (Georgieff, 2017), it would seem important to determine whether the various iron status groups differ in regards to cognitive or neurobehavioral indicators. We examine this issue and compare participants who were IS, ID-only, or IDA in infancy in terms of their verbal IQ, inattention, and SCT symptoms at age 10, and their memory, mental processing, executive functioning, and educational attainment at age 21. We also test mediating processes involving age 10 verbal IQ and inattention to 21-year outcomes initiated by comparisons among the three iron status groups.
Method
Sample and Study Design
Participants were 1,000 young adults (M age = 21.3 years; 52% female; of mixed Spanish and indigenous descent) who have been studied since infancy as part of an iron-deficiency anemia preventive trial or neuromaturation study (Lozoff et al., 2003). Six-month old infants were recruited from community clinics in working-class neighborhoods in Santiago, Chile between 1991 and 1996, a period during which iron deficiency in infants was widespread due to the absence of a national program for iron-fortified infant formula. Eligibility criteria for study entry included singleton, term delivery, birth weight ≥ 3.0 kg, and no major congenital anomalies or birth complications, phototherapy, illness, or hospitalization longer than 5 days. Infants were screened for IDA prior to entry into the trial by a finger stick to determine capillary hemoglobin level. Infants with low hemoglobin (≤ 103 g/L) and the next nonanemic infant were evaluated by venipuncture. Those with venous hemoglobin (Hb ≤ 100 g/L) (n = 73) were excluded from the preventive trial, treated with iron, and enrolled in a neuromaturation study, along with the next clearly non-anemic infant who served as a control (venous Hb ≥ 115 g/L; n = 62). The neuromaturation study involved laboratory tests in addition to questionnaire and interview assessments of the preventive trial. All other infants (N = 1,657; Hb > 100 g/L) were randomized to receive study-provided formula between 6 and 12 months of age: 718 infants were randomized to receive iron-fortified formula (12.7 mg/L); 405 were randomized to receive a low-iron formula (2.3 mg/L); and 534 were randomized to receive unmodified cow milk (a no-added iron condition). Results of the preventive trial showed that iron supplementation reduced ID with and without anemia at 12 months (Lozoff et al., 2003). Supplementation also improved social behavior in infancy and at 10 years but had no association with children’s attention at age 10 (Lozoff et al., 2014). (Verbal IQ at age 10 was not examined vis-à-vis iron supplementation; Lozoff et al., 2014). Iron supplementation was not associated with any of this study’s 10-year mediators or 21-year outcomes (described below).
The current sample involved infants who participated in the neuromaturation study (n = 135) or the preventive trial (n = 1,657) and included those followed up at ages 10 years (N = 1,119) and 21 years (N = 1,000). The 1,000 participants studied at age 21 form the current analytic sample. At age 10, verbal IQ, inattention, and sluggish cognitive tempo (SCT) symptoms were assessed. Children who were or were not assessed at 10 years were similar in infant background characteristics, such as iron status, child sex, birth weight, family socioeconomic status (SES), and maternal education (Lozoff et al., 2012). At age 21, participants completed neurocognitive assessments and were asked about their current educational level (Table 1). Participants who did and did not participate at 21 years were comparable on all background and family characteristics, except that individuals who participated at 21 were more likely to be female (52% female at 21-year follow-up, 48% female at infancy). Sex, as well as other characteristics (described below), were included as covariates in analyses. (Supplemental Figure 1 illustrates sample loss and follow-up).
Table 1.
Participant Characteristics and Descriptive Statistics of Study Variables
| N | M or % | SD | Range | |
|---|---|---|---|---|
| Infant assessment | ||||
| Iron sufficient (IS) | 419 | 41.9% | -- | -- |
| Iron deficient (ID) | 428 | 42.8% | -- | -- |
| Iron-deficient-anemic (IDA) | 153 | 15.3% | -- | -- |
| †Sex (% female) | 1000 | 52.0% | -- | -- |
| †Mothers’ level education | 998 | 9.5 | 2.70 | 1 – 17 |
| †Mothers’ IQ | 996 | 83.9 | 9.3 | 52 – 110 |
| †Home support | 996 | 30.3 | 4.7 | 16 – 42 |
| †Family SESa | 996 | 27.3 | 6.3 | 13 - 65 |
| †Received iron supplementation | 925 | 66% | -- | -- |
| 10-year assessment | ||||
| Age (years) | 858 | 10.0 | 0.1 | 9.9 – 11.0 |
| WISC-verbal IQ | 858 | 42.0 | 11.0 | 13 – 75 |
| Sluggish cognitive tempo | 854 | 2.4 | 1.9 | 0 – 10 |
| Inattention | 854 | 3.7 | 2.3 | 0 – 10 |
| Young adult assessment | ||||
| Age (years) | 1000 | 21.3 | 0.5 | 21 – 24 |
| §ISL-recallb | 944 | 26.3 | 3.9 | 13 - 35 |
| §ISL-delayed recallb | 944 | 9.6 | 1.8 | 0 - 12 |
| §Detection task – process. speedc | 944 | 2.5 | 0.1 | 2.3 – 3.2 |
| §Identification – perform. speedc | 944 | 2.7 | 0.7 | 2.6 – 3.0 |
| Trail making test, Part B (secs) | 790 | 81.8 | 30.5 | 20 – 228 |
| Trail making test, Part B – A (secs) | 790 | 37.8 | 26.9 | 0 - 195 |
| Education completed (years) | 1000 | 12.3 | 1.7 | 5 – 15 |
A covariate in analyses.
Higher scores indicate more socioeconomic disadvantage.
Scored as number of words correctly recalled.
Scored in milliseconds.
Assessed using the CogState computing platform. ISL = International Shopping List memory task.
Procedure
At ages 10 and 21 years, participants underwent assessments at the Institute of Nutrition and Food Technology at the University of Chile. Tests were administered by a psychologist trained in the administration of such tests and according to standard instructions. At child age 10, mothers completed questionnaires about their child’s behavior. Tests were administered in Spanish, and all tests had good validity and were equivalent to their English versions. The infant study and the 10-year and 21-year follow-ups were approved by the human research protections review boards at the University of California, San Diego, the University of Michigan, and the University of Chile (UC-San Diego protocol #121649X, “Neuromaturational Delays in Iron Deficient Anemic Infants”). Signed informed consent was obtained from parents at the infant and 10-year assessments; assent was obtained from children at age 10. Participants provided informed written consent at the 21-year follow-up.
Measures
Iron Status in Infancy
Anemia at 6 months was defined as a venous hemoglobin concentration ≤ 100 g/L. Iron deficiency (without anemia) at 6 months was defined as two or more iron measures in the deficient range (mean corpuscular volume < 70 fL, erythrocyte protoporphyrin > 100 μg/L red blood cells, and serum ferritin < 12 mg/L; Baker & Greer, 2010). At 12 months of age, venipuncture blood specimens were drawn on all infants. At 18 months, a repeat venipuncture was performed for children in the low- and no-added iron conditions of the preventive trial. Of the 939 infants in the low-iron (n = 405) or no-added iron (n = 534) conditions, 207 (22%) refused or had missing 18-month hemoglobin data; the 718 infants in the high-iron condition were not offered a venipuncture. All children in the neuromaturation study provided a blood sample at 18 months (n = 135). For those not having a hemoglobin value at 18 months, blood status was imputed using multiple imputation techniques (Rubin, 1996) with IVEWARE software within SAS (Raghunathan et al., 2000) using demographic, anthropometric, environmental, and iron status data available at infancy and early childhood (Newman, 2003). The best predictor of 18-month iron status in this sample was 12-month iron status (Lozoff et al., 2006). Iron supplementation group (no-added iron, low-iron, high-iron formula) was also a significant predictor of 18-month iron statusNo participant was categorized on iron status based solely on 18-month imputed data as all infants had hemoglobin values at 6 and 12 months.
Anemia at 12 and 18 months was defined as venous hemoglobin < 110 g/L. Iron deficiency (without anemia) at 12 and 18 months was defined as having two of three iron measures in the iron-deficient range (described above; Baker & Greer, 2010). All infants diagnosed as anemic at any time during infancy were determined to be iron-deficient anemic, caused by a nutrient deficiency and not caused by other factors (gastrointestinal bleeding, malaria, parasites, or sickle cell disease; Lozoff et al., 2003). Because testing and treatment of IDA occurred every 6 months, the longest an 18-month-old child could have been iron-deficient anemic was typically 6 months. However, a child could have been iron deficient for any duration between 6 and 18 months of age. Infants’ iron status was analyzed as the most severe diagnosis at 6, 12 or 18 months (Table 1). Iron measures were assessed again at 10 years and during adolescence. All children within the current sample had good iron status in childhood and adolescence.
Measures at age 10 years
Verbal intelligence was measured by children’s performance on the abbreviated version of the Wechsler Intelligence Scale for Children - Revised test (WISC-R; Wechsler, 1974). We used the sum of the verbal subtest scores of similarities (verbal reasoning; 15 items), comprehension (verbal understanding; 16 items), and information (ability to acquire and assimilate information; 15 items). The total standardized verbal score was analyzed (possible score range: 5 – 95).
Inattention and sluggish cognitive tempo (SCT) symptoms were assessed using mother ratings on the Child Behavior Checklist (CBCL; Achenbach & Ruffle, 2000). Five items assessed inattention: can’t concentrate or can’t pay attention; impulsive or acts without thinking; poor school work; can’t sit still or is restless or hyperactive; unusually loud (Cronbach’s alpha = .70), and five items assessed SCT symptoms: confused or seems in a fog; daydreams or gets lost in thoughts; stares blankly; underactive or slow moving or lacks energy; overtired without good reason (Cronbach’s alpha = .67). Both sets of items are consistent with the Diagnostic and statistical Manual of Mental Disorders (5th ed.) diagnoses of Attention Deficit Disorder and SCT Nakamura et al., 2009). However, the current scoring of inattention and SCT is not intended to indicate clinical diagnoses. Response options on the CBCL are not true (coded as 0), somewhat or sometimes true (1), and very true or often true (2). Scores were summed within each scale, with high scores indicating frequent inattention or SCT behaviors (possible range: 0 – 10).
Measures at age 21 years
Memory was assessed by the International Shopping List (ISL) task within the CogState Computerized Brief Battery testing platform (Maruff et al., 2009; Thompson et al., 2011). The ISL task involves presenting participants a list of 12 items and asking them to immediately recall them. Three trials were conducted and scores were calculated by summing the number of correct responses across the three trials. The ISL also involves a delayed recall test, wherein participants are asked to recall the items a second time after a delay. ISL-delayed recall (ISL-DR) was assessed in one trial and analyzed as the number of correct responses. The ISL shows good test-retest reliability and high sensitivity to detecting memory impairment (Thompson et al., 2011).
Processing speed was assessed by performance on the two CogState tests of Identification and Detection (Maruff et al., 2009). In the Identification task, cards are presented and the respondent must press a computer key if the card is red or, on a second trial, not red. The Detection task involves pressing a computer key when a pre-identified stimulus card is turned face up. Both the Identification and Detection tasks are scored in milliseconds, with higher scores reflecting longer response times.
Executive function was assessed by the Trail Making Test (TMT), which measures visual searching and sequencing, speed of processing, and mental flexibility (Sánchez-Cubillo et al., 2009). The TMT involves drawing lines between numbered circles in consecutive order (from 1 to 25) as quickly as possible (Part A). Immediately thereafter, participants are asked to rapidly draw lines connecting numbers and letters in alternating order (1 to A to 2 to B etc.; Part B). Part A assesses visuoperceptual abilities and processing speed. The increased demands of Part B elicit the ability to inhibit a familiar response and to alternate between different response sets (task switching; Gaudino et al., 1995). The time to complete Part B minus the time to complete Part A is used to assess task switching independent of processing speed and provides a relatively pure indicator of executive control or impulse inhibition (Sánchez-Cubillo et al., 2009). We analyzed the time (in seconds) to complete Part B (mental flexibility), and Part B minus Part A (executive control), with higher scores indicating poorer performance.
Educational attainment was assessed by interview as the total number of years (and months) of formal education completed. Although it is likely that many individuals had not yet finished their schooling by the 21-year follow-up, several studies show that educational level measured before individuals have finished their schooling is an important forecaster of eventual educational attainment (reviewed in Strenze, 2007).
Covariates
Covariates determined a priori to be related to study variables were: child sex, whether the participant received iron supplementation as part of the infancy preventive trial (yes = 1, no = 0), family socioeconomic status (SES), maternal education (years), maternal IQ (Wechsler, 1955), and the nurturance and support in the home environment. (Supplemental Figure 2 shows expected confounding). Nurturance within the home was measured when participants were 9 months of age using the Home Observation for Measurement of the Environment (Caldwell & Bradley, 1984). Family SES was measured using the 13-item Graffar (1956) poverty index, which assesses living and housing conditions and material possessions scored on a 6-point rating scale (range 13 – 78), with high scores indicating greater socioeconomic disadvantage. SES at participants’ infancy was used in analyses as this involved no missing data. Of the data available at both infancy and 16 years, SES improved uniformly for 95% of the sample due to Chile’s recent economic transition to a high-income developed country. Participants’ ages at the 10-year and 21-year follow-ups were initially considered as controls but had little variability and were not associated with any of the study variables and, thus, not considered further. Covariates not associated with an endogenous variable (P > .30) were deleted from that model path (Little, 2013). This changed the model estimates very slightly and did not affect the significance levels of any of the pathway coefficients.
Analytic Strategy
We used path analysis and structural equation modeling (SEM) to examine direct and mediating relations between iron deficiency in infancy and functioning at childhood and young adulthood (Mplus v. 8.2, Muthén & Muthén, 1998-2017). Analyses modeled iron deficiency as the exposure variable, which was analyzed as both a continuous variable (reflecting increasing severity, range 0 to 2: iron sufficient = 0; iron deficient without anemia = 1; iron-deficient anemic = 2), and in separate analyses, iron status was coded into three separate groups of IS, ID, and IDA. The latter coding allows for contrasts between the various groupings (IS vs. ID; IS vs. IDA; ID vs. IDA) and can address effects that might not be continuous but rather group-specific. For the grouping contrasts, iron status was dummy coded into three categories of IS, ID, and IDA. IS was the omitted category because it served as the reference group, and the two exogenous variable comparisons were ID versus IS and IDA versus IS. To compare the IDA and ID groups directly, we specified new parameters derived from parameter estimates for the two dummy variables in the full model. The standard errors for these new parameters were produced using the delta method (Muthén, 2011).
Three models were computed involving the following 21-year endogenous variables: memory and processing speed (model 1; N = 944); the Trail Making Test scores (model 2; N = 790); and educational attainment (model 3; N = 1,000) (Figure 2). Listwise deletion was used to partition the sample by those who had complete data on each outcome. All three model samples were equivalent with regard to background characteristics and mediating variables (Supplemental Table S1.)
Figure 2.

Results of the mediated models for memory and mental processing (N = 944), Trail Making Test (N = 790), and educational attainment (N = 1,000). Standard coefficients are shown. a Iron deficiency severity coded as: iron sufficient = 0; iron deficient (without anemia) = 1; iron-deficient anemic = 2. Dashed lines were not statistically significant (P > .05). Model controls are not shown but are listed in Table 3. ISL = International Shopping List memory task. DR = delayed recall. TMT-B = Trail Making Test Part B. TMT B-A = Trail Making Test Part B minus Part A. *P < .05. **P < .01. ***P < .001.
We conducted the modeling analyses using well-established fit guidelines of the comparative fit index (CFI > .95), the root mean square error of approximation (RMSEA ≤ .06), and the standardized root mean square residual (SRMR < .08) (Kline, 2016). The mediators were correlated and the endogenous variables were correlated (where applicable) so as to isolate the variance of each variable. Mediation was tested using the INDIRECT command within Mplus using bias-corrected bootstrapping methods (5,000 iterations). All cases were retained (by available sample size per endogenous variable) using the full information maximum likelihood method (FIML). FIML was used in all models. The STDY standardization was used to estimate effect sizes for the iron status grouping comparisons, as it standardizes only the dependent variable leaving the dichotomous grouping variable correctly scaled. We used Bonferroni correction to control for multiple testing and to avoid Type I error associated with the 15 indirect effect tests conducted. We conducted post hoc power analyses for the indirect effects incorporating Monte Carlo simulations using the tool developed by Schoemann, Boulton, and Short (2017).
The model involving the memory and processing speed scores incorporated latent variables derived by confirmatory factor analysis (CFA), with memory indicated by the two International Shopping List task scores, and processing speed indicated by the Detection and Identification task scores. The measurement model showed high factor loadings (ISL .78, ISL-recall .82, detection .64, identification .85) and good fit (CFI = 1.00, RMSEA = .000, SRMR = .002).
Prior to conducting analyses, we assessed normality of the observed variables. Analyses showed that the Trails Part B scores were positively skewed, with 6 outliers (i.e., individuals with a 30 sec differential from the next largest value, suggesting an administration error). Once these outliers were omitted, all scales showed normal distribution (Kline, 2016). We also computed the main and interaction effects of iron status and iron supplementation on the study’s (10 observed) endogenous variables. This was done to rule out the possibility that the effects of iron status are moderated by iron supplementation. There were no statistically significant interactions for any of the endogenous variables (Supplemental Table S2). Because the effects of iron status do not vary by iron supplementation, we model only the main effects associated with iron status.
We note that the measurement model for the memory and mental processing model (Figure 2, top) is shown as involving reflective measurement, suggesting that memory affects performance on the memory tasks and that mental processing ability affects performance on the Identification and Detection tasks. The distinction between reflective and formative measurement centers on the idea that indicators of latent variables affect rather than are affected by the latent variable (Bagozzi, 2007; Howell et al., 2007). This issue has been widely discussed and debated in the psychological methods field (Bollen & Diamatopoulos, 2017). We agree with Bollen and Diamantopoulos (2017) that, while we recognize that memory indeed affects performance on this study’s memory tests and that mental processing abilities indeed affect performance on the Detection and Identification tasks, the performance on such tests are also measures of (indicators of) these cognitive processes and are examined as such in the current study.
Results
Correlations among Study Variables
Adjusted and unadjusted intercorrelations among the study’s observed variables are shown in Table 2, as well as the correlations between the model variables and covariates.
Table 2.
Intercorrelations among the Study’s Observed Variables and Covariates
| Model variables | 1 | 2 | 3 | 4 | 5 | 6 | 7 | 8 | 9 | 10 | 11 |
|---|---|---|---|---|---|---|---|---|---|---|---|
| 1. Iron status severitya 6-18mos | – | −.07* | .10** | .08* | .01 | −.04 | .00 | .01 | .04 | .01 | −.04 |
| 2. Verbal IQ, 10y | −.07* | – | −.11** | −.17*** | .25*** | .25*** | −.14*** | −.21*** | −.20*** | −.17*** | .33*** |
| 3. SCT, 10y | .10** | −.12*** | – | .48*** | −.05 | −.04 | .07 | .04 | .09* | .12** | −.14*** |
| 4. Inattention, 10y | .07* | −.17*** | .47*** | – | −.06 | −.10** | .09** | .05 | .15*** | .18*** | −.24*** |
| 5. ISL, 21y | −.01 | .23*** | −.05 | −.11** | – | .64*** | −.17*** | −.18*** | −.20*** | −.18*** | .20*** |
| 6. ISL-recall, 21y | −.06* | .24*** | −.04 | −.16*** | .67*** | – | −.16*** | −.17*** | −.20*** | −.20*** | .20*** |
| 7. Identification, 21y | −.02 | −.18*** | .06 | .06 | −.09** | −.08* | – | .60*** | .31*** | .26*** | −.15*** |
| 8. Detection, 21y | −.00 | −.23*** | .04 | .04 | −.13*** | −.11** | .63*** | – | .18*** | .12** | −.15*** |
| 9. TMT Part B, 21y | .06 | −.22*** | .10* | .18*** | −.22*** | −.23*** | .27*** | .16*** | – | .86*** | −.25*** |
| 10. TMT Part B – A, 21y | .04 | −.19*** | .12** | .21*** | −.21*** | −.23*** | .21*** | .10** | .87*** | – | −.21*** |
| 11. Educ attain, 21y | −.07* | .34*** | −.15*** | −.27*** | .22*** | .23*** | −.12*** | −.14*** | −.27*** | −.24*** | – |
| Covariates | 1 | 2 | 3 | 4 | 5 | 6 | 7 | 8 | 9 | 10 | 11 |
| Child sex | .11*** | .10** | −.01 | .12** | −.21*** | −.23*** | −.33*** | −.23*** | .09* | .10** | −.10** |
| Iron supplem, 6-12m | −.25*** | −.00 | .03 | .03 | −.02 | −.01 | −.01 | −.01 | −.03 | −.02 | −.00 |
| Maternal IQ | −.06 | .15*** | −.02 | −.05 | .08* | .11** | .07* | −.08* | −.15*** | −.13*** | .15*** |
| Maternal education | −.09** | .09** | −.06 | −.10** | .06 | .13*** | −.03 | −.07* | −.12** | −.07* | .20*** |
| Home environment, 9m | −.04 | .12** | −.04 | −.05 | .07* | .08* | −.01 | −.03 | −.10** | −.10** | .09** |
| Family SES, 1y | .10** | −.13*** | .05 | .04 | .02 | −.02 | .03 | −.01 | .03 | .03 | −.11*** |
Note. The intercorrelations above the diagonal controlled for the covariate variables listed; the coefficients below the diagonal included no controls. Iron status severity was coded as: iron sufficient = 0, iron deficient = 1, iron-deficient anemic = 2. Iron supplem = received no iron supplementation, coded 0, received iron supplementation as part of the preventive trial, coded as 1. SCT = sluggish cognitive tempo. ISL = International Shopping List. TMT = Trail Making Test. Child sex coded as: female = 0, male = 1. Home environment was coded such that high scores reflect a supportive, nurturing home environment. Family SES was coded such that high scores indicate greater socioeconomic disadvantage.
p < .05.
p < .01.
p < .001.
Modeling Results: Iron Deficiency Severity as a Continuous Variable
The three analytic models (Figure 2) had good fit: CFI ≥ .975, RMSEA ≤ .029, SRMR ≤ .025. The direct associations between ID severity and the 10-year mediators (Table 3) indicate that more severe ID was associated with lower verbal IQ (β = −.07, P <.05) and more frequent SCT symptoms (β = .11, P <.01) and inattention symptoms (β = .09, P <.01) at age 10, adjusted for covariates. More severe ID was also related directly to lower educational attainment at age 21, unadjusted for covariates (β = −.07, P < .05); however, this path was nonsignificant when adjusted for covariates.
Table 3.
Direct Effects from Iron Deficiency Severity in Infancy to 10-Year Mediators and 21-Year Outcomes, with Covariates
| βA | P | R2A | βU | R2U | P | |
|---|---|---|---|---|---|---|
| ID severity | .10 | |||||
| Child sex | .10 | .001 | ||||
| Iron supplementation | −.26 | .001 | ||||
| Family SES | .12 | .001 | ||||
| Maternal education | −.08 | .009 | ||||
| Verbal IQ, 10y | .06 | |||||
| ID severity | −.07 | .036 | −.07 | .01 | .041 | |
| Child sex | .10 | .002 | ||||
| Maternal education | .04 | .298 | ||||
| Mother IQ | .11 | .001 | ||||
| Home support | .08 | .024 | ||||
| Family SES | −.11 | .001 | ||||
| Sluggish cognitive tempo, 10y | .02 | |||||
| ID severity | .11 | .003 | .10 | .01 | .006 | |
| Child sex | .10 | .001 | ||||
| Maternal education | −.06 | .111 | ||||
| Inattention, 10y | .03 | |||||
| ID severity | .09 | .009 | .07 | .01 | .040 | |
| Child sex | .11 | .001 | ||||
| Maternal education | −.10 | .006 | ||||
| Memory, 21y | .19 | |||||
| ID severity | −.04 | .534 | −.06 | <.01 | .061 | |
| Verbal IQ, 10y | .29 | .001 | ||||
| SCT, 10y | .03 | .431 | ||||
| Inattention, 10y | −.09 | .044 | ||||
| Child sex | −.28 | .001 | ||||
| Maternal education | .07 | .040 | ||||
| Home support | .07 | .048 | ||||
| Processing speed, 21y | .19 | |||||
| ID severity | −.01 | .671 | −.01 | <.01 | .885 | |
| Verbal IQ, 10y | −.17 | .001 | ||||
| SCT, 10y | .03 | .504 | ||||
| Inattention, 10y | .07 | .097 | ||||
| Child sex | −.37 | .001 | ||||
| Mother IQ | −.06 | .064 | ||||
| TMT Part B, 21y | .09 | |||||
| ID severity | .03 | .366 | .06 | <.01 | .110 | |
| Verbal IQ, 10y | −.20 | .001 | ||||
| SCT, 10y | −.02 | .784 | ||||
| Inattention, 10y | .13 | .050 | ||||
| Child sex | .10 | .006 | ||||
| Mother IQ | −.09 | .005 | ||||
| Maternal education | −.05 | .005 | ||||
| TMT Part B – Part A, 21y | .08 | |||||
| ID severity | .02 | .657 | .04 | <.01 | .287 | |
| Verbal IQ, 10y | −.16 | .001 | ||||
| SCT, 10y | .01 | .928 | ||||
| Inattention, 10y | .15 | .017 | ||||
| Child sex | .11 | .002 | ||||
| Mother IQ | −.10 | .002 | ||||
| Educational attainment, 21y | .20 | |||||
| ID severity | −.01 | .794 | −.07 | .01 | .021 | |
| Verbal IQ, 10y | .30 | .001 | ||||
| SCT, 10y | −.05 | .288 | ||||
| Inattention, 10y | −.21 | .001 | ||||
| Child sex | −.09 | .001 | ||||
| Mother IQ | .04 | .193 | ||||
| Maternal education | .13 | .001 | ||||
| Family SES | −.05 | .104 |
Note. βA = standard coefficient adjusted for covariates listed. R2A = variance accounted for including covariates listed. βU = unadjusted standard coefficient (shown for ID severity only). R2U = variance accounted for by ID severity alone. ID severity: iron sufficient = 0; iron deficient = 1; iron-deficient anemic = 2. Child sex: 1 = male, 0 = female. SCT = sluggish cognitive tempo. SES: socioeconomic status coded such that higher scores indicate greater disadvantage. TMT = Trail Making Test.
When examining the relations between the 10-year mediators and 21-year outcomes (Table 3, Figure 2), lower verbal IQ related to poorer memory, slower processing speed, longer time to complete the TMT Part B and TMT Part B – Part A, and lower educational attainment. SCT symptoms did not relate to any of the 21-year outcomes, but inattention at age 10 related to poorer memory, longer time to complete the TMT Part B and TMT Part B – Part A, and lower educational attainment.
Total variance accounted for by all model variables ranged from 2% for SCT symptoms to 20% for educational attainment (Table 3). When considered alone, ID severity accounted for negligible amounts of variance in all variables.
Indirect Effects
In this study, we hypothesized that iron deficiency severity in infancy leads to poor young adult outcomes by way of lower verbal and attention abilities in childhood. Results show two indirect effects at P < .05 (Table 4). This involved verbal IQ and, separately, inattention mediating the effect of ID severity onto educational attainment. The statistical power associated with these indirect effects was .67 and .86, respectively (Schoemann et al., 2017). Thus, the current sample size is sufficiently powered to detect only the indirect effect from ID severity to inattention to educational attainment. When accounting for the multiple (15) indirect tests conducted (Table 4), neither indirect test remained significant after Bonferroni correction (i.e., P ≤ .0033).
Table 4.
Standardized Estimates and 95% Confidence Intervals (CIs) for Indirect Effects
| β | 95% CI | P | |
|---|---|---|---|
| Memory | |||
| ID severity➝verbal IQ➝memory | −.020 | −.039, −.001 | .050 |
| ID severity➝SCT➝memory | .005 | −.007, .017 | .358 |
| ID severity➝inattent➝memory | −.007 | −.019, .004 | .191 |
| Processing speed | |||
| ID severity➝verbal IQ➝proc speed | .012 | −.001, .024 | .064 |
| ID severity➝SCT➝proc speed | .002 | −.010, .014 | .713 |
| ID severity➝inattent➝proc speed | .005 | −.005, .015 | .298 |
| TMT Part B | |||
| ID severity➝verbal IQ➝TMT Part B | .012 | −.003, .028 | .112 |
| ID severity➝SCT➝TMT Part B | −.002 | −.016, .012 | .781 |
| ID severity➝inattent➝TMT Part B | .013 | −.005, .031 | .117 |
| TMT Part B - A | |||
| ID severity➝verbal IQ➝TMT B – A | .010 | −.003, .022 | .116 |
| ID severity➝SCT➝TMT B – A | .001 | −.013, .015 | .895 |
| ID severity➝inattent➝TMT B - A | .016 | −.003, .035 | .072 |
| Educational attainment | |||
| ID severity➝verbal IQ➝educ attain | −.020 | −.041, −.003 | .044 |
| ID severity➝SCT➝educ attain | .005 | −.005, .016 | .311 |
| ID severity➝inattent➝educ attain | −.018 | −.035, −.002 | .027 |
Note. Iron deficiency severity was coded as a continuous variable: iron sufficient = 0, iron deficient (without anemia) = 1, iron-deficient anemic = 2. SCT = sluggish cognitive tempo. Inattent = inattention. TMT = Trail Making Test. Educ attain = educational attainment. All models adjusted for covariates shown in Table 3.
Iron Status as a Grouping Variable (IS vs. ID vs. IDA)
The models analyzing iron status as a grouping variable had good fit: CFI: ≥ .915, RMSEA ≤ .074, SRMR ≤ .047 (Table S3). The direct effects between iron status as a grouping variable and the 10-year mediators and 21-year outcomes indicated several relations (Table S4; Figure 3). Compared to children who were iron sufficient (IS) in infancy, those who were iron deficient only (ID) had lower verbal IQ and more inattentive symptoms at age 10 (β = −.08, P = .041 and β = .08, P = .040, respectively) and higher TMT Part B – Part A scores at age 21, indicating poorer executive control (β = .08, P = .027). When compared to children who were IS in infancy, those who were iron deficient-anemic (IDA) had more frequent SCT and inattentive symptoms at age 10 (β = .13, P = .002 and β = .11, P = .007, respectively). When compared to children who were ID-only in infancy, those who were IDA had more frequent SCT symptoms at age 10 (β = .09, P = .013).
Figure 3.

Results of model of iron deficiency as a grouping variable predicting 10-year mediators and age 21-year Trail Making Test scores. N = 790. Model fit: Chi-square (23) = 182.08, CFI = .930, RMSEA = .074, SRMR = .042. Standard coefficients are shown. IDA vs. ID = iron-deficiency anemia (coded as 1) contrasted with iron deficiency without anemia (0). ID vs. IS = iron deficiency without anemia (coded as 1) contrasted with iron sufficient (0). IDA vs. IS = iron-deficiency anemia (coded as 1) contrasted with iron sufficient (0). TMT – B = Trail Making Test Part B. TMT B-A = Trail Making Test Part B minus Part A. Non-significant paths are not shown but were included. Model controlled for child sex, iron supplementation, maternal IQ, maternal education, support within the home, and family SES. *P < .05. **P < .01. ***P < .001.
Indirect Effects
Results of the indirect effect tests (Table S5) show two pathways at P < .05: ID (vs. IS) to verbal IQ to TMT Part B (P = .047), and IDA (vs. IS) to inattention to educational attainment (P = .034). The statistical power associated with these indirect effects was .69 and .95, respectively (Schoemann et al, 2017). Thus, the current sample size is sufficiently powered to detect only the latter indirect effect from IDA to inattention to educational attainment. However, neither effect retained statistical significance when accounting for the multiple indirect tests conducted applying Bonferroni correction.
Discussion
Guided by a developmental cascade conceptual framework, we examined the extent to which iron deficiency in infancy compromises children’s cognitive and attentional abilities which, in turn, adversely affect neurocognitive and educational outcomes in young adulthood. We found that more severe iron deficiency was associated with lower verbal intelligence and more frequent inattentive and sluggish cognitive symptoms in childhood, and with lower educational attainment in young adulthood through its effect on inattention. Iron deficiency (without anemia, analyzed as a grouping variable) also related directly to poorer executive control at age 21. However, caution is warranted in drawing firm conclusions from the findings given instances of low statistical power and the multiple indirect tests conducted. Generally, only modest indirect effects were found and several did not retain statistical significance when controlling for number of tests conducted. The long intervals between measurements likely weakened effect sizes which would have limited power to detect mediation (Selig & Preacher, 2009). Insignificant indirect effects can occur in spite of significant individual pathways (as was the case in the current analyses) because of low power associated with tests of mediation (MacKinnon et al., 2012). It is also important to consider that testing and treatment of iron deficiency anemia occurred at 6, 12, and 18 months of age as part of the preventive trial; thus, iron deficiency was likely present for no longer than 6 months. This may explain the stronger and more widespread neurocognitive deficits seen at age 19 in the Costa Rican sample, in which infant iron deficiency was chronic and severe (Lukowski et al., 2010). Additionally, iron status likely fluctuated across infancy in the current study. This is important as the effects of malnutrition on the developing brain vary by the duration and timing of the deficiency relative to the critical periods of brain development (Hensch, 2004).Thus, effects could be weakened by this study’s lack of specificity regarding the exact timing and duration of poor iron status.
Despite these factors, iron deficiency severity, as well as the iron status groups of iron deficiency with and without anemia, were found to be associated with adverse outcomes in both childhood and young adulthood. All effects are consistent with the structural and neuronal abnormalities linked to postnatal iron deficiency. For example, early-life iron deficiency disrupts myelination and dopaminergic functioning (Deoni et al., 2018; Lozoff, 2011), mechanisms involved in attention and cognitive impairments, including poorer verbal functioning (Deoni et al., 2018; Konrad & Eickoff, 2010). Postnatal iron deficiency also alters the prefrontal-striatal and hippocampal systems, which regulate attention (Georgieff, 2011). Brain imaging studies also show that former iron-deficient children have dysfunctional connections between brain regions and truncated hippocampal dendritic branching, each contributing to slow speed of neural transmission, low alertness, and slow responsivity (Algarin et al., 2017; Jorgenson et al., 2003), the latter classic symptoms of sluggish cognitive tempo. In the current study, iron deficiency (without anemia, analyzed as a grouping variable) was associated with poor performance on the Trail Making Test Part B – Part A. The Trails difference score reflects executive control, or task demands of the frontal lobe, with poor Trails difference scores indicating frontal lobe injury or dysfunction (Demakis, 2004). Others also have found mental flexibility difficulties among former iron-deficient children and believe such difficulties originate from stunted frontal lobe development (Barks et al., 2019; Georgieff et al., 2011, 2018; Lukowski et al., 2010). Altogether, the adverse outcomes found here link to several neurologic developmental processes known to be affected by postnatal iron deficiency.
In terms of a developmental cascade effect, we found only one such effect, with iron deficiency severity related to lower educational attainment through its influence on childhood inattention. Iron-deficiency anemia (analyzed as an iron status grouping variable) also related to lower educational attainment through its effect on inattention at age 10. Although verbal IQ was strongly related to educational attainment, it was only modestly related to iron deficiency. Thus, an indirect effect involving verbal IQ was not supported. The current finding identifying inattention as a central mediator between infant and young adult outcomes underscores the importance of attention problems that can result from iron deficiency and potentially stunt one’s educational attainment. It is likely that the attention difficulties brought about by earlier iron deficiency (can’t concentrate, can’t sit still, hyperactive) set into motion academic difficulties and failures, in addition to disciplinary problems and grade repetitions that hinder post-secondary schooling and entry into college (Pingault et al., 2011; Rabiner et al., 2016). Efforts that target and ameliorate attention problems derived from infant iron deficiency would likely have far-reaching beneficial effects as educational attainment is paramount to one’s life options and life outcomes (Beckles & Truman, 2013).
Limitations and Strengths
Several study limitations should be considered. First, iron deficiency is known to be disproportionately present within low- income contexts (Kassebaum, 2016). Although we statistically controlled for socioeconomic, family and child characteristics in attempts to adjust for these factors, unmeasured features in the environment of former iron-deficient children could account for their poorer outcomes. The relatively high iron deficiency rates within the current sample likely reflect the lack of availability of iron-fortified infant formula in Chile at the time of the study, which was country-wide and unrelated to socioeconomic status. Moreover, iron deficiency likely resulted from being randomized to the no-added iron condition as part of the preventive trial. Nevertheless, the socioeconomic status of the current sample, as well as other contextual factors, should be considered in gauging the generalizability of findings.
Additionally, while this study focused on cognitive and attention deficits stemming from iron deficiency, other possible mechanisms could be operating. For example, Lozoff and colleagues (2000) found that children who were iron deficient in infancy had poorer motor functioning, spatial memory, and arithmetic skills. Additionally, it is plausible that iron deficiency impacts the neural circuits underlying memory, processing speed and mental flexibility, which in turn, lead to lower educational attainment. These alternate pathways might also fit the data. Moreover, this study’s covariates (child sex, maternal IQ, maternal education, support within the home, family SES), as well as other circumstances such as family stress and household disruption, could theoretically serve as moderating the relation between infant iron deficiency and young adult outcomes. Certainly, a whole host of child and family characteristics not studied here could possibly compound impairments associated with infant iron deficiency to affect adult outcomes.
Study strengths are the longitudinal follow-up of a relatively large cohort, use of well-validated measures, and inclusion of important controls in the analyses. The current study was conducted in Chile when there was no national program for iron fortification, resulting in a sample with relatively high rates of iron deficiency with and without anemia. This allowed for a robust test of effects associated with each condition. All study participants were healthy as newborns and infants, thus there were no obvious early health problems confounding later outcomes. In addition, all participants had good iron status levels in childhood and adolescence, allowing us to discount chronic iron deficiency and anemia as possibly contributing to young adult outcomes.
Conclusions
Altogether, findings indicate that iron deficiency in infancy is associated with poorer cognitive, neurocognitive and attention skills, and indirectly with lower educational attainment. The persistence of adverse outcomes into childhood and young adulthood highlights the need for vigilant prevention (Doom & Georgieff, 2014). Behavioral and cognitive screening of children with a history of iron deficiency seems warranted, and interventions directed toward improving skill deficits linked to early-life iron deficiency might prove beneficial and could alter the course to adult functioning. Further research on the impact of such interventions would be helpful.
Supplementary Material
Acknowledgments
This research was supported by grants from the Eunice Kennedy Shriver National Institute of Child Health & Human Development (R03-HD-097295, R01-HD-033487), and the National Heart, Lung, and Blood Institute (R01-HL-088530; K01-HL-143159).
Footnotes
We have no known conflicts of interest to disclose.
References
- Achenbach TM, & Ruffle TM (2000). The Child Behavior Checklist and related forms for assessing behavioral/emotional problems and competencies. Pediatrics in Review, 21, 265–271. 10.1542/pir.21-8-265 [DOI] [PubMed] [Google Scholar]
- Akman M, Cebeci D, Okur V, Angin H, Abali O, & Akman AC (2004). The effects of iron deficiency on infants’ developmental test performance. Acta Paediatrics, 93, 1391–96. 10.1080/08035250410030946 [DOI] [PubMed] [Google Scholar]
- Algarin C, Karunakaran KD, Reyes S, Morales C, Lozoff B, Peirano P, & Biswal B (2017). Differences on brain connectivity in adulthood are present in subjects with iron deficiency anemia in infancy. Frontiers in Aging Neuroscience, 9, 54. 10.3389/fnagi.2017.00054 [DOI] [PMC free article] [PubMed] [Google Scholar]
- Algarin C, Nelson CA, Peirano P, Westerlund A, Reyes S, & Lozoff B (2013). Iron-deficiency anemia in infancy and poorer cognitive inhibitory control at age 10 years. Developmental Medicine and Child Neurology, 55, 453–458. [DOI] [PMC free article] [PubMed] [Google Scholar]
- Algarin C, Peirano P, Garrido M, Pizarro F, Lozoff B (2003). Iron-deficiency anemia in infancy: Long-lasting effects on auditory and visual systems functioning. Pediatric Research, 53, 217–223. 10.1203/01.PDR.0000047657.23156.55 [DOI] [PubMed] [Google Scholar]
- Alloway TP, & Alloway RG (2010). Investigating the predictive roles of working memory and IQ in academic attainment. Journal of Experimental Child Psychology, 106(1), 20–29. 10.1016/j.jecp.2009.11.003 [DOI] [PubMed] [Google Scholar]
- Arija V, Esparó G, Fernández-Ballart J, Murphy MM, Biarnés E, & Canals J (2006). Nutritional status and performance in test of verbal and non-verbal intelligence in 6 year old children. Intelligence, 34(2), 141–149. 10.1016/j.intell.2005.09.001 [DOI] [Google Scholar]
- Bagozzi RP (2007). On the meaning of formative measurement and how it differs from reflective measurement: Comment on Howell, Breivik, and Wilcox (2007). Psychological Methods, 12(2), 229–237. 10.1037/1082-989X.12.2.229 [DOI] [PubMed] [Google Scholar]
- Baker RD, & Greer FR (2010). Diagnosis and prevention of iron deficiency and iron-deficiency anemia in infants and young children (0–3 years of age). Pediatrics, 126(5), 1040–1050. 10.1542/peds.2010-2576 [DOI] [PubMed] [Google Scholar]
- Barkley RA (2012). Distinguishing sluggish cognitive tempo from attention-deficit/-hyperactivity disorder in adults. Journal of Abnormal Psychology, 121(4), 978–990. 10.1037/a0023961 [DOI] [PubMed] [Google Scholar]
- Barkley RA (2013). Distinguishing sluggish cognitive tempo from ADHD in children and adolescents: Executive functioning, impairment, and comorbidity. Journal of Clinical Child & Adolescent Psychology, 42(2), 161–173. 10.1080/-15374416.2012.734259 [DOI] [PubMed] [Google Scholar]
- Barks A, Hall AM, Tran PV, & Georgieff MK (2019). Iron as a model nutrient for understanding the nutritional origins of neuropsychiatric disease. Pediatric Research, 85(2), 176–182. 10.1038/s41390-018-0204-8 [DOI] [PMC free article] [PubMed] [Google Scholar]
- Bastian TW, von Hohenberg WC, Mickelson DJ, Lanier LM, & Georgieff MK (2016). Iron deficiency impairs developing hippocampal neuron gene expression, energy metabolism, and dendrite complexity. Developmental Neuroscience, 38(4), 264–276. 10.1159/000448514 [DOI] [PMC free article] [PubMed] [Google Scholar]
- Becker SP, & Barkley RA (2018). Sluggish cognitive tempo. In Banaschewski T, Coghill D, & Zuddas A (Eds.), Oxford textbook of attention deficit hyperactivity disorder (p. 147–153). Oxford University Press. [Google Scholar]
- Becker SP, Leopold DR, Burns GL, Jarrett MA, Langberg JM, Marshall SA, McBurnett K, Waschbusch DA, & Willcutt EG (2016). The internal, external, and diagnostic validity of sluggish cognitive tempo: A meta-analysis and critical review. Journal of the American Academy of Child & Adolescent Psychiatry, 55(3), 163–178. 10.1016/j.jaac.2015.12.006 [DOI] [PMC free article] [PubMed] [Google Scholar]
- Beckles GL, & Truman BI (2013). Education and income-United States, 2009 and 2011. Morbidity and Mortality Surveillance Summary, 62(suppl 3), 9–19. [PubMed] [Google Scholar]
- Bollen KA, & Diamantopoulos A (2017). In defense of causal-formative indicators: A minority report. Psychological Methods, 22(3), 581. 10.1037/met0000056. [DOI] [PMC free article] [PubMed] [Google Scholar]
- Caldwell BM, & Bradley RH (1984). Home observation for measurement of the environment. Little Rock: University of Arkansas. [Google Scholar]
- Chang S, Wang L, Wang Y, Brouwer ID, Kok F, Lozoff B, & Chen C (2011). Iron-deficiency anemia in infancy and social emotional development in preschool-aged Chinese children. Pediatrics, 127, e927–33. 10.1542/peds.2010-1659 [DOI] [PubMed] [Google Scholar]
- Congdon EL, Westerlund A, Algarin CR, Peirano PD, Gregas M, Lozoff B, & Nelson CA (2012). Iron deficiency in infancy is associated with altered neural correlates of recognition memory at 10 years. Journal of Pediatrics, 160, 1027–1033. 10.1016/j.jpeds.2011.12.011 [DOI] [PMC free article] [PubMed] [Google Scholar]
- Demakis GJ (2004). Frontal lobe damage and tests of executive processing: A meta-analysis of the Category Test, Stroop Test, and Trail-Making Test. Journal of Clinical and Experimental Neuropsychology, 26(3), 441–450. 10.1080/-13803390490510149$16.00 [DOI] [PubMed] [Google Scholar]
- Deoni S, Dean III D, Joelson S, O'Regan J, & Schneider N (2018). Early nutrition influences developmental myelination and cognition in infants and young children. Neuroimage, 178, 649–659. 10.1016/j.neuroimage.2017.12.056 [DOI] [PMC free article] [PubMed] [Google Scholar]
- Doom JR, & Georgieff MK (2014). Striking while the iron is hot: Understanding the biological and neurodevelopmental effects of iron deficiency to optimize intervention in early childhood. Current Pediatrics Reports, 2(4), 291–298. 10.1007/s40124-014-0058-4 [DOI] [PMC free article] [PubMed] [Google Scholar]
- Doom JR, Georgieff MK, & Gunnar MR (2015). Institutional care and iron deficiency increase ADHD symptomology and lower IQ 2.5-5 years post-adoption. Developmental Science, 18(3), 484–494. 10.1111/desc.12223 [DOI] [PMC free article] [PubMed] [Google Scholar]
- Doom JR, Gahagan S, Caballero G, Encina P, & Lozoff B (2019). Infant iron deficiency, iron supplementation, and psychosocial stress as predictors of neurocognitive development in Chilean adolescents. Nutritional Neuroscience, 1–10. 10.1080/1028415X.2019.1651105 [DOI] [PMC free article] [PubMed] [Google Scholar]
- Doom JR, Gahagan S, East PL, Encina P, Delva J, & Lozoff B (2020). Adolescent internalizing, externalizing, and social problems following iron deficiency at 12–18 months: The role of maternal responsiveness. Child Development, 91(3), e545–e562. 10.1111/cdev.13266 [DOI] [PMC free article] [PubMed] [Google Scholar]
- Doom JR, Gunnar MR, Georgieff MK, Kroupina MC, Frenn K, Fuglestad AJ, Carlson SM (2014). Beyond stimulation deprivation: Iron deficiency and cognitive deficits in post institutionalized children. Child Development, 85, 1805–1812. 10.1111/cdev.12231 [DOI] [PMC free article] [PubMed] [Google Scholar]
- East P, Delker E, Blanco E, Encina P, Lozoff B, & Gahagan S (2019). Effect of infant iron deficiency on children’s verbal abilities: The roles of child affect and parent unresponsiveness. Maternal and Child Health Journal, 23(9), 1240–1250. 10.1007/s10995-019-02764-x [DOI] [PMC free article] [PubMed] [Google Scholar]
- East P, Delker E, Lozoff B, Delva J, Castillo M, & Gahagan S (2018). Associations among infant iron deficiency, childhood emotion and attention regulation, and adolescent problem behaviors. Child Development, 89(2), 593–608. 10.1111/cdev.12765 [DOI] [PMC free article] [PubMed] [Google Scholar]
- East P, Lozoff B, Blanco E, Delker E, Delva J, Encina P, & Gahagan S (2017). Infant iron deficiency, child affect, and maternal unresponsiveness: Testing the long-term effects of functional isolation. Developmental Psychology, 53, 2233–2244. 10.1037/dev0000385 [DOI] [PMC free article] [PubMed] [Google Scholar]
- Fretham SJ, Carlson ES, & Georgieff MK (2011). The role of iron in learning and memory. Advances in Nutrition, 2(2), 112–121. 10.3945/an.110.000190 [DOI] [PMC free article] [PubMed] [Google Scholar]
- Fry AF, & Hale S (2000). Relationships among processing speed, working memory, and fluid intelligence in children. Biological Psychology, 54(1-3), 1–34. 10.1016/S0301-0511(00)00051-X [DOI] [PubMed] [Google Scholar]
- Fuglestad AJ, Georgieff MK, Iverson SL, Miller BS, Petryk A, Johnson DE, & Kroupina MG (2013). Iron deficiency after arrival is associated with general cognitive and behavioral impairment in post-institutionalized children adopted from Eastern Europe. Maternal and Child Health Journal, 17, 1080–1087. 10.1007/s10995-012-1090-z [DOI] [PubMed] [Google Scholar]
- Gaudino EA, Geisler MW, & Squires NK (1995). Construct validity in the Trail Making Test: What makes Part B harder? Journal of Clinical and Experimental Neuropsychology, 17(4), 529–535. 10.1080/01688639508405143 [DOI] [PubMed] [Google Scholar]
- Georgieff MK (2011). Long-term brain and behavioral consequences of early iron deficiency. Nutritional Reviews, 69, S43–48. 10.1111/j.1753-4887.2011.00432.x [DOI] [PMC free article] [PubMed] [Google Scholar]
- Georgieff MK (2017). Iron assessment to protect the developing brain. American Journal of Clinical Nutrition, 106 (suppl 6), 1588S–1593S. 10.3945/-ajcn.117.155846 [DOI] [PMC free article] [PubMed] [Google Scholar]
- Georgieff MK, Ramel SE, & Cusick SE (2018). Nutritional influences on brain development. Acta Paediatrica, 107, 1310–1321. 10.1111/apa.14287 [DOI] [PMC free article] [PubMed] [Google Scholar]
- Graffar M (1956). A method for social classification of population samples. Courier, 6, 455–459. [Google Scholar]
- Gupta PM, Hamner HC, Suchdev PS, Flores-Ayala R, & Mei Z (2017). Iron status of toddlers, nonpregnant females, and pregnant females in the United States. American Journal of Clinical Nutrition, 106 (suppl 6), 1640S–1646S. 10.3945/-ajcn.117.155978 [DOI] [PMC free article] [PubMed] [Google Scholar]
- Hensch TK (2004). Critical period regulation. Annual Review of Neuroscience, 27, 549–79. 10.1146/annurev.neuro.27.070203.144327 [DOI] [PubMed] [Google Scholar]
- Howell RD, Breivik E, & Wilcox JB (2007). Reconsidering formative measurement. Psychological Methods, 12(2), 205–218. 10.1037/1082.989X.12.2.219 [DOI] [PubMed] [Google Scholar]
- Jorgenson LA, Wobken JD, & Georgieff MK (2003). Perinatal iron deficiency alters apical dendritic growth in hippocampal CA1 pyramidal neurons. Developmental Neuroscience, 25(6), 412–420. 10.1159/000075667 [DOI] [PubMed] [Google Scholar]
- Kassebaum NJ (2016). The global burden of anemia. Hematology/Oncology Clinics, 30(2), 247–308. 10.1016/j.hoc.2015.11.002 [DOI] [PubMed] [Google Scholar]
- Kline RB (2016). Principles and practice of structural equation modeling (4th ed.). Guilford Press. [Google Scholar]
- Konrad K, & Eickhoff SB (2010). Is the ADHD brain wired differently? A review on structural and functional connectivity in attention deficit hyperactivity disorder. Human Brain Mapping, 31(6), 904–916. 10.1002/hbm.21058 [DOI] [PMC free article] [PubMed] [Google Scholar]
- Larson LM, Martorell R, & Bauer PJ (2018). A path analysis of nutrition, stimulation, and child development among young children in Bihar, India. Child Development, 89(5), 1871–1886. 10.1111/cdev.13057 [DOI] [PMC free article] [PubMed] [Google Scholar]
- Little TD (2013). Longitudinal structural equation modeling. Guilford Press. [Google Scholar]
- Lopez A, Cacoub P, Macdougall IC, & Peyrin-Biroulet L (2016). Iron deficiency anaemia. The Lancet, 387(10021), 907–916. 10.1016/S0140-6736(15)60865-0 [DOI] [PubMed] [Google Scholar]
- Lozoff B (2011). Early iron deficiency has brain and behavior effects consistent with dopaminergic dysfunction. Journal of Nutrition, 141(4), 740S–746S. 10.3945/jn.110.131169 [DOI] [PMC free article] [PubMed] [Google Scholar]
- Lozoff B, Castillo M, Clark KM, & Smith JB (2012). Iron-fortified vs low-iron infant formula: Developmental outcome at 10 years. Archives of Pediatrics and Adolescent Medicine, 166(3), 208–215. 10.1001/archpediatrics.2011.197 [DOI] [PMC free article] [PubMed] [Google Scholar]
- Lozoff B, Castillo M, Clark KM, Smith JB, & Sturza J (2014). Iron supplementation in infancy contributes to more adaptive behavior at 10 years of age. Journal of Nutrition, 144, 838–45. 10.3945/jn.113.182048. [DOI] [PMC free article] [PubMed] [Google Scholar]
- Lozoff B, Clark KM, Jing Y, Armony-Sivan R, Angelilli ML, & Jacobson SW (2008). Dose-response relationships between iron deficiency with or without anemia and infant social-emotional behavior. Journal of Pediatrics, 152 (5), 696–702. 10.1016/j.jpeds.2007.09.048 [DOI] [PMC free article] [PubMed] [Google Scholar]
- Lozoff B, Corapci F, Burden MJ, Kaciroti N, Angulo-Barroso R, Sazawal S, & Black M (2007). Preschool-aged children with iron deficiency anemia show altered affect and behavior. Journal of Nutrition, 137(3), 683–689. 10.1093/jn/137.3.683 [DOI] [PMC free article] [PubMed] [Google Scholar]
- Lozoff B, De Andraca I, Castillo M, Smith J, Walter T, & Pino P (2003). Behavioral and developmental effects of preventing iron-deficiency anemia in healthy full-term infants. Pediatrics,112, 846–854. http:///pediatrics.aappublications.org/content/112/4/846.full.html [PubMed] [Google Scholar]
- Lozoff B, Jimenez E, Hagen J, Mollen E, & Wolf AW (2000). Poorer behavioral and developmental outcome more than 10 years after treatment for iron deficiency in infancy. Pediatrics, 105(4), e51–e51. 10.1542/peds.105.4.e51 [DOI] [PubMed] [Google Scholar]
- Lozoff B, Kaciroti N, & Walter T (2006). Iron deficiency in infancy: Applying a physiologic framework for prediction. American Journal of Clinical Nutrition, 84, 1412–1421. 10.1093/ajcn/84.6.1412 [DOI] [PMC free article] [PubMed] [Google Scholar]
- Lozoff B, Smith JB, Kaciroti N, Clark KM, Guevara S, & Jimenez E (2013). Functional significance of early-life iron deficiency: Outcomes at 25 years. Journal of Pediatrics, 163(5), 1260–1266. 10.1016/j.jpeds.2013.05.015 [DOI] [PMC free article] [PubMed] [Google Scholar]
- Lukowski AF, Koss M, Burden MJ, Jonides J, Nelson CA, Kaciroti N, Jimenez E, & Lozoff B (2010). Iron deficiency in infancy and neurocognitive functioning at 19 years: Evidence of long-term deficits in executive function and recognition memory. Nutritional Neuroscience, 13, 54–70. 10.1179/147683010X12611460763689 [DOI] [PMC free article] [PubMed] [Google Scholar]
- MacKinnon DP, Cheong J, & Pirlott AG (2012). Statistical mediation analysis. In Cooper H, Camic PM, Long DL, Panter AT, Rindskopf D, & Sher KJ (Eds.), APA handbooks in psychology®. APA handbook of research methods in psychology, Vol. 2. Research designs: Quantitative, qualitative, neuropsychological, and biological (p. 313–331). American Psychological Association. 10.1037/13620-018 [DOI] [Google Scholar]
- Maruff P, Thomas E, Cysique L, Brew B, Collie A, Snyder P, & Pietrzak RH (2009). Validity of the CogState brief battery: Relationship to standardized tests and sensitivity to cognitive impairment in mild traumatic brain injury, schizophrenia, and AIDS dementia complex. Archives of Clinical Neuropsychology, 24(2), 165–178. 10.1093/arclin/acp010 [DOI] [PubMed] [Google Scholar]
- Masten AS, & Cicchetti D (2010). Developmental cascades. Development and Psychopathology, 22(3), 491–495. 10.1017/S0954579410000222 [DOI] [PubMed] [Google Scholar]
- McCann JC, & Ames BN (2007). An overview of evidence for a causal relation between iron deficiency during development and deficits in cognitive or behavioral function. American Journal of Clinical Nutrition, 85, 931–45. 10.1093/ajcn/85.4.931 [DOI] [PubMed] [Google Scholar]
- Muthén BO (2011). Applications of causally defined direct and indirect effects in mediation analysis using SEM in Mplus. Los Angeles, CA: Author. [Google Scholar]
- Muthén LK, & Muthén BO (1998-2017). Mplus user’s guide (8th ed.). Authors. [Google Scholar]
- Nakamura BJ, Ebesutani C, Bernstein A, & Chorpita BF (2009). A psychometric analysis of the child behavior checklist DSM-oriented scales. Journal of Psychopathology and Behavioral Assessment, 31, 178–189. 10.1007/s10862-008-9119-8 [DOI] [PMC free article] [PubMed] [Google Scholar]
- Newman DA (2003). Longitudinal modeling with randomly and systematically missing data: A simulation of ad hoc, maximum likelihood, and multiple imputation techniques. Organizational Research Methods,6(3),328–362. 10.1177/-1094428103254673 [DOI] [Google Scholar]
- Pingault JB, Tremblay RE, Vitaro F, Carbonneau R, Genolini C, Falissard B, & Côté SM (2011). Childhood trajectories of inattention and hyperactivity and prediction of educational attainment in early adulthood: A 16-year longitudinal population-based study. American Journal of Psychiatry, 168(11), 1164–1170. 10.1176/appi.ajp.2011.10121732 [DOI] [PubMed] [Google Scholar]
- Rabiner DL, Godwin J, & Dodge KA (2016). Predicting academic achievement and attainment: The contribution of early academic skills, attention difficulties, and social competence. School Psychology Review, 45(2), 250–267. 10.17105/SPR45-2.250-267 [DOI] [Google Scholar]
- Radlowski EC, & Johnson RW (2013). Perinatal iron deficiency and neurocognitive development. Frontiers in Human Neuroscience, 7, Article 585. 1–11. 10.3389/fnhum.2013.00585 [DOI] [PMC free article] [PubMed] [Google Scholar]
- Raghunathan TE, Solenberger P, & Van Hoewyk J (2000). IVEware: Imputation and variance estimation software installation instructions and user guide. Ann Arbor, MI. Survey Research Center, Institute for Social Research, University of Michigan. [Google Scholar]
- Rubin DB (1996). Multiple imputation after 18+ years. Journal of the American Statistical Association, 91(434), 473–489. 10.1080/01621459.1996.10476908 [DOI] [Google Scholar]
- Sánchez-Cubillo I, Perianez JA, Adrover-Roig D, Rodriguez-Sanchez JM, Rios-Lago M, Tirapu JEEA, & Barcelo F (2009). Construct validity of the Trail Making Test: Role of task-switching, working memory, inhibition/interference control, and visuomotor abilities. Journal of the International Neuropsychological Society, 15(3), 438–450. 10.1017/S1355617709090626 [DOI] [PubMed] [Google Scholar]
- Schoemann AM, Boulton AJ, & Short SD (2017). Determining power and sample size for simple and complex mediation models. Social Psychological and Personality Science, 8(4), 379–386. 10.1177/1948550617715068 [DOI] [Google Scholar]
- Selig JP, & Preacher KJ (2009). Mediation models for longitudinal data in developmental research. Research in Human Development, 6(2-3), 144–164. [Google Scholar]
- Skuse DH, Mandy W, Steer C, Miller LL, Goodman R, Lawrence K, Edmond A, & Golding J (2009). Social communication competence and functional adaptation in a general population of children: Preliminary evidence for sex-by-verbal IQ differential risk. Journal of the American Academy of Child & Adolescent Psychiatry, 48(2), 128–137. 10.1097/CHI.0b013e31819176b8 [DOI] [PubMed] [Google Scholar]
- Strenze T (2007). Intelligence and socioeconomic success: A meta-analytic review of longitudinal research. Intelligence, 35(5), 401–426. 10.1016/j.intell.2006.09.004 [DOI] [Google Scholar]
- Tamura T, Goldenberg RL, Hou J, Johnston KE, Cliver SP, Ramey SL, & Nelson KG (2002). Cord serum ferritin concentrations and mental and psychomotor development of children at five years of age. Journal of Pediatrics, 140(2), 165–170. 10.1067/mpd.2002.120688 [DOI] [PubMed] [Google Scholar]
- Thompson TA, Wilson PH, Snyder PJ, Pietrzak RH, Darby D, Maruff P, & Buschke H (2011). Sensitivity and test–retest reliability of the International Shopping List test in assessing verbal learning and memory in mild Alzheimer's disease. Archives of Clinical Neuropsychology, 26(5), 412–424. [DOI] [PubMed] [Google Scholar]
- Wåhlstedt C, & Bohlin G (2010). DSM-IV-defined inattention and sluggish cognitive tempo: Independent and interactive relations to neuropsychological factors and comorbidity. Child Neuropsychology, 16(4), 350–365. 10.1080/09297041003671176 [DOI] [PubMed] [Google Scholar]
- Wechsler D (1955). Wechsler Adult Intelligence Scale (WAIS). Journal of Consulting Psychology, 19, 319–20. [Google Scholar]
- Wechsler D (1974). The Wechsler intelligence scale for children-Revised. Psychological Corporation. [Google Scholar]
Associated Data
This section collects any data citations, data availability statements, or supplementary materials included in this article.