

Abstract
Objective:
The use of duplex ultrasound (DUS) examinations for surveillance after fenestrated endovascular aneurysm repair (FEVAR) is not well-studied. Our objective was to further characterize normal and abnormal duplex findings in renal branch grafts after FEVAR.
Methods:
We retrospectively reviewed a single-center experience involving consecutive patients treated with Cook ZFEN devices between 2012 and 2017. Postoperative imaging consisted of a computed tomography (CT) scan at 1 month, 6 months, 1 year, and annually thereafter. As experienced progressed, DUS examination with or without concurrent CT scans were obtained in a nonstandardized protocol, particularly for patients with decreased renal function. Renal patency loss was defined as occlusion or stenosis of greater than 50% evaluated on 3-day renal artery center-line imaging.
Results:
A total of 116 patients were treated with FEVAR, of which 60 (51.7%) had concurrent CT and renal DUS images available for review. Six patients (10%) had limited ultrasound studies owing to bowel gas and were excluded. The study cohort therefore included 54 patients receiving of 94 renal fenestrated stents with a mean follow-up of 23 months. Twelve cases of renal patency loss in 10 patients (9 stenoses, 3 occlusions) were found on CT scanning, 11 (91.6%) of which had concurrent abnormalities found on ultrasound examination. Stents with compression at the junction of the main body exhibited significantly elevated mean Peak systolic velocities (PSV) compared with nonstenosed stents (349.2 cm/s vs 115.3 cm/s; P = .003). Stenosis in the most proximal portion of the stent (ie, within the main body) showed no difference in proximal PSV (86.0 cm/s vs 131.9 cm/s; P = .257); however, dampened PSV showed significant differences in the mid (17.5 cm/s vs 109.9 cm/s; P = .027) and distal (19.0 cm/s vs 78.3 cm/s; P = .028) segments compared with nonstenosed stents. All occluded stents demonstrated no flow detection. Proximal PSV served as a strong classifier for junctional stenosis (area under the curve, 0.98). A combined criterion of proximal PSV of greater than 215 cm/s or distal PSV of less than 25 cm/s resulted in a sensitivity of 91.6% and specificity of 85.3% for detecting patency loss. All stents that were compromised underwent successful secondary reintervention and restoration of patency.
Conclusions:
DUS imaging is a clinically useful modality for surveillance of renal branch grafts after FEVAR. Patterns of segmental velocity elevation (proximal PSV, >215 cm/s) and dampening in the distal renal indicate potential hemodynamic compromise and should prompt more aggressive workup or imaging and likely be considered for secondary intervention.
Keywords: Fenestrated, EVAR, Duplex, Renal stent
The treatment of juxtarenal and short neck aortic aneurysms has undergone a paradigm shift over the last decade. Fenestrated endovascular aneurysm repair (FEVAR), after gaining U.S. Food and Drug Administration approval in 2012, has become increasingly used as an on-label indicated procedure with durable outcomes, particularly for patients deemed unfavorable candidates for open aneurysm repair. Although duplex ultrasound (DUS) has supplanted computed tomographic angiography (CTA) scans as the favored modality for long-term surveillance after conventional infrarenal EVAR, the complex configuration of renal branch stents and aortic grafts after FEVAR often favors frequent CTA surveillance imaging.
DUS criteria for detecting de novo renal artery stenosis are well validated. Peak systolic velocities (PSV) of 200 cm/s or greater or a renal-aortic velocity ratio (RAR) of 3.5 or greater are both sensitive and specific for 60% or greater stenosis or greater.1,2 However, there is a lack of consensus regarding DUS criteria for in-stent restenosis, and this ambiguity is further complicated by differing strategies of renal stenting. A growing body of literature suggests that changes in wall compliance by the stents results in higher PSV (250-280 cm/s) even in widely patent renal grafts.3,4 Similar findings have been reported for native vs stented carotid arteries.5–7 Despite this discrepancy, DUS examination remains the primary modality for follow-up imaging after renal and carotid stenting.
By contrast, the use of DUS for the surveillance of renal stents after FEVAR is poorly studied and is further complicated by the fact these are often stent grafts. The complex interface between the fenestrated aortic graft and the protruding renal stent has the potential to cause local turbulent flow, and thus influence measured renal and aortic velocities. Renal stents are further subjected to multiple areas of local deformation (eg, within the main aortic graft, at the junction of the aortic graft, and at the distal native renal arterial interface), introducing multiple locations of possible stent collapse. As such, previously established criteria for de novo atherosclerotic renal stenosis may not be applicable in such a setting. Limited studies involving physician-modified fenestrated endografts and fenestrated endografts under an investigational device exemption have proposed higher PSV thresholds (eg, >280 cm/s) to indicate need for secondary renal intervention.8,9 To date, no studies have described patterns of velocity changes associated with the type and location of renal stent stenosis with the presence of an aortic fenestration with the commercially available ZFEN device. The purpose of this study was thus to characterize normal and abnormal duplex findings in renal branch grafts after FEVAR.
METHODS
This study involved a retrospective review of a database containing consecutive patients undergoing elective FEVAR between October 2012 and August 2017. Only patients with at least one renal fenestration in their repair, as well as having reached at least 6 months of follow-up, were included. For the purposes of this study, only patients with concurrent CT and DUS imaging (defined as an ultrasound examination within 1 month of a CT scan) at any time point were selected for analysis. No patients with ruptured abdominal aortic aneurysms or preoperative dialysis-dependent renal failure were treated in this cohort. Patient demographics, comorbidities, intraoperative parameters, anatomic and device characteristics, and relevant clinical and imaging outcomes variables were recorded. This study was approved by our local institutional review board. Owing to the retrospective nature of the study, informed consent was not obtained.
Surgical technique.
The specific procedural steps involved in FEVAR have been previously described in detail.10,11 Briefly, we implanted the ZFEN endograft system (Cook Inc, Bloomington, Ind) composed of a custom-fenestrated proximal component and a standard bifurcated distal component. Per surgeon preference, all renal fenestrations were created as 6- × 6-mm dimensions. The proximal fenestrated graft is positioned and aligned according to radiopaque markers and angiographic landmarks, and then partially deployed. Selective guiding wires and catheters are used to cannulate the renal and visceral arteries through the fenestrations from within the graft. The remaining proximal fixation system was then released completely. Renal arteries (and additional required visceral arteries) were then stented using balloon-expandable covered stents (iCAST, Atrium USA, Hudson, NH) sized relative to the native ostial diameter. The proximal portion of the renal stents were extended about 3-5 mm into the aorta and subsequently flared using a 9- or 10-mm angioplasty balloon. The remainder of the deployment technique remains similar to the conventional Zenith bifurcated abdominal aortic aneurysm endovascular graft system. Postoperatively, all patients were continued on dual antiplatelet therapy with aspirin and clopidogrel.
Imaging protocol.
Our typical imaging protocol requires patients to be scheduled to undergo CTA follow-up imaging within 1 month, at 6 months, at 1 year, then annually thereafter. As the study period progressed, we incorporated more frequent use of renal DUS examination in combination with noncontrast and/or contrast CT imaging to establish a means of assessing renovisceral flow patterns and the presence of endoleak. This surveillance was done as experience progressed with the device as well as with treating patients with baseline renal dysfunction who were preferentially selected to undergo more frequent DUS examinations compared with CTA imaging. The use of DUS imaging during follow-up was thus obtained in a nonprotocolized manner. All DUS scans were performed in our accredited vascular imaging laboratory. Imaging systems consisted of Phillips IU-22 or Epic 7 (Philips North America Corporation, Andover, Mass) with an abdominal probe. Both transabdominal and flank windows are found on every patient to confirm velocity findings and improve accuracy. Measured doppler angles per protocol were at 60° or less.
Renal stents were evaluated at the proximal, mid, and distal portions of the renal artery (Fig 1). PSV, end-diastolic velocities (EDV), and RAR were calculated. Postoperatively, renal stents were evaluated using center-line imaging (TeraRecon, Foster City, Calif) centered on the native renal artery and entire renal stent. Renal artery stenosis or kinking was defined as presence of a greater than 50% decrease in the flow lumen diameter anywhere along its path compared with reference diameter (maximal diameter within the native artery, excluding the flared component). Renal occlusion was defined as the absence of flow detection on DUS examination or CTA scans. Both renal stent kinking/stenosis and occlusion were considered loss of renal patency. Patient’s with positive DUS and/or CT findings were scheduled to undergo reintervention.
Fig 1.
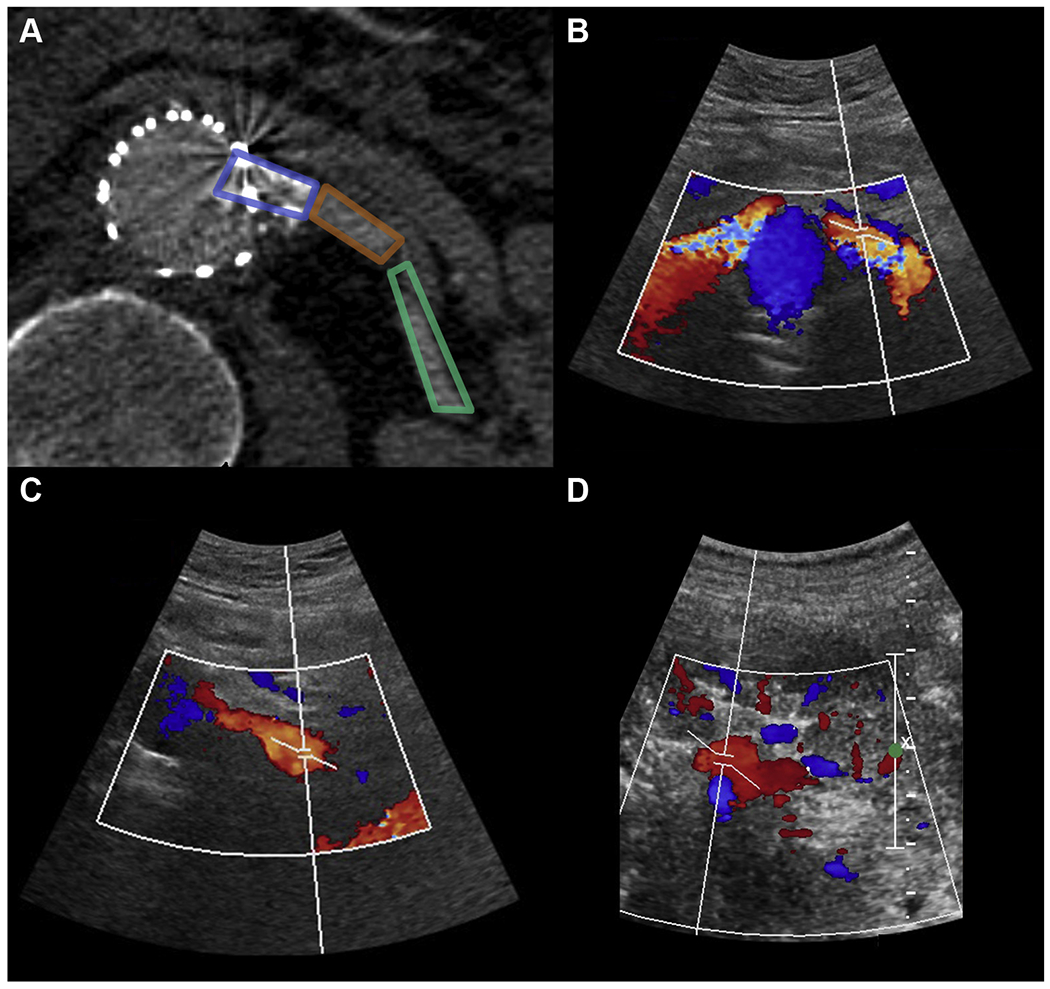
A, Computed tomography (CT) image demonstrating imaged segments of a left fenestrated renal stent with duplex ultrasound (DUS) examination at the proximal (within stent; B), mid (C), and distal renal artery (D).
Statistics.
Descriptive statistics were used to assess demographics, baseline comorbidities, anatomic and device characteristics, and outcome variables as appropriate. Univariate analyses were calculated using Wilcoxon rank-sum test and Pearson χ2 test for continuous and categorical variables, respectively. We evaluated the discriminative ability for PSV, EDV, and RAR for detecting stenosis using receiving operating characteristic curve analysis. Each renal artery was evaluated independently. A P value of less than .05 was considered statistically significant for all analyses. All calculations were performed in Stata 12.0 (StataCorp LP, College Station, Tex).
RESULTS
A total of 116 patients were treated with FEVAR from 2012 to 2017 at our institution. All preoperative fenestrated planning as well as the operations were carried out by the senior author (J.L.). In a review of the postoperative imaging follow-up, 60 patients (51.7%) had concurrent CT and renal DUS images available for review. Of these, six patients (8.5%) had limited ultrasound studies owing to overlying bowel gas and were thus excluded from analysis. The remaining 54 patients (90.0%) were selected for the core analysis in this study. A total of 94 renal stents (48 left, 46 right) and 14 superior mesenteric stents were placed in 54 patients. Three renal stents required additional distal bare metal stenting. No celiac stents were placed in this study. Mean follow-up imaging time was 23.3 months. Of the 54 patients, 43 had contrast CT scans available for review, with the remaining having noncontrast scans owing to impaired renal function. Patient characteristics are summarized in Table I. Measurements of PSV and EDV were obtained in 86 (91.4%), 85 (90.4%), and 84 (89.4%) renal vessels at the proximal, mid, and distal portions, respectively. Twelve cases of renal patency loss in 10 patients (9 stenoses, 3 occlusions) were found on CT imaging. DUS was able to detect flow abnormalities on 11 (91.6%) of cases of patency loss. Of note, no type III endoleaks associated with renal fenestrations were found in this cohort.
Table I.
Demographics, and anatomic and device characteristics (N = 54)
| Characteristics | No. (range) | % |
|---|---|---|
| Male | 45 | 83.3 |
| Age, years | 74.3 (58-92) | |
| Comorbidities | ||
| Hypertension | 46 | 85.2 |
| Hyperlipidemia | 42 | 77.8 |
| Coronary artery disease | 30 | 55.6 |
| CHF | 7 | 12.9 |
| Baseline CKD (stage ≥3) | 27 | 60.7 |
| Smoking history | 43 | 79.6 |
| COPD | 17 | 31.5 |
| Diabetes | 6 | 11.1 |
| Mean follow-up, months | 23.1 (3-56) | |
| Anatomic and device variables | Mean (range) | SD |
| Abdominal aortic aneurysm maximum diameter, mm | 61.5 (45-105) | 12.9 |
| Native neck diameter, mm | 27 (18-55) | 7.7 |
| Native neck length, mm | 3.7 (0-13) | 3.3 |
| Device diameter, mm | 30.2 (24-36) | 3.5 |
| Renal stent diameters, mm | No. | |
| 5 | 3 | |
| 6 | 64 | |
| 7 | 27 |
CHF, Congestive heart failure; CKD, chronic kidney disease; COPD, chronic obstructive pulmonary disease.
Patent renal stents.
In renal stents with no evidence of stenosis or occlusion on CT imaging, the measured mean PSV was 123.8 ± 54.9, 103.35 ± 59.6, and 77.6 ± 38.3 cm/s at the proximal, mid, and distal segments, respectively. The mean EDV was 28.8 ± 16.1, 25.5 ± 16.8, and 21.5 ± 12.3 cm/s at the proximal, mid, and distal segments, respectively (Fig 2). Five normal renal stents exhibited elevated PSV (>225 cm/s), with three stents exhibiting elevated proximal PSV (307, 280, 232 cm/s) and two stents exhibiting elevated mid PSV (411, 269 cm/s). Upon review of CT imaging in these stents, no evidence of more than 50% stenosis was identified. The measured mean RAR was 2.75 ± 1.55. Thirteen stented renal arteries (18%) were found to have an elevated RAR of greater than 3.5, all of which did not have any evidence of stenosis on CT imaging. Five of these observations had unusually low aortic velocities (<40 cm/s). There was no significant association between measured renal velocity and diameter (P = .873) or length (P = .760) of renal stents.
Fig 2.
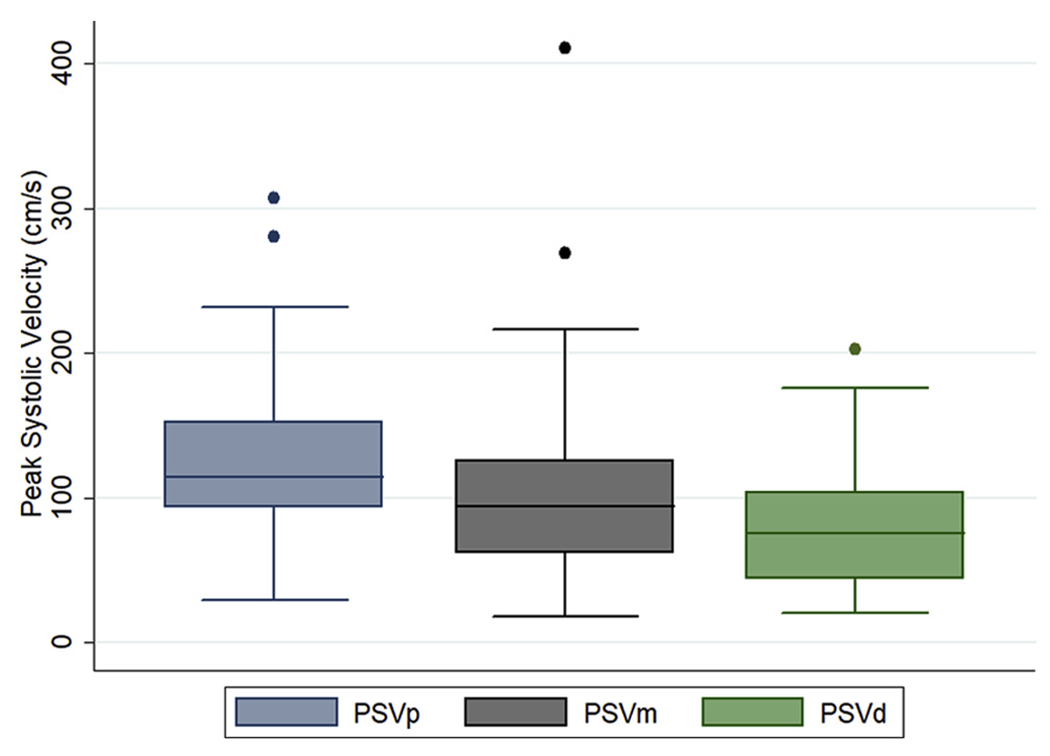
Measured peak systolic velocities (PSV) at the proximal, mid, and distal renal artery segments. Dots refer to outliers stents with elevated velocities on duplex ultrasound (DUS) examination without anatomic evidence of stenosis. PSVd, Distal peak systolic velocities; PSVm, mid peak systolic velocities; PSVp, proximal peak systolic velocities.
Renal stent stenosis.
A total of nine renal stent stenoses were found on CT imaging. Six stents (66%) exhibited compression at the junction of the main body fenestration (eg, junctional stenosis) and occurred later during follow-up (Fig 3). All but one of these stents had elevated proximal PSV significantly above the mean. Measured mean PSV were 349.2 ± 58.8, 242.0 ± 89.3, and 126.6 ± 28.3 cm/s at the proximal, mid, and distal segments, respectively. The mean EDV was 111.8 ± 35.1, 78.0 ± 38.3, and 39.8 ± 5.4 cm/s at the proximal, mid, and distal segments, respectively. The mean PSV and EDV were significantly greater with stenotic stents compared with patent stents (P < .001) at all measured segments. Three stents (33%) were found to have stenosis within the main body (intradevice) at the location of proximal flare (Fig 4), all of which were discovered on the first postoperative imaging surveillance. These stents uniformly had normal proximal PSV (46-97 cm/s) but significantly dampened distal PSV (16-24 cm/s) and distal EDVs in the single digits (8-10 cm/s). The mean RAR was 5.2 ± 1.27 and significantly greater than the patent renal stents (P = .014). A single stenotic stent was found to have nonelevated and nondampened flows with mean peak velocities of 46 (proximal), 58 (mid), and 53 (distal) cm/s with a RAR of 1.2. These characteristics are summarized in Table II.
Fig 3.
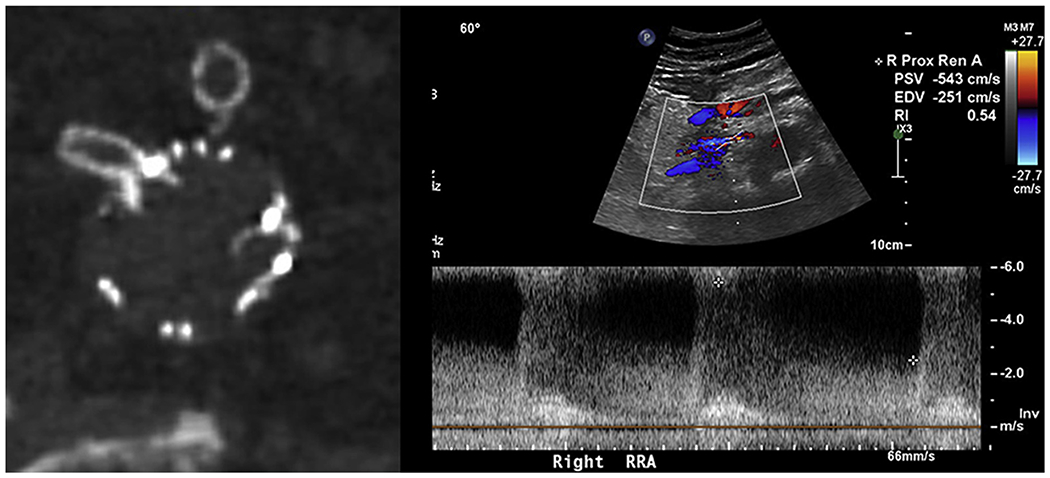
Right renal stent with stenosis at the junction of the main body (left), and corresponding renal duplex demonstrating elevated velocities within the stent (right).
Fig 4.
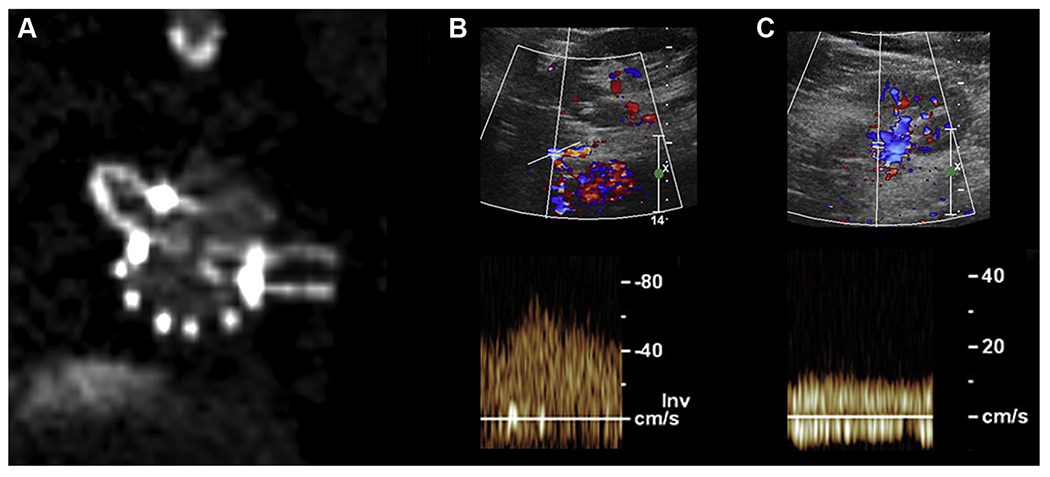
Computed tomography (CT) image demonstrating compression of the left renal stent within the main body in comparison to the right (A), duplex with normal velocities within the left renal stent proximally (B), and dampened flows with slow velocities in the distal renal artery (C).
Table II.
Case series of renal stent compromise with associated duplex ultrasound (DUS) findings
| Stenosis location/type | Side | Detected on DUS | Detection, months | Proximal PSV, cm/s | Mid PSV, cm/s | Distal PSV, cm/s | RAR |
|---|---|---|---|---|---|---|---|
| Junctional | Right | No | 35.0 | 46.0 | 58 | 53.0 | 1.2 |
| Junctional | Left | Yes | 35.0 | 251.0 | 164 | 191 | 6.2 |
| Junctional | Right | Yes | 26.1 | 215 | 142 | 115 | 5.3 |
| Junctional | Right | Yes | 6.5 | 409 | 60 | 57 | 9.5 |
| Junctional | Right | Yes | 9.1 | 543 | 573 | 77 | 3.5 |
| Junctional | Left | Yes | 9.1 | 328 | 271 | 193 | 2.0 |
| Intradevice | Left | Yes | 0.03 | 68 | 75 | 24 | 1.2 |
| Intradevice | Left | Yes | 1.0 | 75 | 16 | 16 | 1.5 |
| Intradevice | Right | Yes | 0.03 | 97 | 20 | 22 | – |
| Occlusion | Left | Yes | 0.5 | 0 | 0 | 0 | 0 |
| Occlusion | Left | Yes | 2.2 | 0 | 0 | 0 | 0 |
| Occlusion | Right | Yes | 0.01 | 0 | 0 | 0 | 0 |
PSV, Peak systolic velocities; RAR, renal-aortic velocity ratio.
Renal stent occlusion.
Three renal stent occlusions were detected in this study, with all three stent occlusions detected on DUS and confirmed with either contrast CT imaging and/or conventional angiography at the time of intervention. On subsequent angiography, occlusion was found to be secondary to distal kinking at the interface of the stent and native renal artery in two cases; no cause of occlusion was found in the remaining case. Duplex findings in these cases showed no flow within the renal stent at all measured segments.
Duplex threshold criteria for stenosis.
Accelerated proximal PSV served as a strong classifier for junctional stenosis (Fig 5; area under the curve, 0.98), with a cutoff value of greater than 215 cm/s supplying a sensitivity of 83.3% and a specificity of 93.75%. Dampened distal PSV also served as a strong classifier for renal stent stenosis within the main body, with a cutoff value of less than 25 cm/s supplying a sensitivity of 100% and a specificity of 97.4%. A combined criterion of proximal or mid PSV of greater than 215 cm/s or distal PSV of less than 25 cm/s resulted in a sensitivity of 91.6% and a specificity of 85.3% for detecting patency loss secondary to any type of stent stenosis. Using this criteria, the positive predictive value (PPV) was 78.5% (11/16) and the negative predictive value (NPV) was 98.7% (1/76).
Fig 5.
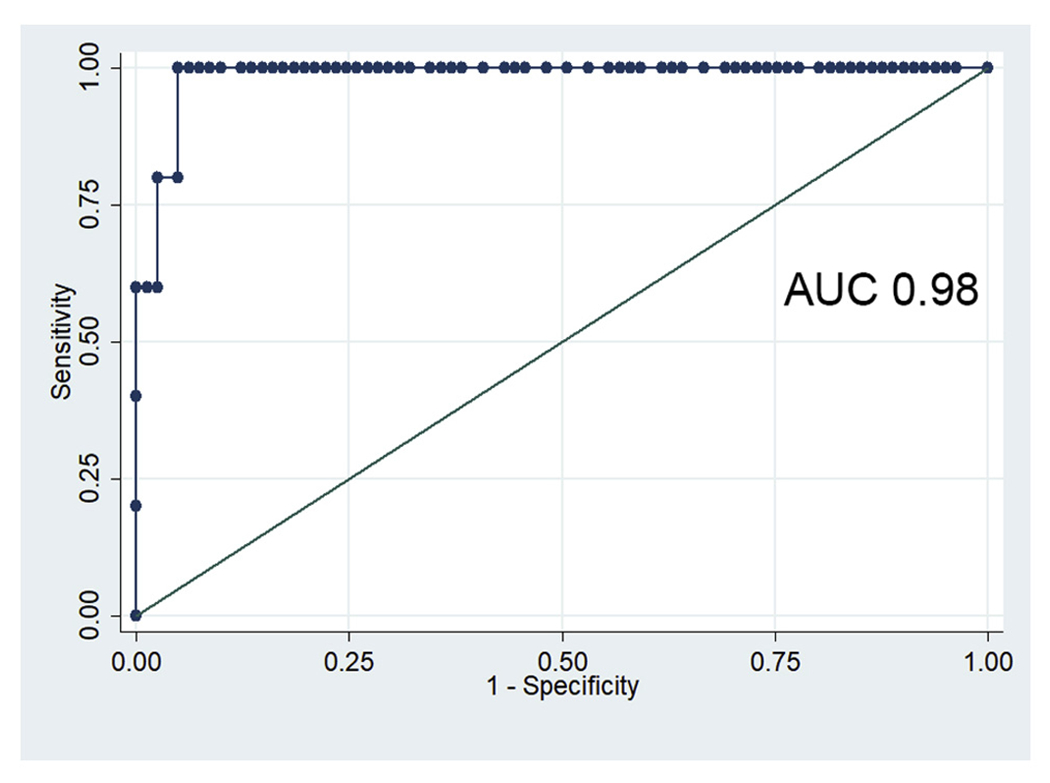
Receiver operator curve for proximal peak systolic velocities (PSV) as an indicator of junctional stenosis of a fenestrated renal stent graft. AUC, Area under the curve.
Reintervention.
In the three cases of stent occlusion, these patients underwent catheter-based thrombolysis and relining of stents with covered stents, giving a secondary patency of 100%. Of the remaining nine stents with stenosis, seven underwent angioplasty with stenting and two underwent angioplasty alone. All stents were found to have flow-limiting (>50%) stenosis on subtraction angiography. DUS after reintervention was obtained in 9 of the 12 cases of reintervention, all of which showed normalization of measured proximal and distal PSV. The overall primary-assisted patency in our cohort is, therefore, 97%.
DISCUSSION
Surveillance strategies for assessing branch graft integrity after FEVAR remains a topic of debate given the radiation and contrast dye use with CTA. Current practice patterns vary widely between surgeons and institutions. In this retrospective study, we demonstrate that DUS can serve as reasonable alternative to CT angiography for detecting renal stent compromise with high sensitivity and specificity. Of a combined twelve cases of renal stent stenosis or occlusion on CT scan, only one stent with greater than 50% stenosis was found to have completely normal flow velocities on DUS, giving a reasonable NPV. Elevated peak velocities of greater than 215 cm/s in the proximal or midrenal segment, or dampened flows of less than 25 cm/s in the distal unstented renal artery were both sensitive (91.6%) and specific (85.3%) for detecting patency loss secondary to any type of stent stenosis.
Only two studies to date have been published examining the role of DUS for renal graft surveillance after complex endovascular aneurysm repair. Mohabbat et al9 in 2009 first published their experience at the Cleveland Clinic using DUS for surveillance of both uncovered (n = 287) and covered stents (n = 231) renal implanted during complex EVAR. This study involved both patients treated with investigative fenestrated devices for juxatrenal aneurysms as well as investigative branched devices for thoracoabdominal aneurysms. Stenosis or occlusion occurred in 4.7% of implanted covered stents compared with 14.5% in uncovered stents. They found that renal flow velocities may be elevated to 280 cm/s in the absence of CT evidence of stent stenosis, and thus suggested revised criteria using a threshold of PSV greater than 280 cm/s (sensitivity 93%, specificity 100%, PPV 99%, NPV 99%) or a RAR of greater than 4.5 (sensitivity 83%, specificity 89%, PPV 42%, NPV 98%).
More recently, Heneghan et al8 described their experience with DUS surveillance in their series of patients treated with physician-modified fenestrated endografts. A total of 40 patients with 80 renal stents were described, with seven stents exhibiting greater than 60% stenosis. Using a criteria of greater than 200 cm/s, they found that 17 renal stents met the traditional criteria for renal stenosis by velocity criteria. However, all of these stents were not found to have structural stenosis on concurrent CT imaging. Their group reported a 0% risk of renal compromise during follow-up, and thus were unable to recommend new threshold criteria after covered stent placement in FEVAR using a physician-modified fenestrated endograft approach.
It is worth mentioning prior literature regarding duplex criteria for in-stent restenosis after bare metal stenting of de novo renal artery stenosis. In the Renal Artery Stenting with Noninvasive Duplex Ultrasound Follow-up trial, Rocha-Singh et al12 found that PSV of greater than 225 cm/s and a RAR of greater than 3.5 were indicative of a greater than 60% stenosis with a sensitivity of 83.3% and specificity of 91.7% (PPV 94%, NPV 78.6%) in a cohort of 108 stents. Del Conde4 in 2013 uniquely suggested two threshold criteria for evaluating in-stent restenosis after renal artery stenting, with PSV between 241 and 297 cm/s (sensitivity 93%, specificity 89%, PPV 80%, NPV 96%) representing an initial gray zone threshold, of which stents require further evaluation with CT or conventional angiography. A second threshold of PSV of greater than >296 cm/s was a more specific indicator (specificity 98%) at the cost of sensitivity (78%).4
In comparison with these studies, we found that a criterion consisting of both an upper (>215 cm/s) and lower PSV (<25 cm/s) threshold was the best indicator for renal stent stenosis with clinically meaningful sensitivity and specificity. We believe this dual threshold criteria is important because it differentiates between two types of stenosis that occur in renal branch grafts in the setting of a fenestrated aortic endograft. Compression at the junction of the fenestration (junctional stenosis) resulted in elevated velocities above baseline owing to a sudden increase in turbulent flow across the junction that can easily be detected on DUS. In contrast, narrowing of the stent within the main body device (eg, at the usual location of proximal flare intradevice) was found to have a normal measured PSV within the stent, but severely dampened velocities in the distal renal artery. Interestingly, no elevated velocities were able to be found in this select number of stents at the origin of the stent. We hypothesize that this may be due to non-physiologic competing local flow patterns at the interface between the intruding renal stent fabric and the aortic endograft, although simulated studies would be required to further investigate this. In addition, it is possible that DUS may not be sensitive to detecting flow velocity increases at the most proximal portion of the stent owing to shadowing. In contrast with other studies, we did not find RAR to be a sensitive or specific marker for renal stenosis as the RAR varied considerably between 1.2 and 9.5 for stents with CT-proven stenosis. This finding again may be due to differences in local flow patterns after FEVAR compared with the native anatomy. Interestingly, we also observed unusually low aortic flow velocities in a select number of stents, which resulted in falsely elevated RARs, again supporting the hypothesis that FEVAR may alter the traditionally understood ranges of aortic velocities. Further research would help to elucidate the mechanism behind these findings.
To our knowledge, this study is the first to describe DUS criteria surveillance of covered renal stent grafts used exclusively with the commercially approved ZFEN device (Cook Inc, Bloomington, Ind). We believe the strengths of this study include proposing DUS criteria involving a single type of stent (iCAST) that is the most commonly utilized currently with the only U.S. Food and Drug Administration-approved fenestrated stent graft (Cook ZFEN). This combination is available widely and commercially and frequently used in combination. In addition, this study is the first to describe DUS findings at various segments along the renal artery (intrastent and extrastent). The midterm follow-up was also achieved and reached a mean of nearly 2 years.
Multiple limitations to this study exist and are worth discussion. Being retrospective, by nature, results in implicit bias in interpreting results. Traditional gold standard angiography with digital subtraction was not used to confirm our CT findings, although in clinical practice and modern literature cross-sectional CT imaging serves as a useful surrogate. There was also no preset protocol for preoperative and postoperative DUS surveillance in our practice, and as such additional selection bias exists in regard to which patients received DUS vs CTA. Namely, patients with decreased renal function, preferentially received DUS compared with CTA during follow-up. This consideration remains particularly important in patients who underwent FEVAR, because prior studies have shown a higher than average decrease in the glomerular filtration rate in these patients even without evidence of renal graft compromise.13 Future research should thus focus on developing protocolized DUS and CT surveillance algorithms for surveillance after FEVAR, larger sample sizes to confirm or contradict our described DUS findings found in renal stent failure, and multi-institutional analyses to minimize potential measurement bias associated with a single core laboratory. It may also prove useful to analyze measured velocities as they relate to specific renal stent geometries and take-off angles, because this factor may influence both physiologic flow and duplex measurements.
CONCLUSIONS
Renal DUS is both a sensitive and specific modality for detecting renal stent compromise after FEVAR with covered renal branch grafts. Patterns of segmental velocity elevation (proximal PSV >215 cm/s) and dampening in the distal renal artery (distal PSV <25 cm/s) are indicators for likely hemodynamic compromise. Patients with these findings should undergo further CT imaging and/or conventional angiography with intervention. DUS may thus function as a useful modality for branch graft surveillance after FEVAR, thereby reducing costs, radiation exposure, and the use of nephrotoxic agents. We advocate for the routine use of renal DUS as the modality of choice for continued surveillance of renal branch grafts during mid and late-term follow-up, with cross-sectional CT imaging reserved for the first postoperative imaging modality during the early postoperative period.
ARTICLE HIGHLIGHTS.
Type of Research: Retrospective, single-center, cohort study
Key Findings: Fenestrated endovascular aneurysm repair (FEVAR) in 54 patients with juxtarenal aortic aneurysms resulted in renal patency loss of 12 renal arteries in 10 patients with a mean follow-up of 23 months. Proximal renal artery peak systolic velocities of greater than 215 cm/s and distal peak systolic velocities of less than 25 cm/s had a sensitivity of 91.6% and specificity of 85.3% for detecting renal artery patency loss.
Take Home Message: Renal artery duplex ultrasound surveillance can be used after FEVAR to identify renal arteries at risk of patency loss.
Footnotes
Author conflict of interest: none.
Presented at the Thirty-third Annual Meeting of the Western Vascular Society, Santa Fe, NM, September 22-25, 2018.
The editors and reviewers of this article have no relevant financial relationships to disclose per the JVS policy that requires reviewers to decline review of any manuscript for which they may have a conflict of interest.
REFERENCES
- 1.Leinre T, De Haan MW, Nelemans OJ, van Engelshoven JM, Vasbinder GB. Contemporary imaging techniques for the diagnosis of renal artery stenosis. Eur Radiol 2005:2219–29. [DOI] [PubMed] [Google Scholar]
- 2.Kohler TR, Zierler RE, Martin RL, Nicholls SC, Bergelin RO, Kazmers A, et al. Noninvasive diagnosis of renal artery stenosis by ultrasonic duplex scanning. J Vasc Surg 1986;4:450–6. [DOI] [PubMed] [Google Scholar]
- 3.Rocha-Singh K, Jaff MR, Kelley EL; RENAISSANCE Trial Investigators. Renal artery stenting with noninvasive duplex ultrasound follow-up: 3-year results from the RENAISSANCE renal stent trial. Catheter Cardiovasc Interv 2008;72:853–62. [DOI] [PubMed] [Google Scholar]
- 4.Del Conde I, Galin ID, Trost B, Kang J, Lookstein R, Woodward M, et al. Renal artery duplex ultrasound criteria for the detection of significant in-stent restenosis. Catheter Cardiovasc Interv 2014;83:612–8. [DOI] [PubMed] [Google Scholar]
- 5.Zhou W, Felkai DD, Evans M, Mccoy SA, Lin PH, Kougias P, et al. Ultrasound criteria for severe in-stent restenosis following carotid artery stenting. J Vasc Surg 2008;47:74–80. [DOI] [PubMed] [Google Scholar]
- 6.Stanziale SF, Wholey MH, Boules TN, Selzer F, Makaroun MS. Determining in-stent stenosis of carotid arteries by duplex ultrasound criteria. J Endovasc Ther 2005;12:346–53. [DOI] [PubMed] [Google Scholar]
- 7.AbuRahma AF, Maxwell D, Eads K, Flaherty SK, Stutler T. Carotid duplex velocity criteria revisited for the diagnosis of carotid in-stent restenosis. Vascular 2007;15:119–25. [DOI] [PubMed] [Google Scholar]
- 8.Heneghan RE, Starnes BW, Nathan DP, Zierler RE. Renal duplex ultrasound findings in fenestrated endovascular aortic repair for juxtarenal aortic aneurysms. J Vasc Surg 2014;63:915–21. [DOI] [PubMed] [Google Scholar]
- 9.Mohabbat W, Greenberg RK, Mastracci TM, Cury M, Morales JP, Hernandez AV. Revised duplex criteria and outcomes for renal stents and stent grafts following endovascular repair of juxtarenal and thoracoabdominal aneurysms. J Vasc Surg 2006;49:827–37. [DOI] [PubMed] [Google Scholar]
- 10.Lee JT, Lee GK, Chandra V, Dalman RL. Comparison of fenestrated endografts and the snorkel/chimney technique. J Vasc Surg 2014;60:849–56; discussion 856–7. [DOI] [PubMed] [Google Scholar]
- 11.Greenberg RK, Haulon S, Lyden SP, Srivastava SD, Turc A, Eagleton MJ, et al. Endovascular management of juxtarenal aneurysms with fenestrated endovascular grafting. J Vasc Surg 2004;39:279–87. [DOI] [PubMed] [Google Scholar]
- 12.Rocha-Singh K, Jaff MR, Kelley EL, Schneider J, Yaryura R, Elsner G, et al. Renal artery stenting with noninvasive duplex ultrasound follow-up: 3-year results from the RENAISSANCE renal stent trial. Catheter Cardiovasc Interv 2008;72:853–62. [DOI] [PubMed] [Google Scholar]
- 13.Tran K, Fajardo A, Ullery BW, Goltz C, Lee JT. Renal function changes after fenestrated endovascular aneurysm repair. J Vasc Surg 2016;64:273–80. [DOI] [PubMed] [Google Scholar]