

Abstract
PURPOSE:
To characterize and compare patient-reported recovery of function after cataract or glaucoma surgery using a novel visual analog scale.
DESIGN:
Prospective observational cohort study
METHODS:
Daily for two weeks and weekly thereafter, patients recovering from trabeculectomy, tube shunt implantation, or cataract extraction (CE) completed a diary-style questionnaire including visual analog scales (VAS; scored 0–100) grading pain and global function. Clinical exam data and medical histories were collected. Generalized estimating equation models evaluated associations between VAS function scores and pain or visual acuity, and compared scores between surgery types.
RESULTS:
Among 51 participants followed for 12 weeks, tube shunt placement reduced post-operative day 1 (POD1) function by 47/100 points versus CE (p=0.006), while trabeculectomy did not reduce POD1 function versus CE (p=0.33). Following CE, trabeculectomy, and tube shunt placement, average VAS function scores increased 13.94 per week for 2 weeks (p<0.001), 4.18 per week for 4 weeks (p=0.02), and 7.76 per week for 7 weeks (p<0.001), respectively. After those timepoints, there was no further significant change. Beyond 2 weeks, pain levels plateaued and visual acuity (VA) returned to baseline across surgery types; function was inversely related to pain or VA only for the first 2 or 4 weeks, respectively.
CONCLUSIONS:
Patients recovering from cataract and glaucoma surgery report reduced function in the post-operative period. Tube shunt implantation causes greater morbidity than trabeculectomy, and both are associated with slower improvement than CE. Early post-operative function is associated with VA and pain, but neither fully explains reported impairment. A VAS for function may efficiently capture post-operative recovery.
Keywords: glaucoma, surgical recovery, trabeculectomy, tube shunt, cataract extraction, visual analog scale (VAS)
TABLE OF CONTENTS STATEMENT
This three-month prospective observational cohort study gathered data on self-reported functional performance from participants recovering from cataract extraction, trabeculectomy, and tube shunt implantation, using a visual analog scale (VAS). Relationships between these data and study participants’ self-reported pain; ability to perform specific daily activities; and demographic, medical, and ocular factors were evaluated, and differences in functional recovery from different types of ophthalmic surgery were compared.
INTRODUCTION
Over 7 million ophthalmic surgeries are performed annually in the US, representing 15–20% of all outpatient surgery, and worldwide more than 25 million ophthalmic procedures are performed each year.1,2 Patients routinely ask when they should expect to return to work, driving, and other important activities after eye surgery. However, providers are ill-equipped to answer because surgical trials, and even studies of surgical recovery, report clinical measures like visual acuity (VA), intraocular pressure (IOP), visual field (VF) sensitivity and, occasionally, discomfort, but largely neglect functional performance. 3–9 Studies of cataract extraction (CE) patients report that VA typically improves within one week, but also that even with good acuity, function is impacted by glare or halos in as many as half of patients.7,8 Landmark glaucoma trials report IOP at multiple post-operative intervals, but none address pain and few describe other components of surgical recovery such as visual disability, or even VA, in the immediate post-operative period (days to weeks). 4,10–12 One exception is found in the cataract surgery literature, where a few studies include the Catquest-9SF, a validated measure of visual disability which outperformed other questionnaires in capturing 6-month post-operative outcomes.13 However, Catquest is designed to be responsive to change at intervals greater than or equal to 2 weeks, so even with clinical aspects of recovery from CE well understood, functional aspects in the early weeks of recovery are not.14 Appreciating when and why different post-operative patients return to their baseline level of functioning could substantially improve patient care, yet we lack a measure of patient-reported function suitable for use immediately following ophthalmic surgery.
Function refers to a person’s ability to perform routine activities, such as self-care, reading, and moving from place to place, and both informs and is influenced by their sense of well-being.15 While specific abilities are measurable, the combination of abilities that represents each patient’s baseline or target function is highly individual; one person’s typical or goal activity level might look like functional impairment in another. However, most people can report whether or not they are at their baseline or target level of functioning in a given area. Reaching this level is likely what they are referring to when patients ask providers to predict surgical recovery, and we currently lack data on how long it will take them to achieve it.
Pain, like function, is also a uniquely contextual and individual concept, and is often elicited in medical encounters. A well-validated tool for capturing a patient’s self-reported pain is a visual analog scale (VAS), a unidimensional, single-item questionnaire.16 A VAS consists of a 100mm line, traditionally horizontal, which is labeled at its ends with opposite extremes (for example, “no pain” (score of 0) vs. “worst imaginable pain” (score of 100)).17 Patients are asked to place a vertical hash mark along the line to indicate their level of pain and, while interpretation is contextual, investigators agree that approximately 10mm represents a minimal clinically important difference (MCID) in post-operative pain.18,19 The straightforwardness and brevity of this task makes the pain VAS a widely applicable patient-reported outcome (PRO) measure for both clinical and research settings.16 In rheumatology and elsewhere, researchers seeking an efficient PRO measure have also applied VAS to non-pain concepts like function and fatigue, finding they are internally valid and fit Rasch model expectations.20,21
Here we describe a novel approach to capturing patient-reported function following CE or glaucoma surgery (trabeculectomy or tube shunt), based on a VAS model. We can gather from the published literature that patients undergoing different types of ophthalmic surgery reach their best post-operative VA or experience resolution of pain at different times.3,4,8,22 Many factors including demographics, ocular and medical history, and surgical details may impact recovery. In this study, patients undergoing CE, trabeculectomy, or tube shunt were asked to complete a diary-style questionnaire (Appendix) daily for two weeks, and then weekly until 3 months after surgery. VAS were used to rate both pain and overall function, and were complemented by questions about participant’s daily activities and clinical exam data. We hypothesize that patients recovering from a variety of ophthalmic surgeries are capable of rating their global function along a unidimensional scale, rendering a VAS capable of capturing post-operative recovery dynamics, and that self-reported recovery differs among surgery types.
METHODS
Study design and study population
The Center for Optimizing Recovery from Eye Surgery (CORES) study recruited a prospective longitudinal cohort of patients undergoing surgery for cataracts or glaucoma at the Glaucoma Center of Excellence at the Johns Hopkins Wilmer Eye Institute from December 2018 to September 2019. Patients 18 years of age or older and able to fluently speak and read English who were scheduled for an ophthalmic procedure by an ophthalmologist on the study team were considered for inclusion in this study. Exclusion criteria included: (1) confinement to a bed or wheelchair, (2) dependence on another person for all instrumental activities of daily living (these include meals, food shopping, money management, telephone usage, household work, travel beyond walking distance, medication administration), (3) ocular or non-ocular surgery or hospitalization in the preceding 3 months, (4) simultaneous bilateral ophthalmic surgery, and (5) cognitive impairment preventing questionnaire completion. Study procedures were approved by the Johns Hopkins Institutional Review Board (IRB #172771) and performed in accordance with the tenets of the Declaration of Helsinki. All participants provided written informed consent.
Diary-style questionnaire
Study participants answered questions about functional recovery after CE or glaucoma surgery using a diary-style booklet of brief questionnaires. Daily for the first two weeks after surgery and weekly for eleven weeks thereafter, they completed two VAS (one for self-reported overall function, the other for pain) and nine multiple-choice questions about their ability to perform instrumental activities of daily living (IADLs) (Appendix). The VAS for function consisted of a Yes/No question prompt - “Are you functioning better than prior to your procedure?” - followed by this phrase: “If NO: Compared to before my procedure I can do:” and a 100mm line labeled on its ends, “None of my usual activities,” and “All of my usual activities.” Participants placed a vertical hash mark through the line to indicate how close to their baseline functioning they felt that day. The distance of the hash mark from the left side of the line in millimeters was recorded as a value between 0 and 100; an answer of “Yes” to the first question (“Are you functioning better than prior to your procedure?”) was coded as a score of 110. The VAS for pain, introduced with “Rate your current level of eye pain,” and labeled on its ends, “No pain,” and “Worst possible pain,” was scored in the same way. As a part of the diary, participants also indicated whether they were able to: work, drive, leave home, prepare meals, use the telephone, and manage medications. They were also asked to list three additional activities they would like to return to as soon as possible after surgery. Answer choices for questions about function (“Are you able to…?”) were “Yes,” “Yes, with difficulty/help,” and “No,” coded as 2, 1, or 0 respectively for analysis.
Clinical data
Frequent post-operative examinations afforded clinical data during the period corresponding to the diary-style questionnaire. Clinical data were abstracted from participants’ medical records to match diary time points (BSL – pre-operative baseline, POD1 – post-operative day 1, POW1 – post-operative week 1, POW2 – post-operative week 2, POM1 – post-operative month 1, POM2 – post-operative month 2 and POM3 – post-operative month 3). During the clinical exam, visual acuity (VA) was assessed in participants’ habitual distance correction using a computerized Snellen chart and converted to the logarithm of the minimum angle of resolution (logMAR) for analysis. Glaucoma severity was represented by pre-operative VF mean deviation (MD) in the better eye, which has been shown to capture function just as well as integrated VF measures.23 The Humphrey Field Analyzer II (Carl Zeiss Meditec, Inc., Dublin, CA, USA) was used for all VF testing. One glaucoma specialist (CZ) screened VFs for reliability, absence of artifacts, and consistency with prior VF performance. Chart review was used to gather participants’ age, gender, and race, as well as to identify medical comorbidities and prescription medications.24 Those with more than three comorbid illnesses (n=3) were reclassified as having 3 comorbidities. Polypharmacy was defined as five or more daily prescription medications, excluding eye drops.
Statistical analysis
ANOVA, Pearson chi square test or Kruskal-Wallis tests were used, depending on the distribution of the variables, to compare demographic characteristic between the three surgery groups (Table 1). The Wilcoxon rank-sum test was used to compare VAS function scores between different surgery pairs on post-operative day 1 (POD1). The Kruskal-Wallis test was used to compare VAS function scores between the three surgery types at each study visit (Table 2). The Fisher’s exact test was used to evaluate the association between reported ability to perform individual daily activities and surgery type by study visit (Figure 2). Participants who reported they could not perform a particular activity at baseline (answering “No” when asked “Are you able to…?”) were excluded from this analysis. The Kruskal-Wallis test was used to evaluate the association between the total score for each participant’s three self-selected activities (sum of three scores 0 to 2, for a score range 0 to 6) and surgery type, stratified by study visit.
TABLE 1.
Study Population Characteristics
| Demographics | Cataract (n=15) | Trabeculectomy (n = 18) | Tube (n=18) | P Value |
|---|---|---|---|---|
| Age (y), mean (SD) | 68.3 (9.8) | 72.1 (11.3) | 62.7 (16.5) | .10 |
| African American race, n (%) | 5 (33) | 6(33) | 2(11) | .22 |
| Female gender, n (%) | 5 (33) | 8(44) | 11 (61) | .27 |
| Employed, n (%) | 4(29) | 9(50) | 9 (50) | .39 |
| Married, n (%) | 12 (80) | 10 (56) | 15 (83) | .13 |
| Health | ||||
| Comorbid illnesses > 1, n (%) | 10 (67) | 8(44) | 8 (44) | .35 |
| BMI (kg/m2), mean (SD) | 28.4 (5.9) | 25.5 (4.8) | 30.0 (5.2) | .06 |
| Polypharmacy,a n (%) | 10 (67) | 10 (59) | 8 (44) | .42 |
| Vision | ||||
| MD better-eye (dB), median (IQR) | −2.38 (−7.49 to −0.62) | −5.90 (−15.46 −2.59) | −2.29 (−7.32 to −0.23) | .09 |
| Better-eye acuity (logMAR), median (IQR) | 0.10 (0–0.18) | 0.10 (0–0.18) | 0.14 (0–0.18) | .69 |
BMI = body mass index; dB = decibel; IQR = interquartile range; logMAR = logarithm of minimum angle of resolution; MD = mean deviation; SD = standard deviation.
Polypharmacy is defined as ≥5 daily prescription medications, excluding eye drops.
Table 2.
Comparison of VAS function scores between surgery types, stratified by study visits
| VAS functional score (%) | Cataract |
Trabeculectomy |
Tube |
p-value |
|---|---|---|---|---|
| mean (SD), median (IQR) | mean (SD), median (IQR) | mean (SD), median (IQR) | ||
| POD1 | 79 (41.7), 110 (45–110) | 72 (36.8), 84 (42–100) | 32 (34.5), 22 (3–54) | 0.006 |
| POW1 | 105 (12.3), 110 (110–110) | 92 (24.3), 100 (85–110) | 70 (36.9), 82 (37–110) | 0.009 |
| POW2 | 107 (9.7), 110 (110–110) | 89 (29.3), 100 (82–110) | 74 (33.6), 83 (55–98) | 0.01 |
| POM1 | 103 (20.0), 110 (110–110) | 91 (30.9), 100 (91–110) | 88 (31.4), 100 (82–110) | 0.13 |
| POM2 | 110 (0.0), 110 (110–110) | 100 (13.0), 100 (100–110) | 101 (13.8), 110 (94–110) | 0.17 |
| POM3 | 110 (0.0), 110 (110–110) | 102 (7.9), 100 (100–110) | 102 (9.6), 105 (96–110) | 0.17 |
SD – standard deviation, IQR – inter quartile range, POD1 – post-op day 1, POW1 – post-op week 1, POW2 – post-op week 2, POM1 – post-op month 1, POM2 – post-op month 2, POM3 – post-op month 3.
Figure 2. Patient-reported ability to perform daily activities.

3a-Work, 3b-Drive, 3c-Leave home, 3d-Prepare meals, 3e-Use telephone, 3f-Take medications. On the y-axis is shown the percentage of those who reported performing each activity without difficulty or help.
Generalized estimating equation (GEE) models were used to evaluate changes in VAS function (Table 3) or VAS pain scores (Table 4) over time for each surgery type, accounting for clustering by participant. GEE models accounting for clustering by participant were also used to evaluate differences in VAS function or VAS pain scores over time between the surgery types. Age, race, gender and glaucoma severity represented by VF MD in the better eye were treated as covariates. Separate GEE models accounting for clustering by participant were used to evaluate the association between VAS function and VAS pain scores over time; models again controlled for surgery type, age, race, gender and MD of the better eye. When lowess plots of the models (Figure 1, Figure 3) were examined, distributions of the VAS function scores over time demonstrated recovery thresholds, beyond which the slopes of the curves did not appear to change. Given this, evaluations were repeated on data segments prior to and after these timepoints. Additional GEE models accounting for clustering by participant were used to evaluate differences in the better eye VA over time and the association between VAS function and the post-operative difference in better eye VA (follow-up VA – baseline VA). Surgery type, age, race, gender and glaucoma severity represented by VF MD in the better eye were again treated as covariates.
Table 3.
Change in VAS function scores over time, stratified by surgery type and number of days/weeks beyond which no further improvement in function was observed.
| VAS function score (%) | Post-op days/ |
VAS function score (%) | Post-op weeks/ |
|---|---|---|---|
| ß 95%(CI) | ß 95%(CI) | ||
| Cataract | Cataract | ||
| ≤14 days | 1.26 (0.77, 1.74) | ≤2 weeks | 13.94 (3.25, 24.64) |
| >2 weeks | 0.42 (−0.19, 1.03) | ||
| Trabeculectomy | Trabeculectomy | ||
| ≤14 days | 0.95 (0.52, 1.39) | ≤4 weeks | 4.18 (1.42, 6.94) |
| >4 weeks | 0.17 (−0.13, 0.48) | ||
| Tube | Tube | ||
| ≤14 days | 2.86 (2.28, 3.44) | ≤7 weeks | 7.76 (5.96, 9.56) |
| >7 weeks | 0.56 (−1.30, 2.41) |
ß – coefficient, CI – confidence interval. Results presented in the table come from separate GEE models that controlled for age, race, gender and better eye mean deviation.
Table 4.
Change in VAS pain scores over time, stratified by surgery type and number of days/weeks beyond which no further change in pain was observed.
| VAS pain score (%) | Post-op days/1-day increase |
Post-op weeks/1-week increase |
|---|---|---|
| ß 95%(CI) | ß 95%(CI) | |
| Cataract | ||
| ≤14 days | −0.91 (−1.20, −0.62) | |
| >2 weeks | −0.20 (−0.62, 0.22) | |
| Trabeculectomy | ||
| ≤14 days | −0.59 (−0.83, −0.34) | |
| >2 weeks | −0.13 (−0.52, 0.26) | |
| Tube | ||
| ≤14 days | −1.53 (−1.86, −1.20) | |
| >2 weeks | −0.23 (−0.57, 0.11) |
ß – coefficient, CI – confidence interval. Results presented in the table come from separate GEE models that controlled for age, race, gender and better eye mean deviation.
Figure 1. Patient-reported VAS function scores.

1a-Cataract, 1b-Trabeculectomy, 1c-Tube shunt. Dotted line (at 14 days for Cataract, at 28 days for Trabeculectomy and at 49 days for Tube shunt) represents the timepoint beyond which no further improvement in VAS function score was observed.
Figure 3. Patient-reported VAS pain scores.

2a-Cataract, 2b-Trabeculectomy, 2c-Tube shunt. Dotted line (at 14 days for Cataract, Trabeculectomy and Tube shunt) represents the timepoint beyond which no further decline in VAS pain score was observed.
RESULTS
Description of study population
A total of 51 participants completed post-operative questionnaires – 15 following CE, 18 following trabeculectomy, and 18 following tube shunt implantation. Nearly half (47%) of participants were female, 25% were African-American, and average age was 67.7 years (SD=13.4). Just over half (51%) had more than one comorbid illness. Median VF MD in the better eye was −3.7 dB (IQR=−8.41, −1.26). There were no significant demographic differences between the CE, trabeculectomy, and tube shunt groups (Table 1).
Associations between VAS score for function and surgery type
Compared to CE, tube shunt placement reduced POD1 function by 47/100 points (POD1 VAS function score for tube shunt placement: mean=32±34.5, median=22, interquartile range (IQR)=3–54; for CE: mean=79±41.7, median=110, IQR=45–110; p=0.006). Trabeculectomy did not reduce POD1 function more than CE (VAS function score for trabeculectomy: mean=72±36.8, median=84, IQR=42–100; p=0.33) (Table 2).
Considering the 12-week study period as a whole, there was no significant difference in the average VAS function score between CE and trabeculectomy (ß=−7.23 points, 95% confidence interval (CI)=−18.62 to 4.16, p=0.21), while patients who underwent tube shut surgery reported average VAS function 13.53 points lower than those recovering from CE (ß=−13.53 points, 95%CI=−24.98 to −2.07, p=0.02). Following CE, VAS function scores increased an average of 13.94 points per week for the first 2 weeks (p<0.001), with mean scores exceeding 100 (105±12.3) by post-operative week 1 (POW1) (Table 3, Table 2). Following trabeculectomy, scores increased an average of 4.18 points per week (p=0.003) for the first 4 weeks post-surgery, to a mean score of 91±30.9 by post-operative month 1 (POM1) and 100±13.0 by POM2 (Table 3, Table 2). Following tube shunt insertion, scores increased an average of 7.76 points per week (p<0.001) for the first 7 weeks, reaching mean scores of 101±13.8 and 102±9.6 by POM2 and 3, respectively (Table 3, Table 2). Beyond recovery thresholds at 2 weeks, 4 weeks, and 7 weeks for CE, trabeculectomy, and tube shunt, respectively, there was no further significant change in VAS function scores for any of the 3 surgery types (p>0.17 for all) (Figure 1, Table 3).
Associations between self-reported activity limitations and surgery type
There was no significant difference in participants’ reported ability to perform individual activities – working, driving, leaving home, preparing meals, using the telephone, managing medications, or self-selected activities - associated with surgery type stratified by study visit (p>0.05 for all) (Figure 2). Considering each post-operative visit separately, the data were sparse but suggested differences in participants’ ability to work at POW1 and ability to drive at POW2; following CE, 75% and 100% reported going back to work by week 1 and to driving by week 2, respectively, compared to 65% and 67% among those with trabeculectomy and 29% and 53% among those with the tube shunt (p=0.05 and p=0.03).
Associations between VAS score for pain and surgery type
Average POD1 VAS pain scores were 15±17.3 (median=8, IQR=0–30), 14±23.0 (median=3, IQR=0–24), and 26±22.1 (median=12, IQR=7–47) following CE, trabeculectomy, and tube shunt insertion, respectively; there was no significant difference between these scores on POD1 (p=0.09). There was also no significant difference in VAS pain scores between the surgeries in either the first 2 weeks or beyond the first 2 weeks of follow-up (p>0.26 for all). In the first 2 weeks after surgery, pain scores improved an average of 0.91 points per day for CE (p<0.001), 0.59 points per day for trabeculectomy (p<0.001), and 1.53 points per day for tube shunt (p<0.001)(Table 4); beyond POW2, there was no further significant change in VAS pain scores for any of the 3 surgery types (p>0.1 for all)(Figure 3).
Associations between VAS scores for function and for pain
Considering all participants across the duration of reported surgical recovery, VAS function scores were reduced by 0.66 points (p<0.001) for every 1-point increase in VAS pain score in the first 2 weeks of surgical recovery. Beyond 2 weeks there was no significant association between the VAS function and VAS pain scores (p=0.12).
Post-operative difference in VA (follow-up VA – baseline VA) and associations between differences in VA and VAS function scores
Significant decrease in better eye VA from baseline was observed across surgeries at POD1 (ß=0.17 logMAR increase in VA, 95%CI=0.10 to 0.25, p<0.001), as well as for each surgery type considered separately (p⩽0.008 for all). Decreased better eye VA was still seen at POW1 after tube shunt implantation (ß=0.25 logMAR increase in VA, meaning worsening of VA; 95% CI=0.03 to 0.46, p=0.02), while VA was not significantly different from baseline for either CE or trabeculectomy patients (p=0.41 and p=0.20, respectively). Beyond POW2, the difference between measured and baseline VA was not statistically significant for any operation (p>0.29 for all) (Figure 4).
Figure 4.
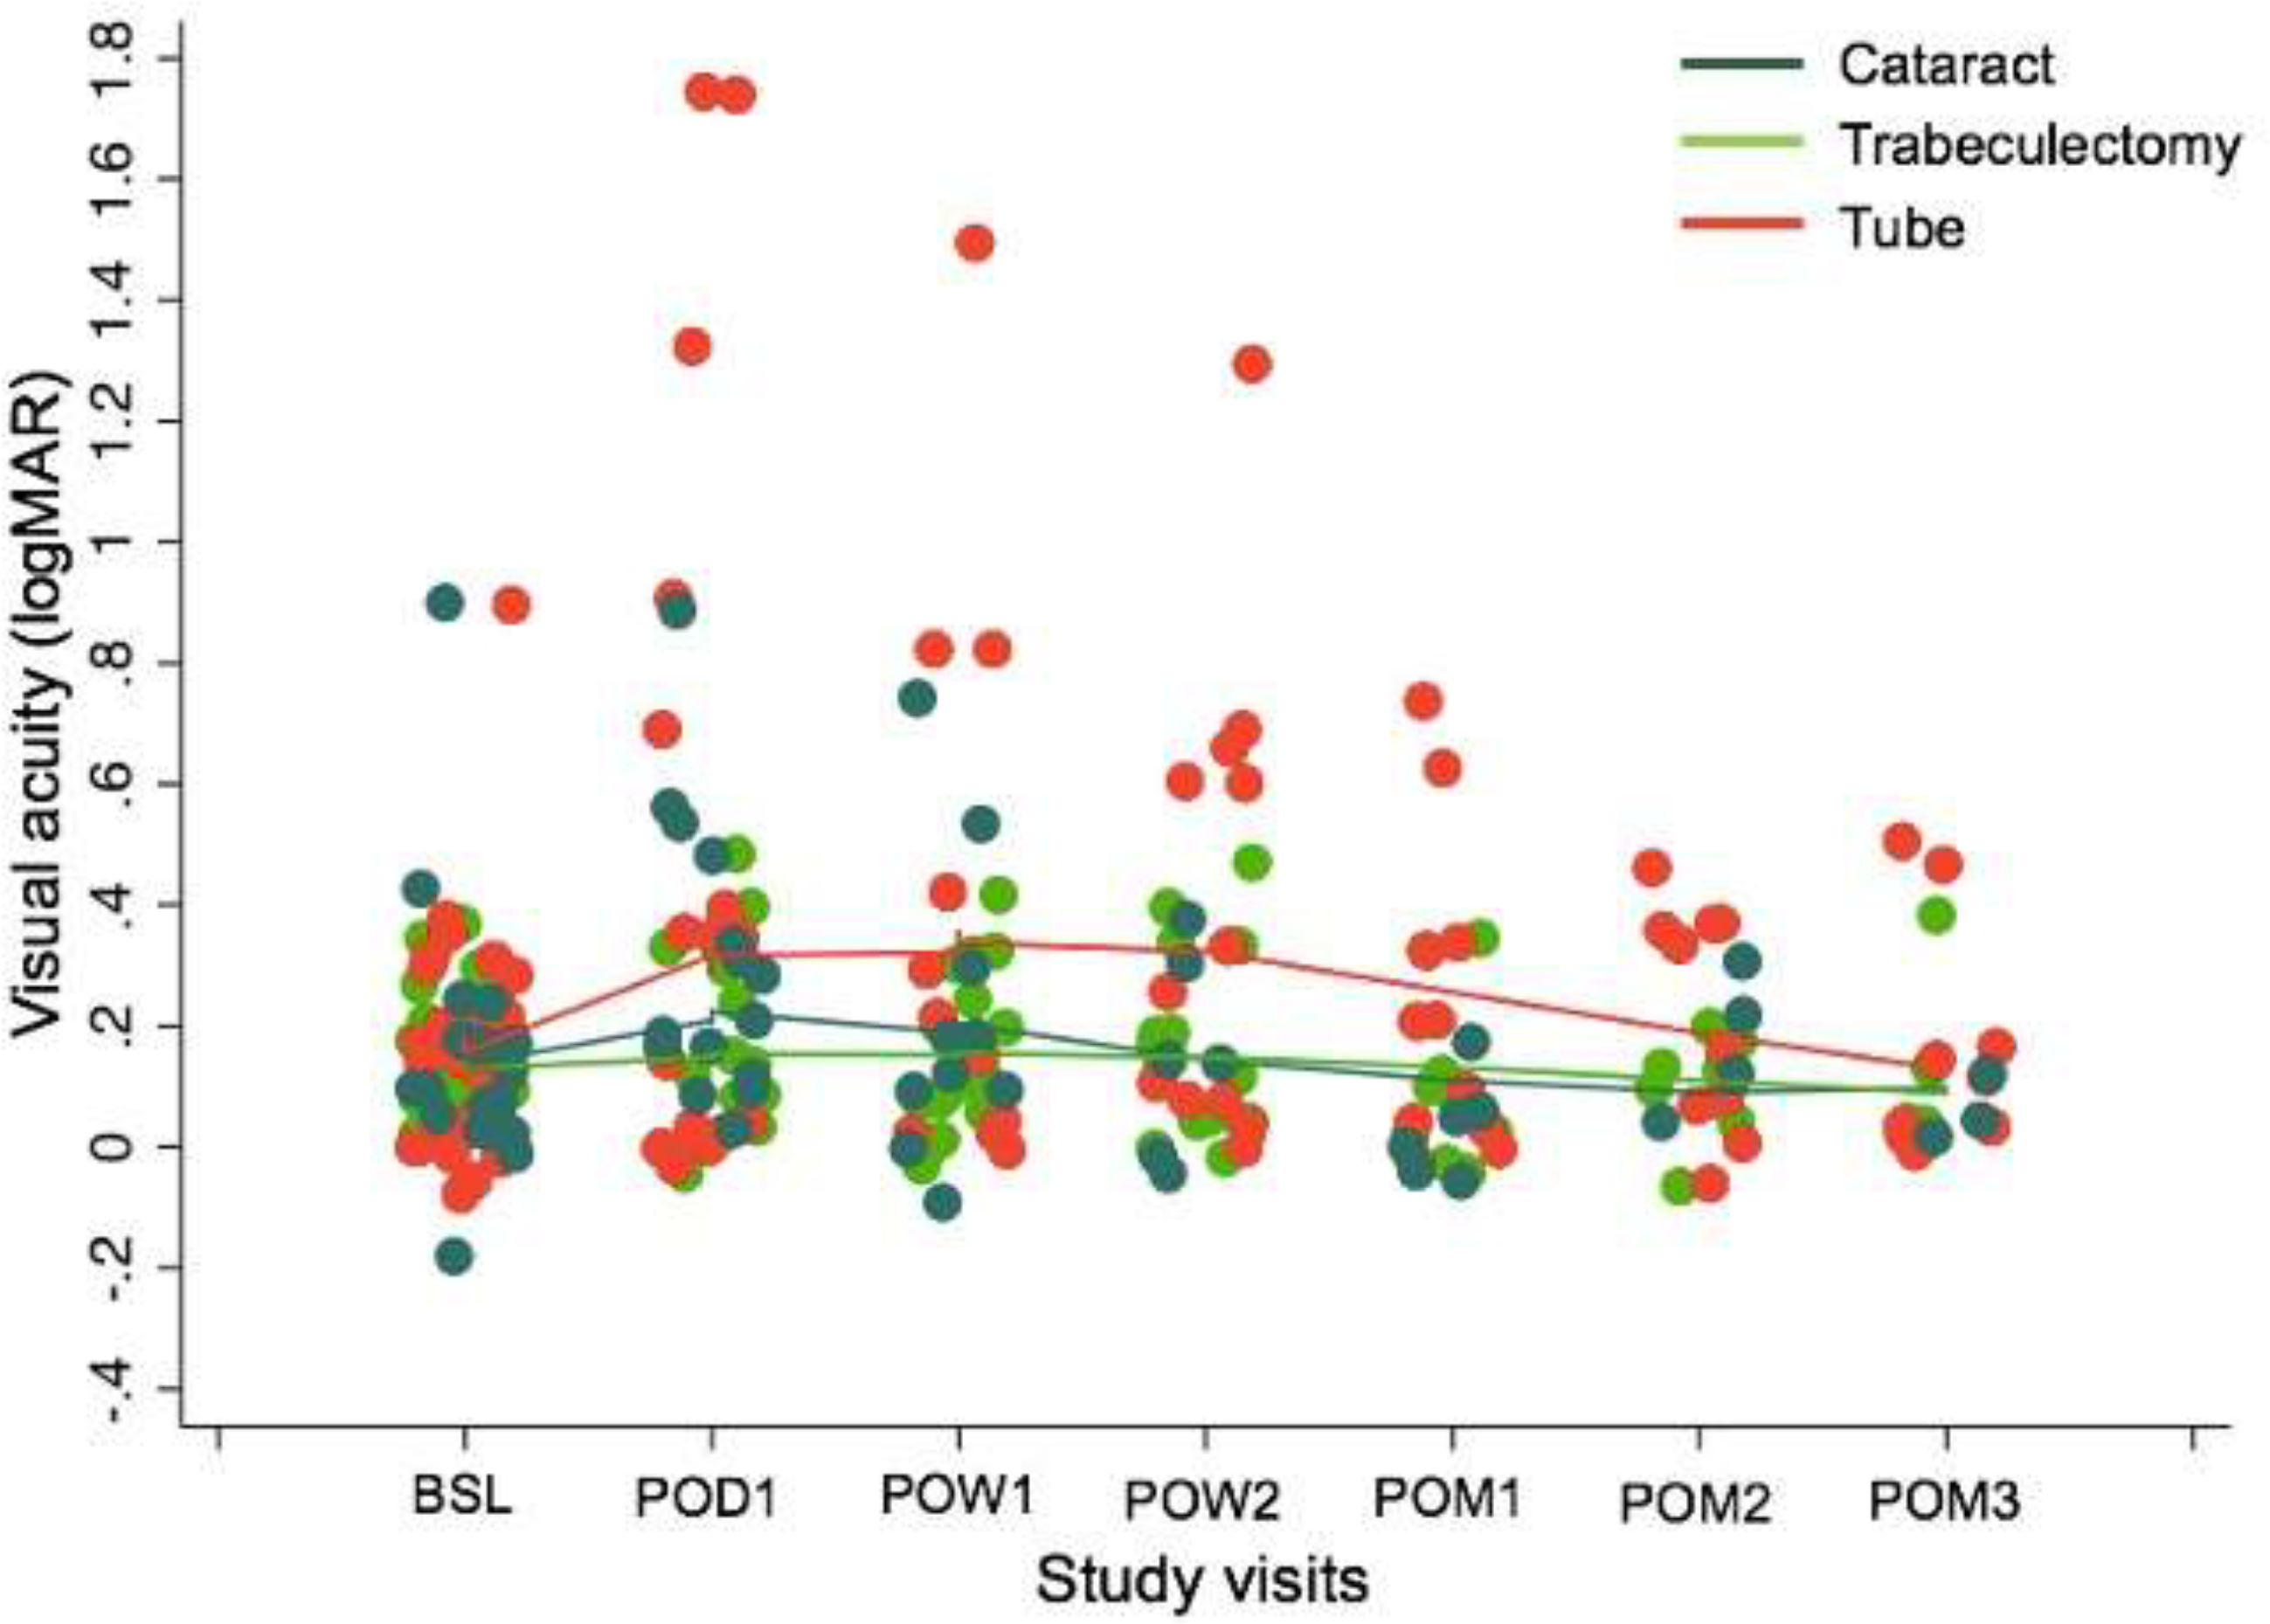
logMAR Visual Acuity.
Associations between VAS function scores and VA were compared for periods when VA was noted to improve and for periods where the change in VA was no longer statistically significant. When all surgery types were considered together, there was a statistically significant relationship between VAS function scores and the difference in better eye VA for the first month in the study (ß=−3.2 points decrease in VAS function score for every 0.1 logMAR increase in VA difference; 95%CI=−5.32 to −1.09, p=0.003); the relationship was no longer significant beyond POM1 (p=0.31), and no significant relationship was found when the 3-month study period was considered as a whole. When analysis was stratified by surgery type, a significant relationship between VAS function score and the difference in better eye VA was found in the first month in the study among participants who underwent tube shunt surgery (ß=−3.67 points decrease in VAS function score for every 0.1 logMAR increase in VA difference; 95%CI=−5.98 to −1.36, p=0.002); the relationship was no longer significant beyond POM1 (p=0.89). There was no significant relationship between VAS function score and the difference in better eye VA for CE or trabeculectomy patients when those surgeries were considered separately (p>0.27 for all).
DISCUSSION
Our findings show that a single-item questionnaire, a VAS, capturing patient-reported function after CE and glaucoma surgeries is sensitive to change on a perioperative time scale (days to weeks) and suggests multi-phase functional improvement that differs by surgery type and is slower than improvement in VA or pain. No such instrument has previously been described for post-operative use in ophthalmology. Participants were asked to grade their function using a VAS reported reduced global function immediately after surgery which improved at a rate unique to each surgery type: Tube shunt implantation impaired post-operative function most dramatically, and both trabeculectomy and tube shunt implantation were associated with longer recoveries and slower rates of functional improvement than CE. This study suggests that a VAS can be useful for comparing rates of functional recovery across surgery types, and provides information with which to educate patients about how long surgical recovery will require.
Over 3 post-operative months, the increase in VAS scores for function was most rapid immediately following surgery and slowed as scores neared or exceeded baseline, at rates and intervals specific to each surgery type. Tube shunt implantation was associated with the greatest dysfunction immediately after surgery (average POD1 VAS function score 32±34.5, versus 79±41.7 for CE). More granular examination of function with questions about specific activities, though based on limited data, may indicate between-surgery differences in the number of patients who reported they could work one week after surgery and could drive two weeks after surgery, with tube shunt implantation causing the greatest disability in both domains (Figure 2). The greater rate of early functional improvement among tube shunt patients primarily reflects their greater functional deficit immediately after surgery. Inflection points, at which VAS scores started to plateau at baseline values, were observed at 2, 4, and 7 weeks for CE, trabeculectomy, and tube shunt implantation respectively. Our findings do not suggest that these differences reflect patient, disease or demographic features, which were treated as covariates. More likely, surgical features, such as greater dissection required for tube shunt insertion, changes in aqueous flow after trabeculectomy suture lysis or through temporarily-ligated tubes, or deeper anesthesia (one participant receiving a tube shunt required general anesthesia), could explain the greater impact of these glaucoma surgeries on patient-reported function.
Visual acuity improved to baseline days to weeks before the observed plateaus in VAS scores. By POW1, no significant difference in logMAR VA from baseline remained for either CE or trabeculectomy patients, and by POW2, the same was true for tube shunt patients. Thus, while reduced acuity was associated with reduced VAS function scores in the first post-operative month, our data support the idea that reaching baseline VA on a Snellen chart does not indicate full functional recovery. Providers could use this information to improve patient safety as they counsel post-operative patients returning to driving and other activities. Similarly, clinical trialists evaluating techniques aimed at shortening recovery times, like microinvasive glaucoma surgery, should look beyond VA to demonstrate recovery.
Post-operative pain improved uniformly across surgery types and, like VA, returned to baseline before VAS function scores. Across the study period, pain was associated with functional impairment – VAS function scores fell by 0.66 for every 1-point increase in pain score – but in contrast to functional recovery, self-reported pain among those recovering from all three surgery types was minimal beyond POW2. This aligns with and builds upon published literature reporting early resolution of pain after CE, demonstrating similar trends for glaucoma surgery.8,9,25 In the context of our data, it further suggests that improvement in pain, like improvement in VA, cannot serve as a surrogate for functional surgical recovery.
This is the first time that use of a VAS for function has been reported in ophthalmology, and extends the experience of investigators in fields like rheumatology, where authors have noted that VAS scores for function, pain, and fatigue are correlated and have described responsiveness of non-pain VAS.21,26,27 Importantly, this is also the first description of a patient-reported measure of post-operative recovery for ophthalmic surgery. Among a handful of measures of recovery from in-patient surgery under general anesthesia, the well-validated QoR (“quality of recovery”)-40 has been adapted for same-day outpatient surgery,28,29 but remains too long for use in post-operative eyecare visits, requiring 5–7 minutes to administer.30,31 Good convergent validity has been documented between the QoR-40 and a VAS like ours, suggesting that an easilyadministered VAS may also meaningfully capture recovery, addressing an unmet need in the field of ophthalmic surgery.30
The primary limitation of this study is our inability to demonstrate the convergent validity of a VAS for patient self-reported function by comparing it to measured function. The diary-style questionnaire described here represents part of a larger study of recovery from ophthalmic surgery (CORES) and is designed to complement a comprehensive evaluation of patient post-operative function, including reading speed and comprehension, gait and balance, timed IADLs, physical activity and travel away from home. Those data will allow more robust validation of this instrument in the future. Our sample size is also fairly small, such that we could not examine the effect of better- vs. worse-eye surgery, and relationships between VAS function scores and individual IADLs, as well as some trends towards between-group differences, like higher pain scores following tube shunt insertion, did not reach statistical significance. We expect that larger future studies will clarify these findings, and that broader recruitment may address cultural bias potentially introduced by limiting our population to fluent English speakers. Finally, we must acknowledge that the widely-recognized ceiling effect affecting the VAS pain scale,32 along with divergent expectations among patients undergoing elective CE versus required glaucoma surgery (the former may find post-operative limitations more frustrating) could attenuate observations made using our VAS function scale.
VAS function scores in our study population suggest important differences in speed and length of functional recovery between CE, trabeculectomy and tube shunt insertion. Understanding how functional recovery is affected by procedure type and other factors will equip us to better counsel patients regarding the operation best suited for them and how they may need to adjust their lives around the time of surgery, as well as to better evaluate emerging therapies. Function is directly assessable as a combination of abilities like driving, walking, reading, working and performing instrumental activities of daily living (IADLs), but measuring these requires substantial time and effort, limiting their practicality for research or clinical care. A VAS, well-validated for capturing pain, offers an efficient alternative for capturing these complex experiences in eye surgery patients, with potential implications for both practice and clinical trial design.
Supplementary Material
(a). Funding:
Supported by National Institutes of Health Grant No. 5K12EY015025.
APPENDIX:


Diary Questionnaire. Baseline and POD 1
Footnotes
(b) Financial Disclosures: The authors have made the following disclosures:
AKB: NIH (R), Research to Prevent Blindness (R), W.L. Gore & Associates, Inc. (C)
AM: None
CZ: None
MSK: None
NN: None
AH: None
SC: None
JD: None
PYR: NIH (R); W.L. Gore & Associates, Inc. (C), Aerie Pharmaceuticals (C), Ivantis (C), Harkcon (C)
Publisher's Disclaimer: This is a PDF file of an unedited manuscript that has been accepted for publication. As a service to our customers we are providing this early version of the manuscript. The manuscript will undergo copyediting, typesetting, and review of the resulting proof before it is published in its final form. Please note that during the production process errors may be discovered which could affect the content, and all legal disclaimers that apply to the journal pertain.
REFERENCES
- 1.Hall MJ, Schwartzman A, Zhang J, Liu X. Ambulatory surgery data from hospitals and ambulatory surgery centers: United States, 2010. Natl Health Stat Report. 2017. [PubMed] [Google Scholar]
- 2.MarketScope. 2017 Cataract Surgical Equipment Report: A Global Market Analysis for 2016–2022; 2017.
- 3.Gedde SJ, Schiffman JC, Feuer WJ, Herndon LW, Brandt JD, Budenz DL. Treatment Outcomes in the Tube Versus Trabeculectomy (TVT) Study After Five Years of Follow-up. Am J Ophthalmol. 2012;153(5):789–803.e2. doi: 10.1016/j.ajo.2011.10.026 [DOI] [PMC free article] [PubMed] [Google Scholar]
- 4.Gedde SJ, Feuer WJ, Shi W, et al. Treatment Outcomes in the Primary Tube Versus Trabeculectomy Study after 1 Year of Follow-up. Ophthalmology. 2018;125(5):650–663. doi: 10.1016/j.ophtha.2018.02.003 [DOI] [PubMed] [Google Scholar]
- 5.Bressler NM, Beaulieu WT, Glassman AR, et al. Persistent Macular Thickening Following Intravitreous Aflibercept, Bevacizumab, or Ranibizumab for CentralInvolved Diabetic Macular Edema With Vision Impairment. JAMA Ophthalmol. 2018;136(3):257. doi: 10.1001/jamaophthalmol.2017.6565 [DOI] [PMC free article] [PubMed] [Google Scholar]
- 6.Mannis MJ, Holland EJ, Gal RL, et al. The Effect of Donor Age on Penetrating Keratoplasty for Endothelial Disease. Ophthalmology. 2013;120(12):2419–2427. doi: 10.1016/j.ophtha.2013.08.026 [DOI] [PMC free article] [PubMed] [Google Scholar]
- 7.Tan JHY, Newman DK, Klunker C, Watts SE, Burton RL. Phacoemulsification cataract surgery: Is routine review necessary on the first post-operative day? Eye. 2000;14(1):53–55. doi: 10.1038/eye.2000.11 [DOI] [PubMed] [Google Scholar]
- 8.Porela-Tiihonen S, Kokki H, Kaarniranta K, Kokki M. Recovery after cataract surgery. Acta Ophthalmol. 2016;94(A2):1–34. doi: 10.1111/aos.13055 [DOI] [PubMed] [Google Scholar]
- 9.Dell SJ, Hovanesian JA, Raizman MB, et al. Randomized comparison of postoperative use of hydrogel ocular bandage and collagen corneal shield for wound protection and patient tolerability after cataract surgery. J Cataract Refract Surg. 2011;37(1):113–121. doi: 10.1016/j.jcrs.2010.11.001 [DOI] [PubMed] [Google Scholar]
- 10.Gedde SJ, Feuer WJ, Lim KS, et al. Treatment Outcomes in the Primary Tube Versus Trabeculectomy Study after 3 Years of Follow-up. Ophthalmology. 2020;127(3):333–345. doi: 10.1016/j.ophtha.2019.10.002 [DOI] [PubMed] [Google Scholar]
- 11.Sun~er IJ, Kokame GT, Yu E, Ward J, Dolan C, Bressler NM. Responsiveness of NEI VFQ-25 to Changes in Visual Acuity in Neovascular AMD: Validation Studies from Two Phase 3 Clinical Trials. Investig Opthalmology Vis Sci. 2009;50(8):3629. doi: 10.1167/iovs.08-3225 [DOI] [PubMed] [Google Scholar]
- 12.Kotecha A, Feuer WJ, Barton K, Gedde SJ. Quality of Life in the Tube Versus Trabeculectomy Study. Am J Ophthalmol. 2017;176:228–235. doi: 10.1016/j.ajo.2017.01.019 [DOI] [PubMed] [Google Scholar]
- 13.McAlinden C, Gothwal VK, Khadka J, Wright TA, Lamoureux EL, Pesudovs K. A head-to-head comparison of 16 cataract surgery outcome questionnaires. Ophthalmology. 2011;118(12):2374–2381. doi: 10.1016/j.ophtha.2011.06.008 [DOI] [PubMed] [Google Scholar]
- 14.Lundstrom M, Roos P, Jensen S, Fregell G. Catquest questionnaire for use in cataract surgery care: Description, validity, and reliability. J Cataract Refract Surg. 1997;23(8):1226–1236. doi: 10.1016/S0886-3350(97)80321-5 [DOI] [PubMed] [Google Scholar]
- 15.Michaelson J, Mahony S, Schifferes J. Measuring Well-Being: A Guide for Practitioners. London: The New Economics Foundation; 2012. https://b.3cdn.net/nefoundation/8d92cf44e70b3d16e6_rgm6bpd3i.pdf. [Google Scholar]
- 16.Chou R, Gordon DB, de Leon-Casasola OA, et al. Management of Postoperative Pain: A Clinical Practice Guideline From the American Pain Society, the American Society of Regional Anesthesia and Pain Medicine, and the American Society of Anesthesiologists’ Committee on Regional Anesthesia, Executive Commi. J Pain. 2016;17(2):131–157. doi: 10.1016/j.jpain.2015.12.008 [DOI] [PubMed] [Google Scholar]
- 17.Reed MD, Van Nostran W. Assessing pain intensity with the visual analog scale: A plea for uniformity. J Clin Pharmacol. 2014;54(3):241–244. doi: 10.1002/jcph.250 [DOI] [PubMed] [Google Scholar]
- 18.Olsen MF, Bjerre E, Hansen MD, et al. Pain relief that matters to patients: Systematic review of empirical studies assessing the minimum clinically important difference in acute pain. BMC Med. 2017. doi: 10.1186/s12916-016-0775-3 [DOI] [PMC free article] [PubMed] [Google Scholar]
- 19.Myles PS, Myles DB, Galagher W, et al. Measuring acute postoperative pain using the visual analog scale: The minimal clinically important difference and patient acceptable symptom state. Br J Anaesth. 2017. doi: 10.1093/bja/aew466 [DOI] [PubMed] [Google Scholar]
- 20.Kersten P, White PJ, Tennant A. Is the pain visual analogue scale linear and responsive to change? An exploration using rasch analysis. PLoS One. 2014;9(6). doi: 10.1371/journal.pone.0099485 [DOI] [PMC free article] [PubMed] [Google Scholar]
- 21.Kersten P, White PJ, Tennant A. The Visual Analogue WOMAC 3.0 scale - internal validity and responsiveness of the VAS version. BMC Musculoskelet Disord. 2010;11(1):80. doi: 10.1186/1471-2474-11-80 [DOI] [PMC free article] [PubMed] [Google Scholar]
- 22.Uusitalo RJ, Brans T, Pessi T, Tarkkanen A. Evaluating cataract surgery gains by assessing patients’ quality of life using the VF-7. J Cataract Refract Surg. 1999;25(7):989–994. doi: 10.1016/S0886-3350(99)00082-6 [DOI] [PubMed] [Google Scholar]
- 23.Arora KS, Boland MV., Friedman DS, Jefferys JL, West SK, Ramulu PY. The Relationship between Better-Eye and Integrated Visual Field Mean Deviation and Visual Disability. Ophthalmology. 2013;120(12):2476–2484. doi: 10.1016/j.ophtha.2013.07.020 [DOI] [PMC free article] [PubMed] [Google Scholar]
- 24.Ramulu PY, Maul E, Hochberg C, Chan ES, Ferrucci L, Friedman DS. Real-World Assessment of Physical Activity in Glaucoma Using an Accelerometer. Ophthalmology. 2012;119(6):1159–1166. doi: 10.1016/j.ophtha.2012.01.013 [DOI] [PMC free article] [PubMed] [Google Scholar]
- 25.Walters TR, Goldberg DF, Peace JH, Gow JA. Bromfenac ophthalmic solution 0.07% dosed once daily for cataract surgery: Results of 2 randomized controlled trials. Ophthalmology. 2014;121(1):25–33. doi: 10.1016/j.ophtha.2013.07.006 [DOI] [PubMed] [Google Scholar]
- 26.Wolpe RE, Queiroz APA, Zomkowski K, Sperandio FF. Psychometric properties of the Female Sexual Function Index in the visual analogue scale format. Sex Health. 2017;14(3):213–220. doi: 10.1071/SH16131 [DOI] [PubMed] [Google Scholar]
- 27.Levy O, Amit-Vazina M, Segal R, Tishler M. Visual Analogue Scales of Pain, Fatigue and Function in Patients with Various Rheumatic Disorders Receiving Standard Care. Isr Med Assoc J. 2015;17(11):691–696. http://www.ncbi.nlm.nih.gov/pubmed/26757566. [PubMed] [Google Scholar]
- 28.Myles PS. Measuring quality of recovery in perioperative clinical trials. Curr Opin Anaesthesiol. 2018;31(4):396–401. doi: 10.1097/ACO.0000000000000612 [DOI] [PubMed] [Google Scholar]
- 29.IDVALL E, BERG K, UNOSSON M, BRUDIN L, NILSSON U. Assessment of recovery after day surgery using a modified version of quality of recovery-40. Acta Anaesthesiol Scand. 2009;53(5):673–677. doi: 10.1111/j.1399-6576.2009.01914.x [DOI] [PubMed] [Google Scholar]
- 30.Myles PS, Weitkamp B, Jones K, Melick J, Hensen S. Validity and reliability of a postoperative quality of recovery score: the QoR-40. Br J Anaesth. 2000;84(1):11–15. doi: 10.1093/oxfordjournals.bja.a013366 [DOI] [PubMed] [Google Scholar]
- 31.Gornall BF, Myles PS, Smith CL, et al. Measurement of quality of recovery using the QoR-40: a quantitative systematic review. Br J Anaesth. 2013;111(2):161–169. doi: 10.1093/bja/aet014 [DOI] [PubMed] [Google Scholar]
- 32.González-Fernández M, Ghosh N, Ellison T, McLeod JC, Pelletier CA, Williams K. Moving beyond the limitations of the visual analog scale for measuring pain: Novel use of the general labeled magnitude scale in a clinical setting. Am J Phys Med Rehabil. 2014. doi: 10.1097/PHM.0b013e31829e76f7 [DOI] [PubMed] [Google Scholar]
Associated Data
This section collects any data citations, data availability statements, or supplementary materials included in this article.