
Figure 1.
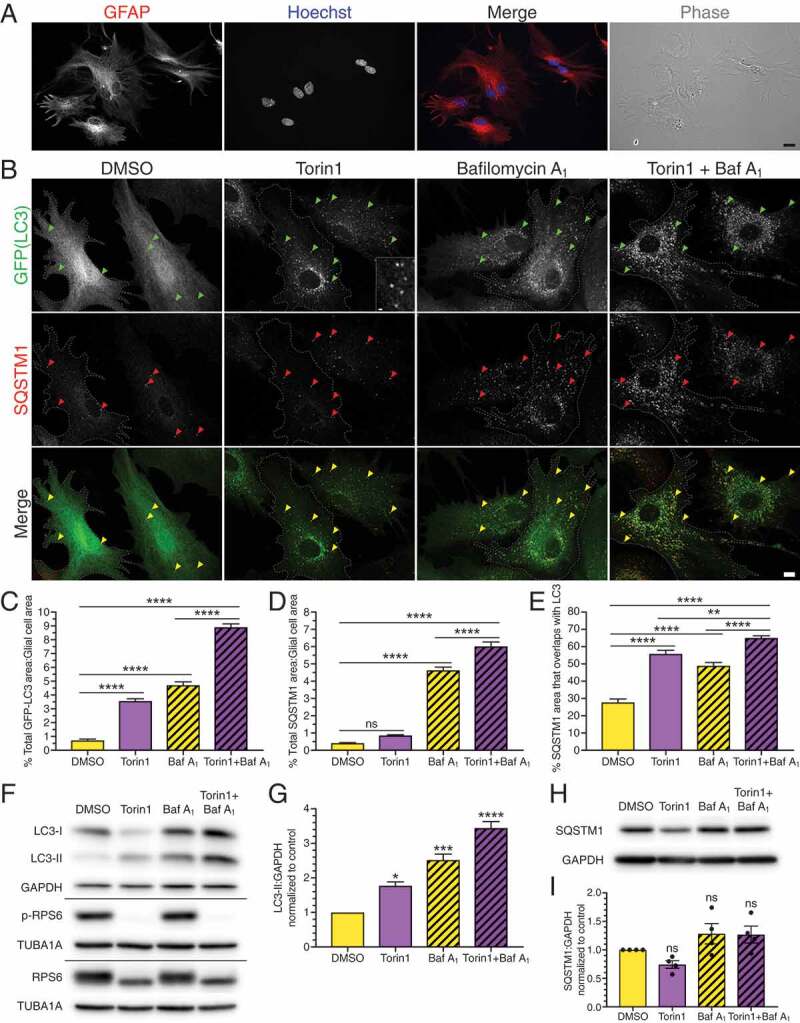
Inhibition of MTOR activates SQSTM1-mediated selective autophagy in primary astrocytes. (A) Immunostaining analysis and phase image of primary mouse cortical glia enriched for astrocytes (GFAP; astrocyte-specific marker). Bar: 20 µm. (B) Maximum projections of z-stacks of GFP-LC3 transgenic astrocytes treated with the MTOR inhibitor torin1 for 4 h and immunostained for GFP and SQSTM1. Arrowheads denote puncta co-positive for GFP-LC3 and SQSTM1. Outlines define cell boundaries. Bar: 10 µm. Inset bar: 1 µm. (C) Quantification of total GFP-LC3 puncta area normalized to cell area of astrocytes treated with torin1 for 4 h (mean ± SEM; one-way ANOVA with Tukey’s post hoc test; n = 54–96 cells from 3 independent experiments, 5–7 DIV). (D) Quantification of total SQSTM1 puncta area normalized to cell area of astrocytes treated with torin1 for 4 h (mean ± SEM; one-way ANOVA with Tukey’s post hoc test; n = 64–94 cells from 3 independent experiments, 5–7 DIV). (E) Quantification of the percentage of SQSTM1 puncta area that overlaps with GFP-LC3 puncta area in astrocytes treated with torin1 for 4 h (mean ± SEM; one-way ANOVA with Tukey’s post hoc test; n = 53–82 cells from 3 independent experiments, 5–7 DIV cells). (F and G) Immunoblot analysis and corresponding quantification of lysates generated from glia treated for 4 h with torin1. (F) GAPDH and TUBA1A/α-tubulin serve as loading controls; horizontal lines designate individual blots. (G) LC3-II levels were normalized to GAPDH (mean ± SEM; one-way ANOVA with Dunnett’s post hoc test; n = 3 independent experiments, each experiment was performed with technical replicates, 3–6 DIV). (H and I) Immunoblot analysis and quantification of SQSTM1 levels in glia treated with torin1. SQSTM1 levels were normalized to GAPDH (mean ± SEM; one-way ANOVA with Dunnett’s post hoc test; n = 4 independent experiments, 6–8 DIV). Baf A1, bafilomycin A1.