
Figure 3.
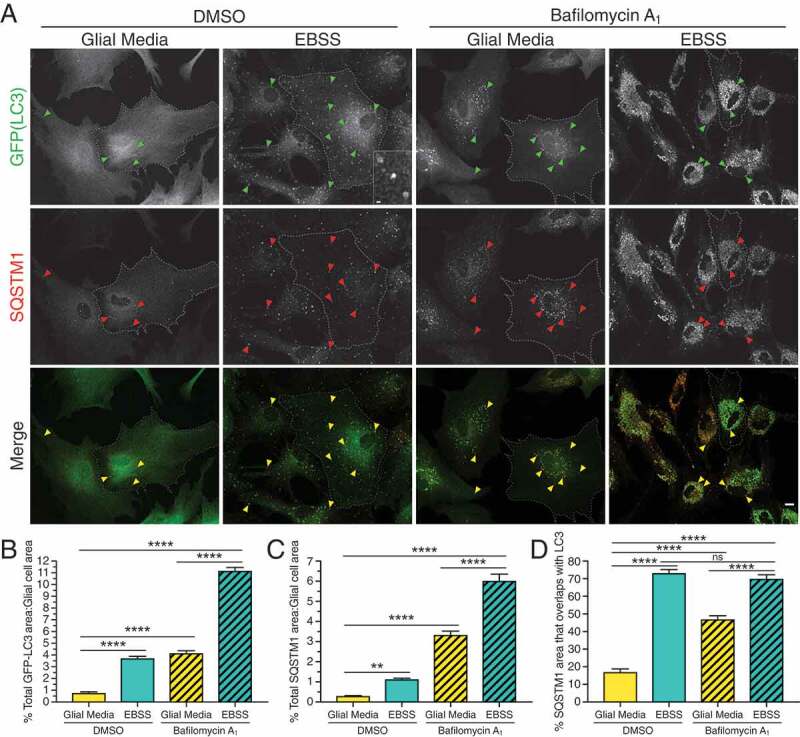
Starvation in EBSS activates autophagy in primary astrocytes. (A) Maximum projections of Z-stacks of GFP-LC3 transgenic astrocytes starved in EBSS for 4 h and immunostained for GFP and SQSTM1. Arrowheads denote puncta co-positive for GFP-LC3 and SQSTM1. Outlines define cell boundaries. Bar: 10 µm. Inset bar: 1 µm. (B) Quantification of total GFP-LC3 puncta area normalized to cell area of astrocytes starved in EBSS for 4 h (mean ± SEM; one-way ANOVA with Tukey’s post hoc test; n = 65–91 cells from 3 independent experiments, 4–5 DIV). (C) Quantification of total SQSTM1 puncta area normalized to cell area of astrocytes starved in EBSS for 4 h (mean ± SEM; one-way ANOVA with Tukey’s post hoc test; n = 48–61 cells from 3 independent experiments, 4–5 DIV). (D) Quantification of the percentage of SQSTM1 puncta area that overlaps with GFP-LC3 puncta area in astrocytes starved in EBSS for 4 h (mean ± SEM; one-way ANOVA with Tukey’s post hoc test; n = 25–39 cells from 3 independent experiments, 4–5 DIV).