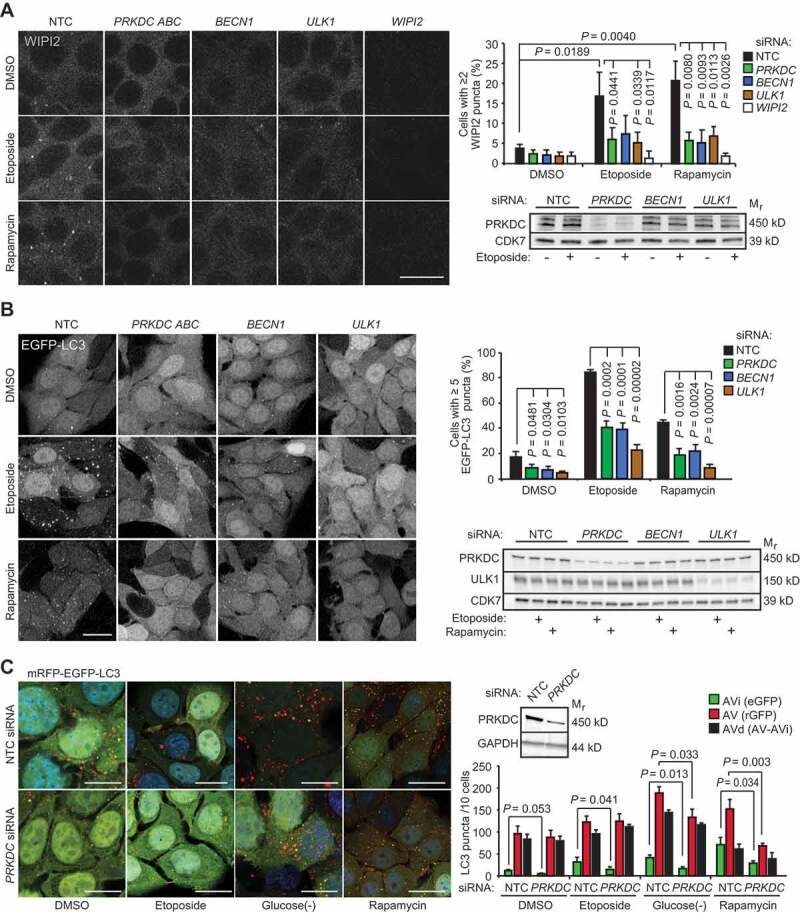
Figure 2.

PRKDC depletion inhibits phagophore formation independent of MTORC1. (A) MCF7 cells transfected with indicated siRNAs for 75 h were treated with DMSO or 50 µM etoposide for the last 15 h or 10 nM rapamycin for the last 2 h. Representative confocal images of WIPI2 puncta (left), mean percentages of cells with ≥ 2 WIPI2 puncta (right, top), and immunoblots of indicated proteins (right, bottom) are shown. (B) MCF7-EGFP-LC3 cells were transfected and treated as in (a). Representative confocal images of EGFP puncta (left), mean percentages of cells with ≥ 5 EGFP-LC3 puncta (right, top), and immunoblots of indicated proteins (right, bottom) are shown. (C) MCF7-mRFP-EGFP-LC3 cells transfected with indicated siRNAs for 72 h were treated with DMSO or 50 µM etoposide for the last 15 h, or starved for glucose or treated with 100 nM rapamycin for the last 2 h. Representative confocal images (left) and quantification of initial (AVi), all (AV) and degradative (AVd) autophagic membranes (right) are show. For single-channel confocal images, see Figure S2C. Error bars, SD of ≥ 3 independent experiments with > 50 randomly chosen cells analyzed in each sample. P-values were calculated by 2-tailed, homoscedastic student’s t-test. Scale bars: 10 µm.
