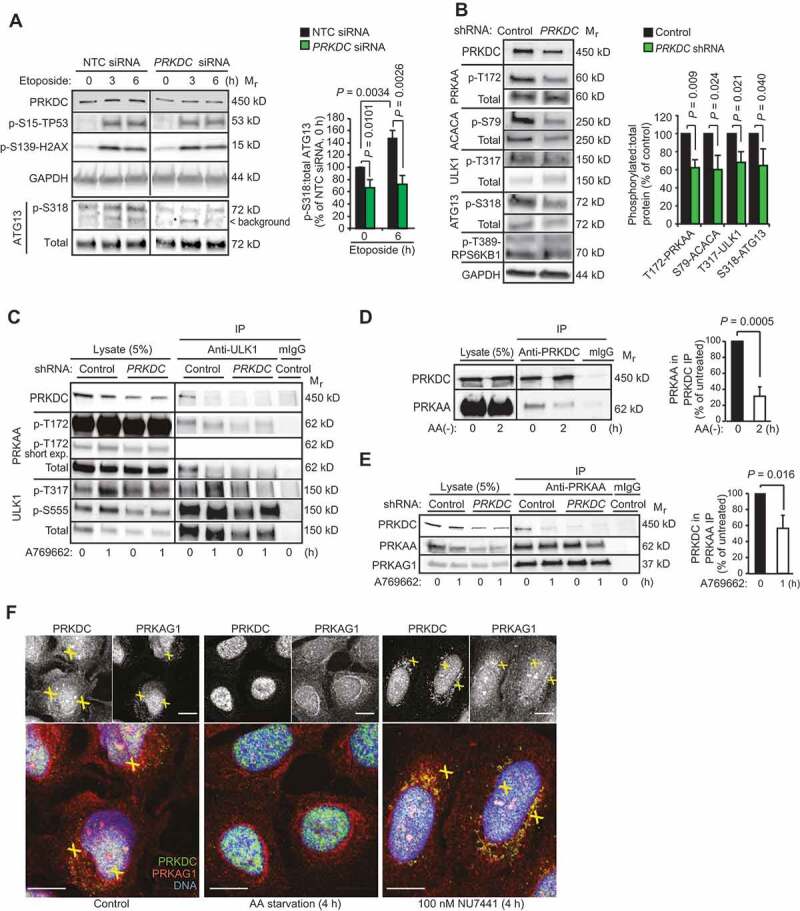
Figure 3.

PRKDC regulates AMPK-ULK1 signaling pathway. (A) Representative immunoblots (left) and densitometric quantification of indicated proteins (right) in lysates of MCF7 cell transfected with indicated siRNAs for 75 h and treated with 50 µM etoposide for the 0–6 h. (B) Representative immunoblots of indicated proteins from lysates of U2OS-control and U2OS-PRKDC shRNA cells (left) and densitometric quantification of indicated phospho-protein/total protein ratios (right). (C) Immunoprecipitation (IP) of endogenous ULK1 complexes from lysates of control and PRKDC shRNA-infected U2OS cells treated with DMSO (0) or 1 µM A769662 for 1 h (1). (D) Representative immunoblots of IPs of endogenous PRKDC complexes from lysates of U2OS cells grown in complete media (0) or starved for amino acids for 2 h (2) (left) and densitometric quantification of co-precipitating PRKAA1 (right). (E) Representative immunoblots of IPs of PRKAA1 complexes from lysates of control and PRKDC shRNA-infected U2OS cells treated with DMSO (0) or 769662 for 1 h (1) (left) and densitometric quantification of co-precipitating PRKDC (right). (F) Representative confocal images of MCF7 cells grown in complete medium, starved for amino acids or treated with 100 nM NU7441 for 4 h, fixed with paraformaldehyde and stained for endogenous PRKDC (green), PRKAG1 (red) and DNA (Hoechst, blue). Yellow crosses indicate co-localization of the proteins in the cytoplasm and nucleus, respectively. Scale bar: 10 µm. Error bars, SD of ≥ 3 independent experiments. P-values were calculated by 2-tailed, homoscedastic student’s t-test.
