

ABSTRACT
Significant evidences indicate that reactive oxygen species (ROS) can induce macroautophagy/autophagy under both physiological and pathological conditions. Although the relationship between ROS and autophagy regulation has been well studied, the basic mechanism by which ROS affects autophagy and the biological role of this regulation are still not fully understood. In the present study we show that multiple MiT-TFE transcription factors including TFEB, TFE3 and MITF, which are master regulators of autophagy and lysosomal biogenesis, can be activated upon direct cysteine oxidation by ROS. Oxidation promotes the nuclear translocation of these MiT-TFE transcription factors by inhibiting the association of them with RRAG GTPases, which in turn leads to enhanced global gene expression level in autophagy-lysosome system. Our study highlights the role of oxidation of MiT-TFE transcription factors in ROS-linked autophagy, and provides novel mechanism that MiT-TFE transcription factors-mediated transcriptional control of autophagy may govern cell homeostasis in response to oxidative stress, a biological process tightly linked to human diseases including neurodegenerative diseases and cancer.
Abbreviations
Bafi A1: bafilomycin A1; EBSS: Earle’s balanced salt solution; EGFP: enhanced green fluorescent protein; GAPDH: glyceraldehyde-3-phosphate dehydrogenase; MAP1LC3B/LC3B: microtubule associated protein 1 light chain 3 beta; MTORC1: mechanistic target of rapamycin kinase complex 1; ROS: reactive oxygen species; RPS6KB/p70S6K: ribosomal protein S6 kinase B; TFEB: transcription factor EB; WT: wild type.
KEYWORDS: Autophagy, MTORC1, oxidation, RRAG GTPases, TFEB
Introduction
It has been well known that oxidative stress, which occurs in response to reactive oxygen species (ROS), is widely implicated in aging and human diseases including cancer and neurodegenerative diseases [1,2]. ROS includes hydrogen peroxide (H2O2), which is rapidly produced as a second messenger under various stimuli, is a byproduct of mitochondrial respiration in eukaryotic cells. Increasing evidence suggests that there may be an important link between ROS-induced oxidative stress and abnormal accumulation of misfolded proteins associated with neurodegeneration [2]. However, the detailed molecular mechanism underlying this linkage remains elusive.
Macroautophagy/autophagy is an essential lysosomal degradation system in cells, which plays an important role in the quality control of intracellular organelles and proteins [3]. Multiple steps are involved in autophagic degradation of substrates, including phagophore formation (autophagy initiation), autophagosome maturation and fusion with the lysosome [3,4]. Notably, neuronal cells are vulnerable to defective autophagy, particularly in the aging process. Relevant to this, mutations of proteins in autophagy-lysosome system can lead to neurodegenerative disorders including amyotrophic lateral sclerosis (ALS) and Parkinson disease (PD) [4,5], the key feature of which is aggregation of misfolded proteins [6].
The Microphthalmia family of bHLH-LZ transcription factors (MiT-TFE) belong to the helix-loop-helix leucine-zipper family, which includes TFEB (transcription factor EB), TFE3, TFEC and MITF. Recent studies have shown that these transcription factors control the global gene expression in autophagy-lysosome system, therefore function as the master regulators of autophagosomal and lysosomal biogenesis [7–9]. The activity and cellular localization of TFEB, TFE3 and MITF are strongly regulated by mechanistic target of rapamycin complex 1 (MTORC1), a nutrient sensor associated with RRAG GTPases and RAGulator which localizes on lysosomal surface [10–13]. According to recent studies, TFEB, TFE3 and MITF are phosphorylated by MTOR (mechanistic target of rapamycin kinase) and then binds to YWHA/14-3-3 in the cytosol, whereas dephosphorylated TFEB, TFE3 and MITF will translocate into the nucleus from where it can increase autophagosomal and lysosomal gene expression, and thereby enhance autophagy and lysosomal biogenesis [10–13].
Here we show that multiple MiT-TFE transcription factors, including TFEB, TFE3 and MITF, are direct targets of ROS. ROS can induce a rapid nuclear translocation of TFEB, TFE3 and MITF by blocking the interaction between these MiT-TFE transcription factors and RRAG GTPases. Mechanistically, ROS-dependent TFEB fast nuclear translocation could occur due to oxidation of TFEB on C212, without inhibiting the activity MTORC1. In summary, the present study reveals a significant role of TFEB oxidation in altered autophagy and lysosomal biogenesis in response to oxidative stress, which is strongly associated with human diseases such as neurodegeneration.
Results
Rapid nuclear translocation of TFEB induced by ROS
Previous studies showed TFEB is a nucleocytoplasmic shuttling protein and phosphorylated TFEB is captured by YWHA thus remains in the cytosol. Given that TFEB could translocate into the nucleus under numerous of cellular stress, we wondered whether oxidative stress induced by ROS could affect nucleocytoplasmic shuttling of TFEB. Firstly, we treated the cells with torin 1 (MTOR inhibitor), EBSS (starvation) and H2O2 (ROS). Because active MTORC1 inhibits TFEB nuclear translocation through phosphorylation of TFEB, inhibition of MTOR activity by torin 1 could abolish the association of TFEB with YWHA, thus result in translocation of TFEB to both nucleus and lysosomes [11–13] (Figure 1A and S1A). Under starvation condition, inhibition of RRAG GTPase activity leads to a decreased phosphorylation and nuclear transportation of TFEB (Figure 1A). Interestingly, we found after we treated the cells with different concentrations of H2O2, TFEB translocated into the nucleus rapidly within 8 min, (Figure 1A, exogenous TFEB under 1 mM H2O2 treatment; Fig. S1A, endogenous TFEB under 200 μM H2O2 treatment) whereas it showed significant nuclear localization after 1 h during EBSS and torin 1 treatments (Figure 1A and S1A). Nuclear-cytoplasmic fractionation experiment confirmed that H2O2-induced fast nuclear translocation of TFEB under various concentrations (Figure 1B,C). We next performed time-lapse imaging experiment to chase the nuclear translocation under different treatments. H2O2 treatment induced a faster translocation of TFEB to the nucleus, compared with EBSS and torin 1 treatment (Figure 1D, quantitative data; Fig. E, live cell imaging). In addition, other ROS generators, including menadione and 4NQO, displayed similar effect as H2O2 treatment on TFEB nuclear translocation (Fig. S1B). Taken together, these data suggest that TFEB nucleocytoplasmic shuttling is very dynamic and cellular ROS can induce fast nuclear translocation of TFEB.
Figure 1.
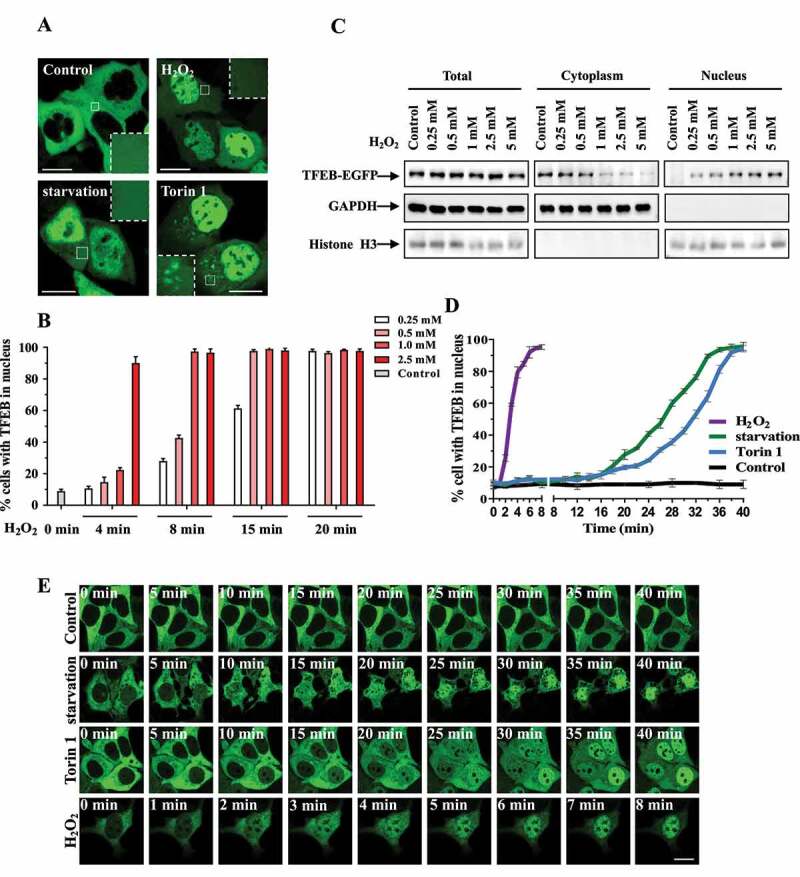
H2O2 induces rapid nuclear translocation of TFEB. (A) HEK293 cells were transfected with EGFP-tagged TFEB for 24 h, and then were treated with 1 mM H2O2 for 8 min, 250 nM torin 1 for 1 h or Earle’s balanced salt solution (EBSS) for 1 h. The cells were visualized using confocal microscope. Scale bars: 10 µm. (B) HEK293 cells were transfected with EGFP-tagged TFEB for 24 h. The cells were treated with different doses of H2O2 for indicated time. The quantification data of TFEB nuclear localization are shown as bar graph. Data from three independent experiments were represented as means ± S.E.M. (C) This figure is related to (B) but focuses on 8 min H2O2 treatment. HEK293 cells were transfected with TFEB-EGFP, and then the cells were treated with different doses of H2O2 for 8 min. The cell lysates were separated to cytoplasmic and nuclear fractions. Total cell lysates and nuclear fractions were subjected to immunoblot with indicated antibodies. (D) HEK293 cells were similarly transfected and treated as in (A). The percentages of cells with TFEB nuclear localization were counted and quantified during different time. Data from three independent experiments were represented as means ± S.E.M. (E) This figure is related to (D). The cells were transfected and treated as in (A) and were visualized by live cell imaging to chase the translocation of EGFP-tagged TFEB. Scale bar: 10 µm.
Cysteine 212 residue of TFEB is prone to oxidation upon exposure to H2O2
Give that TFEB can translocate into the nucleus rapidly, we reasoned that if H2O2 could induce a faster translocation than MTORC1 inhibition did, then TFEB should be a direct target of H2O2. One possible mechanism is the direct biochemical modification of TFEB occurs during short-term H2O2 treatment, and it blocks the signaling which retains TFEB in the cytosol. To this end, we did the sequence alignment of TFEB homologs in different species and identified a specific cysteine residue that is highly conserved across various species, cysteine 212, the only cysteine that exists in human TFEB (Figure 2A). Because the thiol side chain in cysteine is susceptible of oxidation, we speculated the oxidation of this cysteine residue is responsible for the nuclear translocation of TFEB under H2O2 treatment. To test our hypothesis, we constructed TFEB mutant with mutation of cysteine to alanine (C212A) and performed cell biology and biochemical experiments as in Figure 1. Our results showed that wild-type TFEB translocated into the nucleus rapidly upon exposure to H2O2. In contrast, TFEBC212A failed to translocate into the nucleus in cells exposed to H2O2 within the same time (Figure 2B). To confirm our results, we did the time-lapse imaging experiments and found that TFEB rapidly translocated into the nucleus from cytosol in H2O2-treated cells during 8 min period, but TFEBC212A still localized in cytoplasm (Figure 2C,D). To further compare the nuclear transportation between WT and TFEBC212A under different conditions, we treated cells expressing TFEB with torin 1, EBSS or H2O2 within a short period (8 min). Our results show that addition of H2O2, but not torin 1 or EBSS alone, could induce TFEB nuclear translocation within short-term treatments. Meanwhile, TFEBC212A retains to localize in the cytosol (Figure 2E,F). Note that short term treatment of torin 1 or EBSS did not decrease MTORC1 activity as longer term treatment did (Fig. S2A), and long term treatment of torin 1 or EBSS induces the nuclear translocation and decreases the phosphorylation of both WT and TFEBC212A (Fig. S2 B, D and E). Therefore, we speculate that H2O2 treatment has “combined effects” in which TFEB (C212) oxidation and MTORC1 signaling cooperate together to regulate TFEB, and the oxidation of TFEB on C212 can contribute to the activation of TFEB under ROS. According to the previous studies, dephosphorylated TFEB exhibits faster gel migration rate than phosphorylated TFEB [12–14]. As shown in Fig. S2C, H2O2 treatment increased the migration rate of wild type, but not TFEBC212A in TFEB stable cell lines when we performed immunblot experiments using low concentration gel to separate proteins, indicating that the conversion of cysteine 212 to alanine in TFEB results in a loss of phosphorylation of TFEB during H2O2 treatment. To further confirm TFEB cysteine directly undergoes oxidation in response to oxidative stress, we performed biochemical assay using Biotin labeling and our results showed marked oxidized TFEB species following H2O2 treatment, but not torin 1 or starvation treatment (Figure 2G). Notably, oxidized TFEB disappeared when C211 residue was mutated in cells and in vitro upon exposure to H2O2 (Figure 2H,I), indicating C211 residue is the ROS-driven oxidation site on TFEB.
Figure 2.
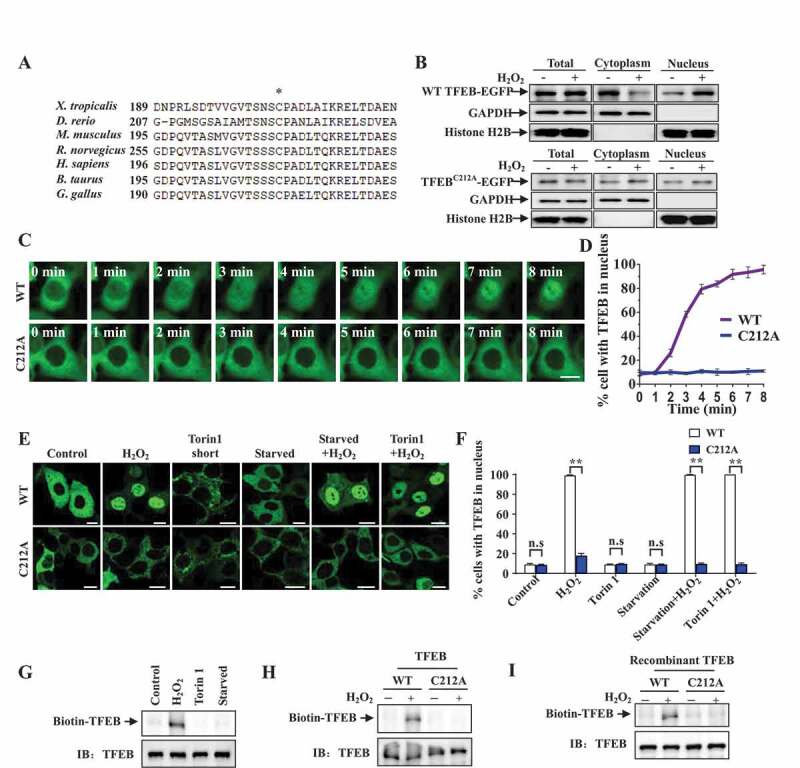
Cysteine 212 residue of TFEB is oxidized by H2O2 correlation with of TFEB nuclear localization. (A) Sequence alignment of TFEB homologs across different species. Asterisk indicates the cysteine residue which is evolutionarily conserved. (B) HEK293 cells were transfected with WT or mutant TFEBC212A. Twenty-four hours later, the cells were treated with 1 mM H2O2 for 8 min. Then the cells lysates were subjected to subcellular fractionation experiment. The separated fractions were used to immunoblot analysis with antibodies. (C) HEK293 cells were transfected with EGFP-tagged WT or mutant TFEBC212A. After 24 h, the cells were incubated with H2O2 and visualized immediately under confocal microscope for time-lapse experiment. Scale bar: 10 µm. (D) The percentages of WT and mutant TFEBC212A nuclear localization were counted and quantified. Data from three independent experiments were represented as means ± S.E.M. (E) HEK293 cells were transfected with EGFP-tagged WT or mutant TFEBC212A for 24 h. Then the cells were treated with 1 mM H2O2, 250 nM torin 1, EBSS or combination of H2O2 with EBSS or torin 1 for 8 min (short-term treatment). Starved means starvation (EBSS treatment). Then the cells were observed using confocal microscopy. Scale bars: 10 µm. (F) Quantitative data from d were shown in a bar graph. Data from three independent experiments were represented as means ± S.E.M., n.s, not significantly different; **, p < 0.01, one-way ANOVA. (G-H) HEK293 cells were transfected with EGFP-tagged WT or mutant TFEBC212A for 24 h, then the cells were treated with 1 mM H2O2 for 8 min. The cell lysates were subjected to the biochemical analysis of cysteine oxidation using biotin labeling. (I) His tagged WT and mutant TFEBC212A were expressed in E. coli and purified by His binding resin. The purified proteins were then subjected to the analysis of cysteine oxidation as described in Materials and Methods.
Multiple MiT/TFE transcription factors display rapid nuclear translocation under oxidative stress
TFE3 and MITF, which belong to the transcription factor E/microphthalmia transcription factors, share high sequence similarity with TFEB, are similarly associated with autophagy activation and lysosomal biogenesis as TFEB [9,12,13]. In our sequence alignment analysis, we observed a high degree of homology around the human TFEB (C212) oxidation site among TFEB and other MiT-TFE family members, including TFE3, MITF (isoform A2) and TFEC. As shown in Figure 3A, C212, C322, C281 and C116 are highly conserved in TFEB, TFE3, MITF and TFEC, respectively, suggesting that these homologs of TFEB might be oxidized and regulated in a similar manner. To investigate whether TFE3 and MITF could also translocate into the nucleus from the cytoplasm in cells exposed to H2O2, we treated TFE3- or MITF-expressing cells with H2O2 and examined the cellular localization of MITF and TFE3. We observed that ROS would lead to a fast nuclear transport of TFE3 and MITF (Figure 3B,C). We next used site-directed mutagenesis to generate TFE3C322A and MITFC281A, and our results showed that TFE3C322A and MITFC281A fail to translocate into the nucleus in H2O2-treated cells (Figure 4), suggesting that MiT/TFE transcription factors are similarly oxidized and regulated by ROS.
Figure 3.
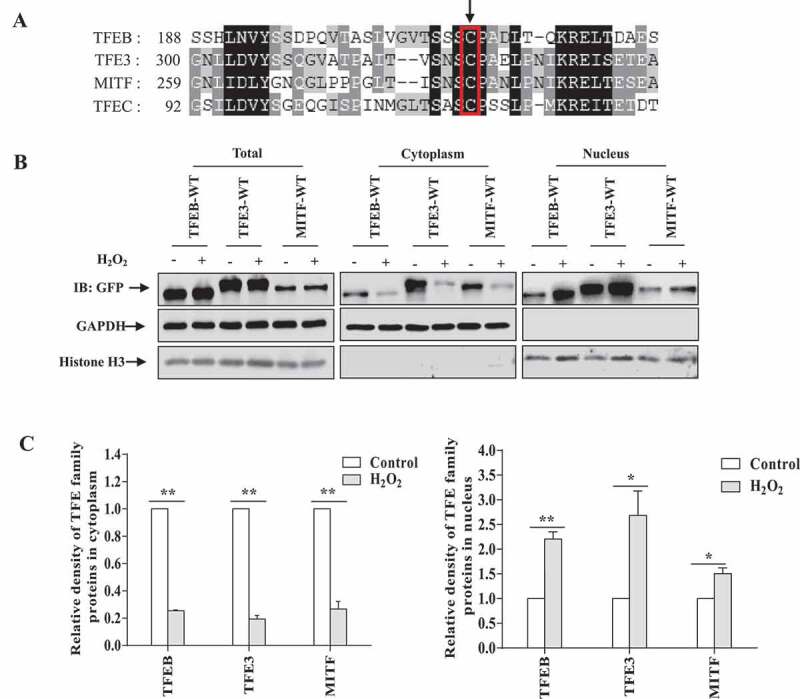
Nuclear translocation of multiple MiT/TFE transcription factors upon exposure to H2O2. (A) Sequence alignment of human MiT/TFE transcription factors. The arrow indicates the cysteine residues which are evolutionarily conserved. (B) HEK293 cells were transfected with TFEB-EGFP, TFE3-EGFP, MITF-EGFP for 24 h. The cells were treated with 1 mM H2O2 for 8 min, then the cells were fractionated and immunoblotted for relative antibodies. (C) The relative densities in (B) were shown. The data from three independent experiments are presented as mean± S.E.M., * p < 0.05, ** p < 0.01, one-way ANOVA.
Figure 4.
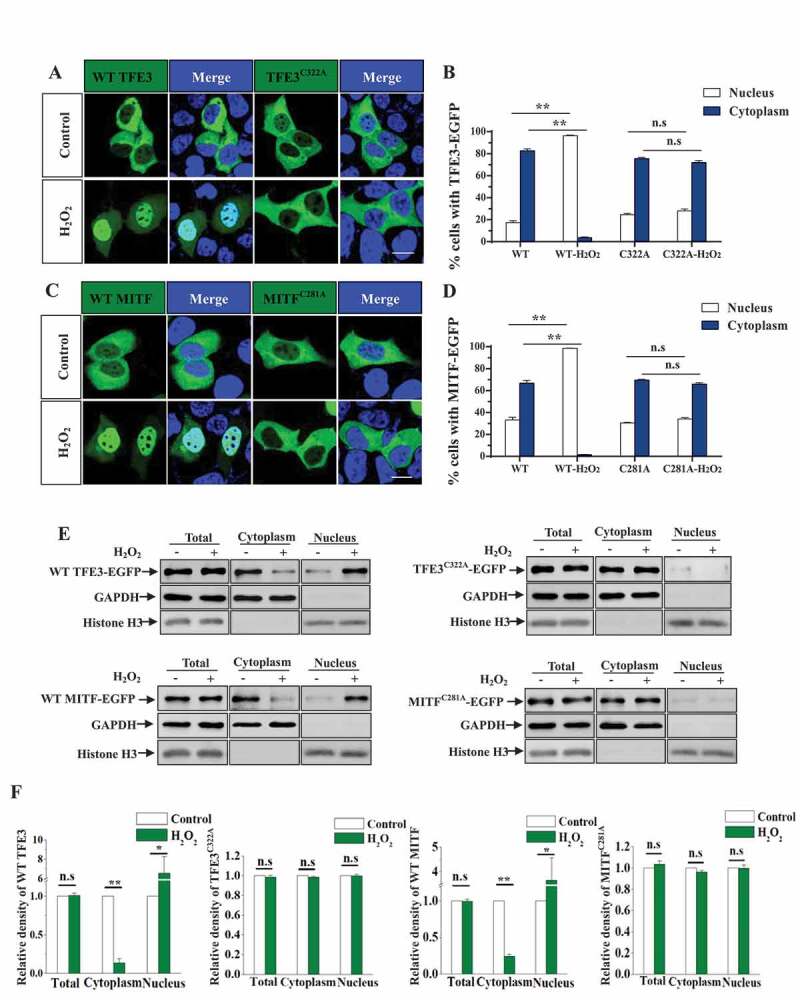
Oxidation of multiple MiT/TFE transcription factors contributes to nuclear translocation of these factors induced by ROS. (A) HEK293 cells expressing WT-TFE3-EGFP or TFE3C322A-EGFP were treated with 1 mM H2O2 for 8 min, and then the cells were fixed. DAPI (blue) was used for nuclear staining. Cells were visualized using confocal microscope. Sale bar, 5 μm. (B) Quantification of TFE3 or TFE3C322A nuclear or cytoplasmic location in (A). Data are from three independent experiments, mean± S.E.M., ns, not significantly different; ** p < 0.01, one-way ANOVA. (C) HEK293 cells expressing WT-MITF-EGFP or MITFC281A-EGFP were similarly treated as in (A). Sale bar, 5 μm. (D) Quantification of MITF or MITFC281A nuclear or cytoplasmic location in (C). Data are from three independent experiments, mean± S.E.M., ns, not significantly different; ** p < 0.01, one-way ANOVA. (E) HEK293 cells expressing WT-TFE3-EGFP, TFE3C322A-EGFP, WT-MITF-EGFP or MITFC281A-EGFP were treated with 1 mM H2O2 for 8 min, then the cells were fractionated, and immunoblotted as indicated. (F) The relative densities of the data from E were shown. The data from three independent experiments are presented as mean± S.E.M., ns, not significantly different; one-way ANOVA. The data from three independent experiments are presented as mean± S.E.M., ns, not significantly different; one-way ANOVA.
Oxidation of TFEB cysteine 212 abolishes the interaction between TFEB and RRAG GTPases, results in TFEB nuclear translocation
As we have shown that H2O2 induces TFEB nuclear translocation by oxidizing TFEB, we wonder how oxidation could affect TFEB cellular localization. Given that RRAG-MTORC1 complex could control phosphorylation and localization of TFEB, we next sought to analyze whether the lysosomal RRAG-MTORC1 complex could participate in oxidized TFEB nuclear translocation driven by ROS. It is reported that in full-fed cells TFEB localizes diffusely in cytoplasm, whereas in torin 1-treated or MTORC1 inactivated cells, but not starved or RRAG GTPase inactivated cells, a portion of TFEB could associate with activated RRAG GTPases and localized on lysosomal surface [11–13,15]. In consistent with these previous studies, we found that when RRAGs were depleted, both wild type and mutant TFEBC212A translocated into the nucleus without lysosomal distribution (Figure 5A–B and S3A-B). As shown in Fig. S3C-E, TFEB could translocate to nucleus upon inhibition of MTORC1 by torin 1 treatment (loss of phosphorylation of TFEB). Notably, lysosomal localization of TFEB was enhanced in torin 1-treated cells, since dephosphorylated TFEB could still recognize lysosomal RRAG GTPases but disassociate with YWHA [12,13]. Upon exposure to H2O2, TFEB fails to localize on lysosomes in torin 1-treated cells (Fig. S3C-E), suggesting the interaction between RRAG GTPase and TFEB might be abolished. When checked the cellular localization of TFEBC212A, we found the mutant protein similarly translocated into the nucleus as WT TFEB, but still localized on lysosomes after H2O2 treatment in torin 1-treated cells (Fig. S3D and E). Taken together, these findings suggest that cellular localization of oxidized TFEB was similar as that in starved or RRAG GTPases-depleted cells, but not torin 1-treated cells. Previous studies showed that starvation could inhibit the activity of RRAG GTPases and enrichment of MTOR on lysosomes. When the starved cells were re-fed with amino acids, TFEB could redistribute to the cytosol, which is consistent with the idea that TFEB continuously shuttles in the cytosol and the nucleus, with the majority of protein retains in the cytosol [16,17]. In contrast, in H2O2-treated cells, TFEB failed to redistribute the cytosol after amino acids re-feeding (Figure 5C). Notably, leptomycin B (LMB; an inhibitor of nuclear export) treatment resulted in nuclear retention of TFEB after nutrition re-feeding (Figure 5B,C), indicating TFEB undergoes nuclear export, which is consistent with the recent studies [16,17]. Whereas, in all H2O2-treated cells with or without LMB, TFEB displays nuclear localization, since oxidation blocks the signaling for TFEB cytoplasmic localization (Figure 5B,C), suggesting that TFEB continually undergoes rapid nuclear import upon H2O2 treatment.
Figure 5.
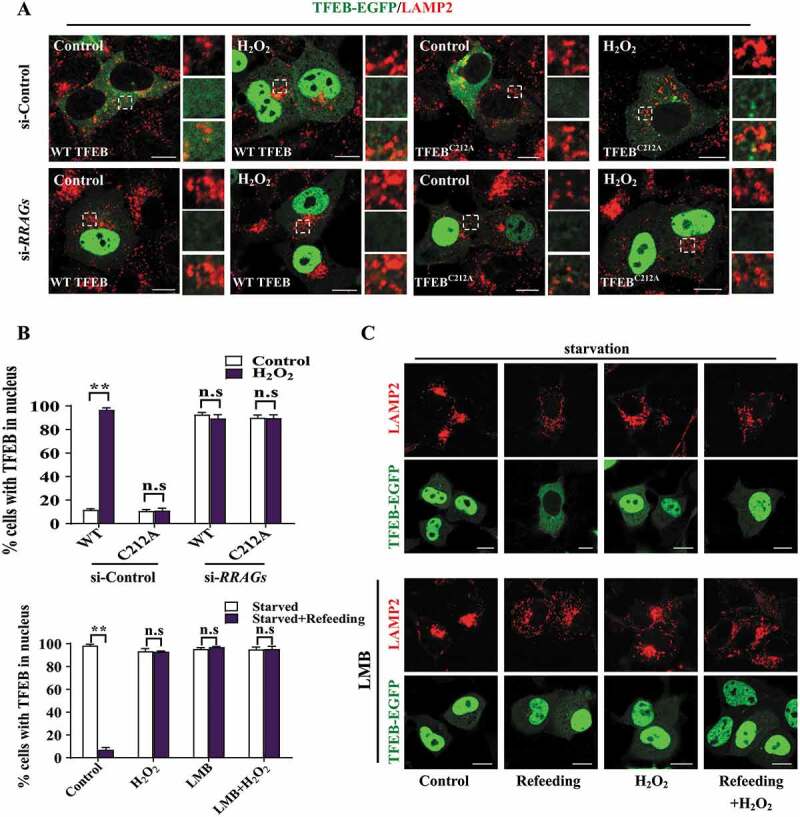
Oxidation of TFEB has a similar effect as RRAG GTPases depletion. (A) HEK293 cells were transfected with the siRNAs either targeting RRAGs. After 48 h, the cells were re-transfected with EGFP-tagged WT or mutant TFEBC212A, followed by treatment with H2O2 for 8 min. Then the cells were fixed and stained with anti-LAMP2 antibody. Regions in dotted boxes are magnified on the right side. Scale bars: 10 µm. (B) Quantification of TFEB nuclear translocation in (A and C). Data are from three independent experiments, mean± S.E.M., ns, not significantly different; ** p < 0.01, one-way ANOVA. (C) HEK293 cells were transfected with TFEB-EGFP for 24 h, and then the cells were starved in EBSS or re-fed with full culture medium for 30 min, along with or without 1 mM H2O2 pre-treatment (8 min) before the end of the previous treatments. Alternatively, the above cells were treated with leptomycin B (LMB) and then fixed and subjected to immunofluorescent assay. Scale bars: 10 µm.
We generated S211A mutation (S211 is an important MTORC1-meidtaed phosphorylation site on TFEB) on TFEBC212A and tested the effect of H2O2 on double mutant TFEBS211A,C212A. As shown in Fig. S4, S211A mutation leads to nuclear translocation and lysosomal localization of TFEBC212A (C212A single mutant compared with S211A,C212A double mutant). Meanwhile, H2O2 failed to reduce the lysosomal localization of TFEBS211A,C212A, compared with H2O2 -treated TFEBS211A (Fig. S4), indicating TFEBS211A is still regulated by C211 oxidation.
Base on the observations that the overall activity of RRAG-MTORC1 complex was not affected in short-term H2O2 treatment accompanying by TFEB nuclear translocation (Fig. S2A, readout of p-RPS6KB/p70S6K, a well-known MTORC1 substrate), we reasoned that if TFEB oxidation could trigger effects on TFEB localization similarly as RRAG GTPase inhibition did, then in this case ROS should affect interaction between TFEB and RRAG GTPases without inhibiting RRAG GTPase activity. To test this idea, we expressed constitutively inactive and active RRAG GTPase mutants in cells and checked the cellular localization of WT and TFEBC212A in cells exposed to H2O2. In consistence with previous studies [13], TFEB showed cytoplasmic distribution with lysosomal puncta when active RRAG GTPases were expressed in the cells (Figure 6A,C). In contrast, in inactive RRAG GTPases-expressing cells, TFEB translocated into the nucleus without lysosomal distribution (Figure 6A,C). When exposed to H2O2, TFEB exhibited nuclear distribution in both active and inactive RRAG GTPase expressing cells (Figure 6A,C). TFEBC212A exhibited similar cellular localization as WT TFEB in both active and inactive RRAG GTPase expressing cells (Figure 6B,D). Upon exposure to H2O2, TFEBC212A translocated into the nucleus in inactive RRAG GTPase expressing cells similarly as WT TFEB (Figure 6A–D), indicating that neither oxidized nor deoxidized TFEB associated with inactive RRAG GTPase. Strikingly, unlike WT TFEB, TFEBC212A retained in the cytoplasm with lysosomal distribution in active RRAG GTPase-expressing cells exposed to H2O2 (Figure 6B,D), indicating that oxidation of TFEB on C212 could result in a disassociation of TFEB with RRAG GTPases. In support with these findings, immunoprecipitation analysis showed that H2O2 abolishes the interaction between TFEB and active RRAG GTPase (Figure 6E). We found that H2O2 also reduced the interaction between TFEB and YWHA which could sequestrate TFEB in the cytosol (Figure 6F). Our findings suggest that TFEB oxidation inhibit the interaction between TFEB and active RRAG GTPases.
Figure 6.
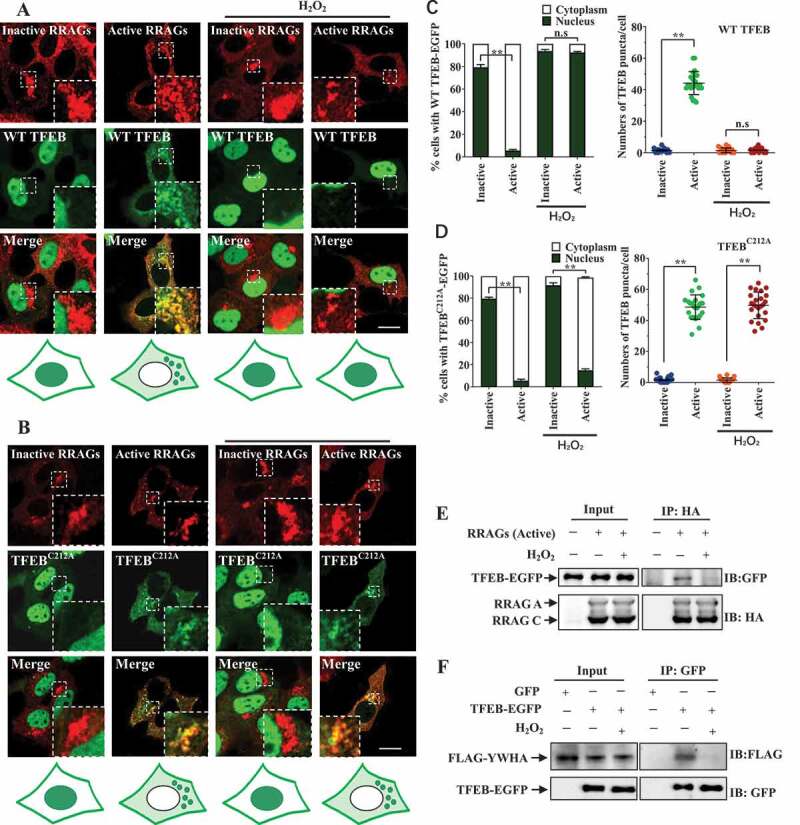
Oxidation of TFEB on cysteine 212 reduces the binding affinity of RRAG GTPases and TFEB. (A-B) HEK293 cells were transfected with HA-GST-tagged constitutively active RRAG GTPase mutants (RRAGAQ66L+RRAGCS75L = RRAGAGTP+RRAGCGDP) or constitutively inactive RRAG GTPase mutants (RRAGAT21L+RRAGCQ120L = RRAGAGDP+RRAGCGTP), along with EGFP-tagged WT or mutant TFEBC212A. After 24 h, the cells were treated with 1 mM H2O2 for 15 min and subjected to immunofluorescence assay with anti-HA antibody. Scale bars: 10 µm. The cartoon under the figures indicates the intracellular localization of TFEB, and the cytoplasmic dots represent lysosomal TFEB. (C–D) For TFEB nuclear translocation, quantitative data from three independent experiments as in (A-B) were presented (left). For TFEB lysosomal puncta counting, 20–24 cells from three independent experiments were analyzed. Data represented as means ± S.E.M., n.s, not significantly different; **, p < 0.01, one-way ANOVA. (E) HEK293 cells transfected with HA-GST-tagged active RRAGs and TFEB-EGFP. Twenty-four hours later, the cells were incubated with H2O2 for 10 min. Supernatant of the cell lysates were used in immunoprecipitation assay with HA antibody. (F) HEK293 cells transfected with FLAG-YWHA and TFEB-EGFP. Twenty-four hours later the cells were treated with H2O2 for 10 min. The cells were then lysed. The supernatant of cell lysates were used in immunoprecipitation assay with GFP antibody.
Lysosomal localization of TFEB, TFE3 and MITF is diminished upon exposure to H2O2
To further verify the mechanism underlying ROS-induced nuclear translocation of TFE3 and MITF, we test H2O2 treatment on the lysosomal localization of MITF and TFE3 in torin 1 -treated cells. Our results showed that TFEB, TFE3 and MITF all translocated into the nucleus after H2O2 treatment, with or without torin 1 (Fig. S3F). Meanwhile, the lysosomal localization of TFE3 and MITF were decreased as TFEB when the cells were treated with H2O2 and torin 1 (Figure 7). Next, we employed mutant TFEBR245−247A, which lacks the nuclear localization signal, to further verify the effect of H2O2 on lysosomal localization of MiT/TFE transcription factors. When exposed to H2O2, mutant TFEBR245−247A remains in the cytosol but fails to localize on lysosomes in torin 1-treated cells (Figure 7, right panel at the bottom), indicating the impaired lysosomal localization was not caused by nuclear translocation of these proteins.
Figure 7.
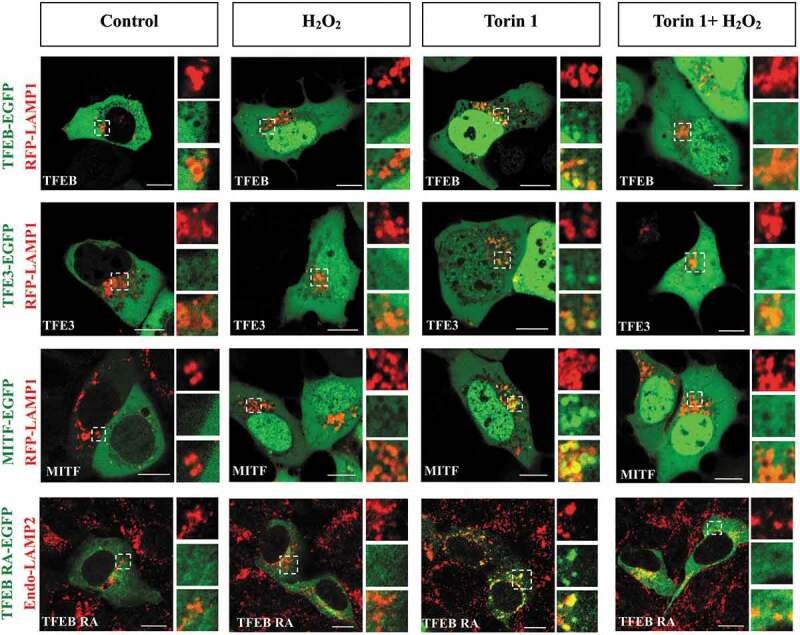
Oxidation of TFEB/TFE3/MITF decreases the lysosomal localization of these factors. HEK293 cells were transfected with EGFP-tagged TFEB, TFE3, MITF or TFEBR245−247A (hereafter referred to as TFEB RA), along with LAMP1-RFP or stained with anti-LAMP2 antibody. The cells were treated with 1 mM H2O2 for 8 min, 250 nM torin 1 for 1 h, or combination of H2O2 and torin 1. Scale bars: 10 µm.
ROS increases the global gene expression in autophagy-lysosome system through TFEB, TFE3 and MITF
Because TFEB, TFE3 and MITF are the master regulators for autophagy and lysosomal biogenesis, and nuclear translocation of these proteins is associated with their enhanced transcriptional activity, we wondered whether ROS could affect the transcriptional regulation of autophagosomal and lysosomal biogenesis through TFEB, TFE3 and MITF. It has been well-known that MAP1LC3B/LC3B (microtubule associated protein 1 light chain 3 beta; hereafter referred to as LC3) is an autophagosomal marker. As shown by our results, ROS increased the protein level of LC3-II in cells treated with or without bafilomycin A1 (Bafi A1), but failed to do so in those cells lacking TFEB, TFE3 and MITF (Figure 8A and S5), indicating that ROS increases autophagosomal biogenesis through TFEB, TFE3 and MITF. Next, we broadly assessed the gene transcriptional level in autophagy-lysosome system. H2O2 treatment resulted in enhanced TFEB transcriptional activity and globally increased expression of autophagosomal and lysosomal genes in control cells, but not the cells lacking TFEB, TFE3 and MITF (Figure 8B,C), indicating activation of these MiT/TFE transcription factors contribute to the upregulation of autophagy and lysosomal biogenesis driven by ROS.
Figure 8.
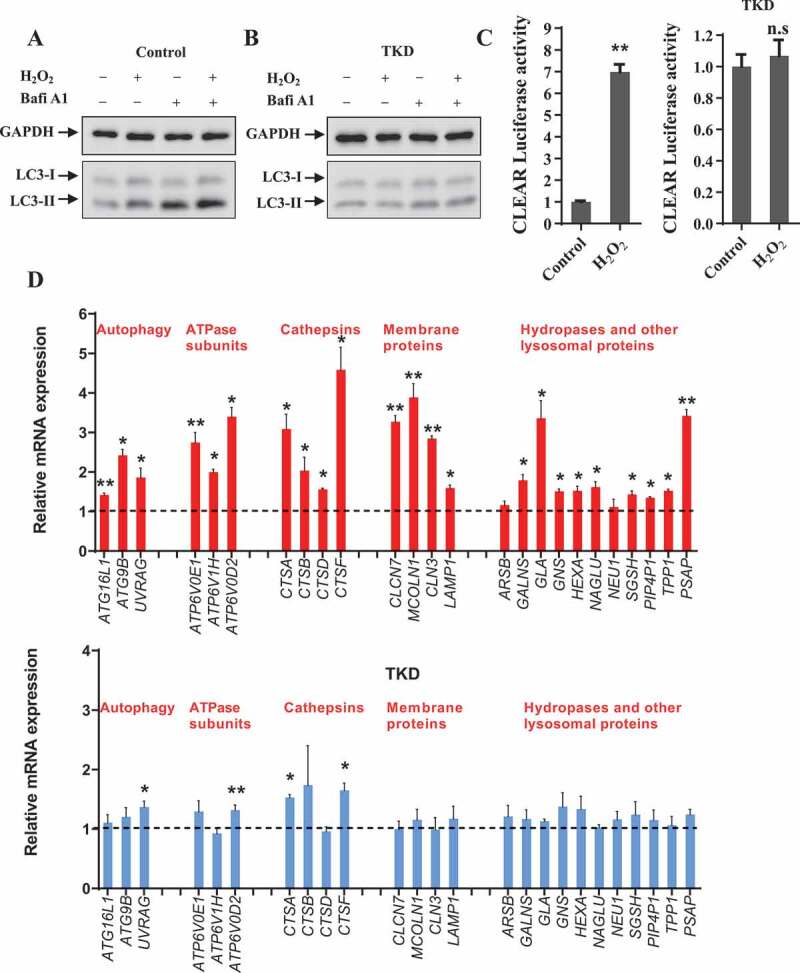
TFEB/TFE3/MITF transcription factors are crucial for ROS-induced autophagosomal and lysosomal biogenesis. (A-B) HEK293 cells were transfected with a combination of TFEB, TFE3 and MITF siRNAs (triple knockdown, hereafter referred to as TKD) for 72 h. Then the cells were treated with 200 μM H2O2, along with or without 100 nM bafilomycin A1 (Bafi A1) for 4 h. The cell lysates were collected for immunoblot analysis to detect LC3 level. (C) HEK293 cells were transfected with control or TKD siRNAs, along with pGL2-2xCLEAR and Renilla, then subjected to H2O2 treatment (1 mM H2O2 for 4 h) and Dual-luciferase reporter assay. Data are from three independent experiments, mean± S.E.M., ns, not significantly different; ** p < 0.01, one-way ANOVA. (D) HEK293 cells were transfected with control or TKD siRNAs. Seventy-two hours after transfection, the cells were treated or not treated with 1 mM H2O2 for 4 h. Then the cells were processed for qRT-PCR. mRNA levels of indicated autophagic and lysosomal genes were quantified, and the values were normalized to GAPDH, compared with non-treated group. The data are presented as means ± S.E.M., **, p < 0.01; *, p < 0.05; others (no asterisk), not significantly different, one-way ANOVA.
Discussion
Although recent studies reveal that TFEB and other members of the MiT-TFE transcription factors are strictly regulated by various conditions and cellular stress, such as amino acid deprivation, glucose limitation, inflammation, mitochondrial damage and ER stress [9–14,17–19], it is still not known how exactly the nucleocytoplasmic shuttling of MiT-TFE transcription factors is regulated by oxidative stresses. Also, great efforts have been made toward elucidating the role of phosphorylation in the regulation of MiT-TFE transcription factor cellular localization and function [20], but the role of other post-translational modifications in the regulation of MiT-TFE transcription factor remains unknown. Our present findings uncover a novel mechanism that oxidation-mediated autophagy regulation is integrated with redox signaling to maintain cell homeostasis under oxidative stress, which is associated with neurodegenerative diseases including PD and ALS [1].
Unlike starvation condition or torin 1 treatment which lead to inactivation of RRAG GTPase or MTOR, ROS could trigger rapid nuclear translocation of TFEB independently of MTOR inhibition, since nuclear translocation of TFEB occurs while MTORC1 signaling was not affected during short term H2O2 treatment (Fig. S2A). Interestingly, given that long term H2O2 treatment could inhibit MTORC1 [21,22], and that our results showing treatment of H2O2 results in decreased p-RPS6KB1/p70S6K after 1 h (Fig. S2A), the identification of the TFEB oxidation and its nuclear translocation in response to oxidative stress provides new insight into how cells coordinate the MTORC1 signaling and oxidation-mediated regulation of MiT-TFE transcription factors to oxidative stress. Relevant to this, TFEBC212A translocated into the nucleus (similarly as WT TFEB) upon longer term H2O2 treatment, indicating that TFEBC212A could be also regulated by MTORC1-mediated phosphorylation (Fig. S2B), which is independent of C212 oxidation. Therefore, treatment of H2O2 has both MTORC1-dependent (MTOR phosphorylation, indirect effect) and C212-dependent (oxidation, direct effect) effects on the regulation of TFEB, and our observations in Figure 8 indicate that both effects contribute to the activation of MiT-TFE transcription factors upon long term (4 h) exposure to ROS. Importantly, our manuscript not only identifies TFEB oxidation as a novel mechanism for the regulation of TFEB, but also clarify the contribution of MTORC1 signaling in H2O2-mediated TFEB activation.
Several elegant studies recently reported that protein phosphatase PPP3/calcineurin and PPP2/PP2A (protein phosphatase 2) regulates nuclear translocation and activity of TFE3 and TFEB under oxidative stress [23–25], raising the possibility that treatment of H2O2 may lead to fast dephosphorylation of TFEB. In our observations, H2O2 treatment induces rapid TFEB nuclear translocation in a MCOLN1/TRPML1-, PPP3/calcineurin- and PPP2/PP2A-independent manner (Fig. S6). It is therefore possible that H2O2 treatment may trigger the activation of other unrecognized phosphatases to de-phosphorylate TFEB, which in turn facilitate TFEB nuclear translocation.
Importantly, the only cysteine oxidation site which was identified as required for TFEB nuclear translocation during oxidation stress also presents in the relatively similar region of TFE3 and MITF, suggesting that similar mechanism might be involved in ROS-induced nuclear translocation of MiT-TFE transcription factors. We observed that H2O2 treatment not only resulted in nuclear translocation of TFEB, but also inhibited TFEB lysosomal localization (Figure 6). It suggests that oxidation of cysteine may block the association of MiT-TFE transcription factors with lysosomal RRAG GTPases (Fig. 5, 7), thereby impairs the MTOR-mediated phosphorylation of these factors (Figure 2G). There are three possibilities: (1) oxidation of MiT-TFE transcription factors may result in a conformational change, and this change may block interaction between the N-terminus of MiT-TFE transcription factors and active RRAG GTPases, since previous studies reported that N-terminus of MiT-TFE transcription contains a RRAG-binding domain (RBD). (2) oxidized MiT-TFE transcription factors may interact with other binding partners to a greater extent, thereby influence the affinity of RBD-RRAG GTPase association. (3) oxidation may trigger the alteration of overall post-translational modifications of MiT-TFE transcription factors, which in turn affect the association with RRAG GTPases.
Cells under oxidative stress may require sufficient autophagic flux to protect themselves against enhanced ROS-induced cytotoxicity. This is particularly important for the cells under pathological conditions such as neurodegeneration, simply because the protein quality control system including autophagy-lysosome system may be partially impaired. In this case, it would be critical for the cells, especially the neuronal cells, to generate much more autophagosomes and lysosomes to achieve demanding autophagosome-lysosome fusion through MiT-TFE transcription factors. Relevant to this, dysfunctions in autophagy-lysosome system can cause neurodegenerative disorders, and these disorders are always characterized by excess ROS. In conclusion, our findings provide key insight into the mechanism by which ROS induces autophagy at the transcription level, highlighting an important role of oxidation and nuclear translocation of MiT-TFE transcription factors in dealing with oxidative stress. Given the essential role of autophagy in governing cell homeostasis in neurodegeneration, and that MiT-TFE transcription factor nuclear translocation-mediated induction of autophagosomal and lysosomal genes can protect neurons against oxidative stress-induced cytotoxicity [26], the present study would be helpful for understanding the mechanism underlying ROS-autophagy crosstalk and developing therapeutic strategies for neurodegenerative diseases.
Materials and methods
Plasmid constructs
The pEGFP-N3-TFEB, LAMP1-RFP, FLAG-YWHA, pRK5-HA GST RRAGAGTP (RRAGAQ66L), pRK5-HA GST RRAGCGDP (RRAGCS75L), pRK5-HA GST RRAGAGDP (RRAGAT21L) and pRK5-HA GST RRAGCGTP (RRAGCQ120L) plasmids were described previously [15,27–29]. The pEGFP-N1-TFE3 and pEGFP-N1-MITF were provided generously by Shawn Ferguson (Addgene, 38,120 and 38,132). 3× FLAG-tagged TFE3 was generated by excising full-length TFE3 cDNA from pEGFP-N1-TFE3 and inserting it into the p3xFLAG-myc-CMV-24 (Sigma) vector at HindIII/KpnI sites. The point mutation of 3× FLAG-TFE3C322A, pEGFP-N1-MITFC281A, pEGFP-N3-TFEBS211A/C212A and pEGFP-N3-TFEBR245−247A were generated by the Site Directed Mutagenesis using MutanBEST kit (Takara). pEGFP-N1-TFE3C322A was generated by excising TFE3C322A from 3× FLAG-TFE3C322A and inserting it into the pEGFP-N1 vector (Clontech, 6085–1) at HindIII/KpnI sites. For pET-15b His Tag WT TFEB and TFEBC212A, WT and TFEBC212A cDNAs were amplified by PCR and the cDNAs were inserted to pET-15b vector (Novagen, 69,661–3). FLAG-TFEBC212A was generated by site mutagenesis. The firefly luciferase reporter plasmid pGL2-2xCLEAR-luciferase was a gift from Dr. Sung Hee Beak (Addgene, 81,120). All constructs were confirmed by sequencing.
Cell culture, transfection, chemicals and drug treatment
Human embryonic kidney 293 (HEK293; ATCC, CRL-1573TM) cells were cultured in Dulbecco’s modified Eagle’s medium (DMEM; Gibco, 11995500) containing 10% fetal bovine serum (Gibco, 10099141C) with penicillin (100 U/ml) and streptomycin (100 µg/ml). SH-SY5Y cells (ATCC, CRL-2266TM) were cultured in DMEM/F12 medium with 10% fetal bovine serum and antibiotics. The cells were transfected with plasmids using Lipofectamine 2000 reagent (Invitrogen, 11668019) in Opti-MEM (Gibco, 31985070) without serum according to manufacturer’s instructions. To establish the stable cell line expressing WT TFEB or TFEBC212A, HEK293 cells were transfected with plasmids expressing EGFP-tagged WT TFEB or TFEBC212A, and individual clones stably expressing TFEB were selected using G418 (Gibco, 11811031). Cells were incubated with DMSO (BBI Life Science Corporation, A600163), Earle’s balanced salt solution (EBSS; Invitrogen, 14155063), 250 nM torin 1 (Tocris Bioscience, 4247), 5 mM N-acetyl cysteine (NAC; Sigma-Aldrich, A7250), 5 μM FK506 (Abcam, ab120223), 5 μM FTY720 (TargetMol, T2539), 20 μM ML-SA1 (Abcam, ab144622), 200 nM okadaic acid (Beyotime Biotechnology, s1786), 0.5 mM mendadione (MedChemExpress, HY-B0332), 5 μg/ml 4-NQO (Sigma-Aldrich, N8141), 10 μM leptomycin B (Beyotime Biotechnology, s1726), 100 nM bafilomycin A1 Sigma-Aldrich, 196000) and H2O2 (1 mM) for the indicated times. 4ʹ6-diamidino-2-phenylindole (DAPI), Hoechst and propidium iodide (PI) were purchased from Sigma (P4170).
Subcellular fractionation
Cells were harvested, washed with ice-cold phosphate-buffered saline (PBS; Gibco, 10010023; pH 7.4) three times, and re-suspended with ice-cold sucrose buffer (10 mM sucrose [Sigma-Aldrich, V900116],1 mM CaCI2, 10 mM MgAc, 2.5 mM EDTA, 1 mM DTT, 1 mM PMSF [Sigma, P7626], 0.5% NP-40 [BBI Life Science Corporation, A100109]). Then the cells were incubated on ice for 20 min and were separated into supernatants (cytoplasm) and pellet (nucleus) followed by centrifugation at 600 g for 15 min at 4°C. Subsequently, the pellets were washed twice with sucrose buffer without NP-40 and finally re-suspended in cell lysis buffer.
Immunoblot analysis and antibodies
Cells were lysed in the cell lysis buffer containing 25 mM Tris-HCl (pH 7.6), 1% NP-40, 150 mM NaCl and 1% sodium deoxycholate (BBI Life Science Corporation, A100613) in the presence of protease inhibitor cocktail (Roche, 4693132001). Immunoblot analysis was standardly performed as previously reported [30–35]. Briefly, the proteins were firstly separated by SDS-PAGE and transferred onto a polyvinylidene difluoride membrane (Merck Millipore, IPVH00010), then were subjected to immunoblot analysis using the following primary antibodies: anti-GFP antibody (Santa Cruz Biotechnology, sc-9996; 1;500), anti-GAPDH (Proteintech, 60004-4-lg; 1:5000), anti-p-RPS6KB1/p70S6K antibody (T389; Cell Signaling Technology, 9205; 1:100), anti-RPS6KB1/p70S6K antibody (Epitomics, 1494–1; 1:1000), anti-TFEB (Cell Signaling Technology, 4240; 1:1000), anti-p-TFEB (S211) antibody (Cell Signaling Technology, 37681; 1:100), anti-TFE3 antibody (Proteintech, 14480-1-AP; 1:500), anti-MITF antibody (Santa Cruz Biotechnology, sc-52938; 1:300), anti-GST antibody (Santa Cruz Biotechnology, sc-138; 1:1000), anti-FLAG antibody (Sigma, F3165; 1:5000), anti-LC3B antibody (Novus Biologicals, NB1-02200; 1:5000) anti-HA (Santa Cruz Biotechnology, sc-7392; 1:500), anti-Histone H2B (Abcam, ab45695; 1:2000) and anti-Histone H3 antibody (Proteintech, 17168-1-AP; 1:1000). RRAG B antibodies were previously reported [15]. The following secondary antibodies were used: horseradish peroxidase-conjugated sheep anti-mouse and anti-rabbit antibodies (Amersham Pharmacia Biotech). HRP-conjugated Streptavidin (Proteintech, SA00001-0; 1:2000) was used to detect biotinylated proteins. The proteins were visualized with an ECL detection kit (Thermo, 34080).
SiRNAs
The following siRNAs were used: Negative control: A non-targeting oligonucleotide; human RRAGA: 5ʹ-CCAACUUCGCUGCUUUCAUTT-3ʹ; human RRAGB: 5ʹ-GGACAUGCACUAUUACCAAUTT-3ʹ; human TFE3: 5ʹ-GCAGCUCCGAAUUCAGGAACUTT-3ʹ; human TFEB: 5ʹ-GAGACGAAGGUUCAACAUCAATT-3ʹ; human MITF: 5ʹ-CGGGAAACUUGAUUGAUCUUUTT-3ʹ; human MCOLN1/TRPML1: 5ʹ-CCCACAUCCAGGAGUGUAATT-3ʹ; human PPP3CB (PPP3/calcineurin subunit) 5ʹ-UGACAGAAAUGUUGGUAAAUTT-3ʹ; siRNAs targeting RRAGA and RRAGB were co-transfected to block the expression of RRAG proteins (si-RRAGs).
Immunofluorescence and live cell imaging
HEK293 cells were washed with PBS (pH 7.4) and fixed with 4% paraformaldehyde for 10 min at room temperature. Then the cells were permeabilized with 0.15% Triton X-100 and blocked with 0.1% fetal bovine serum for 5 min. Cells were incubated with the HA (Santa Cruz Biotechnology, sc-7392; 1:300), LAMP1 antibody (Abcam, ab24170; 1:100), LAMP2 antibody (Santa Cruz Biotechnology, sc-18822; 1:150) or TFEB antibody (Cell Signaling Technology, 37681; 1:100) for 2 h, subsequently with the Alexa Fluor 594-conjugated or 488-conjugated goat anti-rabbit or anti-mouse IgG (Proteintech) for 2 h followed with DAPI (Sigma-Aldrich, D8417) staining for 5 min. The stained cells and TFEB-EGFP-expressing live cells were visualized using a Nikon [36] or a Zeiss LSM710 confocal microscope [37,38].
Quantitative real-time PCR (qRT-PCR) and RT-PCR
Total RNA from cultured cells were extracted with TRIzol Reagent (Invitrogen, 15596026). Then the RNAs were reverse transcribed into cDNA using PrimeScript RT Master Mix (Takara, RR036). SYBR Green Real-Time PCR Master Mix (Takara, RR820) was used for real-time PCR to analyze relevant mRNA level. The primers for mRNAs were described before in our previous work [15].
Dual-luciferase reporter assay
HEK293 cells were co-transfected with pGL2-2xCLEAR (Addgene, 81120) and Renilla (Promega). Twenty-four h later after transfection, the cells were treated with H2O2 and subjected to Dual-Luciferase Reporter Assay. The luciferase activity was measured using Luminoskan Ascent Microplate Luminometer (Thermo Scientific) according to the protocol. The firefly luminescence signals were normalized by Renilla luminescence signals.
Biotin labeling and analysis of TFEB oxidation
Maleimide-Biotin (Sigma-Aldrich, B1267) was used to label H2O2 oxidized cysteine residues with the procedures previously reported [39]. Briefly, for in vitro oxidation, His-WT TFEB and His-TFEBC212A were affinity purified with His-Bind Resin (Merck Millipore) and incubated with 5 mM H2O2 for 8 min and incubated with buffer containing 50 mM Tris-HCl, pH 7.0, 10 mM NEM (Aladdin, E100552), 120 mM sodium chloride, 0.5% NP40 (BBI Life Science Corporation, A100109), 0.5 mM EDTA to modify cysteine residues not oxidized by H2O2. DTT was used to reverse oxidation followed by Maleimide-Biotin labeling. For in-cell oxidation, cells expressing FLAG-WT TFEB or FLAG-TFEBC212A were treated with 1 mM H2O2 for 8 min and lysed in NEM-containing buffer. The FLAG-tagged TFEB was immunoprecipitated with FLAG antibody and Dynabeads Protein G (Invitrogen, 10004D) before treating with DTT and labeling with Maleimide-Biotin. The bound proteins were eluted by SDS sample buffer and subjected to immunoblot analysis.
Statistical analysis
We used Photoshop 7.0 (Adobe) software to perform immunoblot densitometric analyzes of three independent experiments. Cellular localization of TFEB, TFE3 and MITF was determined by visual inspection. The obtained data were used for generating charts using Prism 6.0 (GraphPad Software) software. P-values were indicated in figure legends.
Supplementary Material
Acknowledgments
We thank Dr. Andrea Ballabio (Telethon Institute of Genetics and Medicine, Naples, Italy) for kindly providing us the 3×FLAG-TFEB plasmid; Dr. Shawn Ferguson (Yale University) and Dr. Rosa Puertollano (National Institutes of Health) for unpublished plasmids and useful suggestions; Dr. Wei Kevin Zhang (South-Central University for Nationalities, China) for the critical reagents. The authors are very grateful to the former members of Dr. Guanghui Wang’s laboratory, especially Feng Gao and Mingmei Wang, for technical support and handling of experimental materials.
Funding Statement
This work was supported by the National Key Plan for Scientific Research and Development of China (No. 2017YFC0909100), the National Natural Science Foundation of China (Nos. 31571053 and 31771117), the Natural Science Foundation of the Jiangsu Higher Education Institutions of China (19KJB310016), the Second Affiliated Hospital of Soochow University Science Foundation (SDFEYQN1720), a Project Funded by Jiangsu Key Laboratory of Neuropsychiatric Diseases (BM2013003), a Project Funded by the Priority Academic Program Development of the Jiangsu Higher Education Institutes (PAPD), J.H.M.P. was supported by ERASMUS+.
Disclosure statement
No potential conflict of interest was reported by the authors.
Supplementary material
Supplemental data for this article can be accessed here.
References
- [1].Barnham KJ, Masters CL, Bush AI.. Neurodegenerative diseases and oxidative stress. Nat Rev Drug Discov. 2004;3:205–214. [DOI] [PubMed] [Google Scholar]
- [2].Hekimi S, Lapointe J, Wen Y.. Taking a “good” look at free radicals in the aging process. Trends Cell Biol. 2011;21:569–576. [DOI] [PMC free article] [PubMed] [Google Scholar]
- [3].Dikic I, Elazar Z. Mechanism and medical implications of mammalian autophagy. Nat Rev Mol Cell Biol. 2018;19:349–364. [DOI] [PubMed] [Google Scholar]
- [4].Nixon RA. The role of autophagy in neurodegenerative disease. Nat Med. 2013;19:983–997. [DOI] [PubMed] [Google Scholar]
- [5].Nguyen DKH, Thombre R, Wang J. Autophagy as a common pathway in amyotrophic lateral sclerosis. Neurosci Lett. 2019;697:34–48. [DOI] [PMC free article] [PubMed] [Google Scholar]
- [6].Ross CA, Poirier MA. Opinion: what is the role of protein aggregation in neurodegeneration? Nat Rev Mol Cell Biol. 2005;6:891–898. [DOI] [PubMed] [Google Scholar]
- [7].Sardiello M, Palmieri M, Di Ronza A, et al. A gene network regulating lysosomal biogenesis and function. Science. 2009;325:473–477. [DOI] [PubMed] [Google Scholar]
- [8].Settembre C, Di Malta C, Polito VA, et al. TFEB links autophagy to lysosomal biogenesis. Science. 2011;332:1429–1433. [DOI] [PMC free article] [PubMed] [Google Scholar]
- [9].Martina JA, Diab HI, Lishu L, et al. The nutrient-responsive transcription factor TFE3 promotes autophagy, lysosomal biogenesis, and clearance of cellular debris. Sci Signal. 2014;7:ra9. [DOI] [PMC free article] [PubMed] [Google Scholar]
- [10].Settembre C, Zoncu R, Medina DL, et al. A lysosome-to-nucleus signalling mechanism senses and regulates the lysosome via mTOR and TFEB. Embo J. 2012;31:1095–1108. [DOI] [PMC free article] [PubMed] [Google Scholar]
- [11].Martina JA, Chen Y, Gucek M, et al. MTORC1 functions as a transcriptional regulator of autophagy by preventing nuclear transport of TFEB. Autophagy. 2012;8:903–914. [DOI] [PMC free article] [PubMed] [Google Scholar]
- [12].Roczniak-Ferguson A, Petit CS, Froehlich F, et al. The transcription factor TFEB links mTORC1 signaling to transcriptional control of lysosome homeostasis. Sci Signal. 2012;5:ra42. [DOI] [PMC free article] [PubMed] [Google Scholar]
- [13].Martina JA, Puertollano R. Rag GTPases mediate amino acid-dependent recruitment of TFEB and MITF to lysosomes. J Cell Biol. 2013;200:475–491. [DOI] [PMC free article] [PubMed] [Google Scholar]
- [14].Nezich CL, Wang C, Fogel AI, et al. MiT/TFE transcription factors are activated during mitophagy downstream of Parkin and Atg5. J Cell Biol. 2015;210:435–450. [DOI] [PMC free article] [PubMed] [Google Scholar]
- [15].Xia Q, Wang H, Hao Z, et al. TDP-43 loss of function increases TFEB activity and blocks autophagosome-lysosome fusion. Embo J. 2016;35:121–142. [DOI] [PMC free article] [PubMed] [Google Scholar]
- [16].Li L, Friedrichsen HJ, Andrews S, et al. A TFEB nuclear export signal integrates amino acid supply and glucose availability. Nat Commun. 2018;9:2685. [DOI] [PMC free article] [PubMed] [Google Scholar]
- [17].Napolitano G, Esposito A, Choi H, et al. mTOR-dependent phosphorylation controls TFEB nuclear export. Nat Commun. 2018;9:3312. [DOI] [PMC free article] [PubMed] [Google Scholar]
- [18].Martina JA, Diab HI, Brady OA, et al. TFEB and TFE3 are novel components of the integrated stress response. Embo J. 2016;35:479–495. [DOI] [PMC free article] [PubMed] [Google Scholar]
- [19].Pastore N, Brady OA, Diab HI, et al. TFEB and TFE3 cooperate in the regulation of the innate immune response in activated macrophages. Autophagy. 2016;12:1240–1258. [DOI] [PMC free article] [PubMed] [Google Scholar]
- [20].Puertollano R, Ferguson SM, Brugarolas J, et al. The complex relationship between TFEB transcription factor phosphorylation and subcellular localization. Embo J. 2018;37. [DOI] [PMC free article] [PubMed] [Google Scholar]
- [21].Alexander A, Cai SL, Kim J, et al. ATM signals to TSC2 in the cytoplasm to regulate mTORC1 in response to ROS. Proc Natl Acad Sci U S A. 2010;107:4153–4158. [DOI] [PMC free article] [PubMed] [Google Scholar]
- [22].Chen L, Xu B, Liu L, et al. Hydrogen peroxide inhibits mTOR signaling by activation of AMPKalpha leading to apoptosis of neuronal cells. Lab Invest. 2010;90:762–773. [DOI] [PMC free article] [PubMed] [Google Scholar]
- [23].Martina JA, Puertollano R. Protein phosphatase 2A stimulates activation of TFEB and TFE3 transcription factors in response to oxidative stress. J Biol Chem. 2018;293:12525–12534. [DOI] [PMC free article] [PubMed] [Google Scholar]
- [24].Medina DL, Di Paola S, Peluso I, et al. Lysosomal calcium signalling regulates autophagy through calcineurin and TFEB. Nat Cell Biol. 2015;17:288–299. [DOI] [PMC free article] [PubMed] [Google Scholar]
- [25].Zhang X, Cheng X, Yu L, et al. MCOLN1 is a ROS sensor in lysosomes that regulates autophagy. Nat Commun. 2016;7:12109. [DOI] [PMC free article] [PubMed] [Google Scholar]
- [26].Tsunemi T, Ashe TD, Morrison BE, et al. PGC-1alpha rescues Huntington’s disease proteotoxicity by preventing oxidative stress and promoting TFEB function. Sci Transl Med. 2012;4:142ra97. [DOI] [PMC free article] [PubMed] [Google Scholar]
- [27].Tao Z, Wang H, Xia Q, et al. Nucleolar stress and impaired stress granule formation contribute to C9orf72 RAN translation-induced cytotoxicity. Hum Mol Genet. 2015;24:2426–2441. [DOI] [PubMed] [Google Scholar]
- [28].Ying Z, Wang H, Fan H, et al. Gp78, an ER associated E3, promotes SOD1 and ataxin-3 degradation. Hum Mol Genet. 2009;18:4268–4281. [DOI] [PubMed] [Google Scholar]
- [29].Wang H, Ying Z, Wang G. Ataxin-3 regulates aggresome formation of copper-zinc superoxide dismutase (SOD1) by editing K63-linked polyubiquitin chains. J Biol Chem. 2012;287:28576–28585. [DOI] [PMC free article] [PubMed] [Google Scholar]
- [30].Zhou L, Wang HF, Ren HG, et al. Bcl-2-dependent upregulation of autophagy by sequestosome 1/p62 in vitro. Acta Pharmacol Sin. 2013;34:651–656. [DOI] [PMC free article] [PubMed] [Google Scholar]
- [31].Lv G, Sun D, Zhang J, et al. Lx2-32c, a novel semi-synthetic taxane, exerts antitumor activity against prostate cancer cells in vitro and in vivo. Acta Pharm Sin B. 2017;7:52–58. [DOI] [PMC free article] [PubMed] [Google Scholar]
- [32].Liu D, Tang H, Li XY, et al. Targeting the HDAC2/HNF-4A/miR-101b/ampk pathway rescues tauopathy and dendritic abnormalities in Alzheimer’s disease. Mol Ther. 2017;25:752–764. [DOI] [PMC free article] [PubMed] [Google Scholar]
- [33].Yang Y, Guan D, Lei L, et al. H6, a novel hederagenin derivative, reverses multidrug resistance in vitro and in vivo. Toxicol Appl Pharmacol. 2018;341:98–105. [DOI] [PubMed] [Google Scholar]
- [34].Wang X, Liu D, Huang HZ, et al. A novel MicroRNA-124/PTPN1 signal pathway mediates synaptic and memory deficits in alzheimer’s disease. Biol Psychiatry. 2018;83:395–405. [DOI] [PubMed] [Google Scholar]
- [35].Su Y, Deng MF, Xiong W, et al. MicroRNA-26a/death-associated protein kinase 1 signaling induces synucleinopathy and dopaminergic neuron degeneration in Parkinson’s disease. Biol Psychiatry. 2019;85:769–781. [DOI] [PMC free article] [PubMed] [Google Scholar]
- [36].Wu JC, Qi L, Wang Y, et al. The regulation of N-terminal Huntingtin (Htt552) accumulation by Beclin1. Acta Pharmacol Sin. 2012;33:743–751. [DOI] [PMC free article] [PubMed] [Google Scholar]
- [37].Ren ZX, Zhao YF, Cao T, et al. Dihydromyricetin protects neurons in an MPTP-induced model of Parkinson’s disease by suppressing glycogen synthase kinase-3 beta activity. Acta Pharmacol Sin. 2016;37:1315–1324. [DOI] [PMC free article] [PubMed] [Google Scholar]
- [38].Fang LM, Li B, Guan JJ, et al. Transcription factor EB is involved in autophagy-mediated chemoresistance to doxorubicin in human cancer cells. Acta Pharmacol Sin. 2017;38:1305–1316. [DOI] [PMC free article] [PubMed] [Google Scholar]
- [39].Lee JG, Baek K, Soetandyo N, et al. Reversible inactivation of deubiquitinases by reactive oxygen species in vitro and in cells. Nat Commun. 2013;4:1568. [DOI] [PMC free article] [PubMed] [Google Scholar]
Associated Data
This section collects any data citations, data availability statements, or supplementary materials included in this article.