Figure 10.

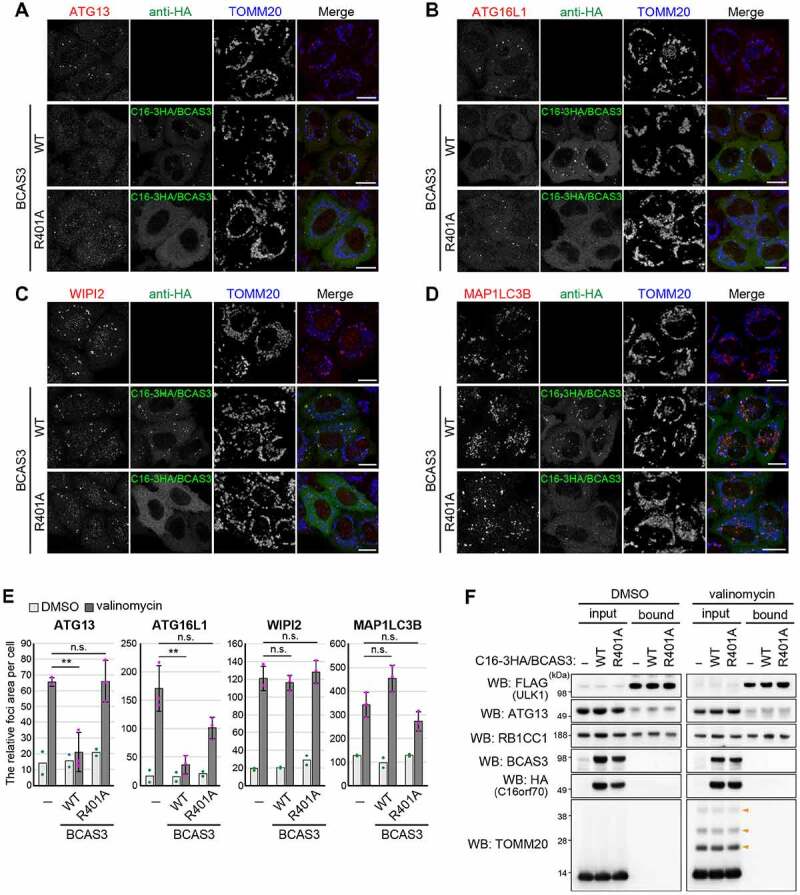
Overexpression of the BCAS3-C16orf70 complex affects recruitment of core autophagy proteins to the phagophore assembly site. (A-D) HeLa cells stably expressing PRKN alone (upper panel) or with IRES-based overexpression of C16orf70-3HA/BCAS3 (C16-3HA/BCAS3), WT (middle panel), or R401A (lower panel) were treated with valinomycin for 3 h and then immunostained with the indicated antibodies. Images are displayed as z-stacked confocal slices. Bars: 20 µm. (E) The relative foci areas for endogenous ATG13, WIPI2, ATG16L1 and MAP1LC3B in cells shown in (A-D) were quantified. Each dot represents the mean value determined from >100 cells and error bars represent mean ± s.d. in two (for DMSO) and three (for valinomycin) independent experiments. Statistical differences were determined by student’s t-test (n.s.: not significant; **P < 0.01). (F) HeLa cells stably expressing PRKN and 3FLAG-ULK1 with or without IRES-based overexpression of C16orf70-3HA/BCAS3 (C16-3HA/BCAS3), WT, or R401A were treated with DMSO or valinomycin for 3 h. The cell lysates were co-immunoprecipitated with an anti-FLAG antibody and 30% of the input and bound fractions were analyzed by western blotting. Orange arrowheads denote ubiquitinated TOMM20
