

Structure of PepT2 reveals binding model for peptide recognition and enables a more rationalized approach to prodrug design.
Abstract
The SLC15 family of proton-coupled solute carriers PepT1 and PepT2 play a central role in human physiology as the principal route for acquiring and retaining dietary nitrogen. A remarkable feature of the SLC15 family is their extreme substrate promiscuity, which has enabled the targeting of these transporters for the improvement of oral bioavailability for several prodrug molecules. Although recent structural and biochemical studies on bacterial homologs have identified conserved sites of proton and peptide binding, the mechanism of peptide capture and ligand promiscuity remains unclear for mammalian family members. Here, we present the cryo–electron microscopy structure of the outward open conformation of the rat peptide transporter PepT2 in complex with an inhibitory nanobody. Our structure, combined with molecular dynamics simulations and biochemical and cell-based assays, establishes a framework for understanding peptide and prodrug recognition within this pharmaceutically important transporter family.
INTRODUCTION
Solute carrier (SLC) transporters play essential roles in regulating small-molecule transport across biological membranes and are critical for cellular homeostasis. The SLC15 family of proton-coupled peptide transporters is the principal route through which animals absorb and retain dietary nitrogen (1). Whereas ingested protein is absorbed across the intestinal brush border membrane via the plasma membrane peptide transporter, PepT1 (SLC15A1) (2), circulating peptides are retained in the body through reabsorption in the kidneys, where PepT2 (SLC15A2) acts to selectively reuptake peptides from the glomerular filtrate (Fig. 1A) (3).
Fig. 1. Functional characterization of PepT2 and the inhibitory nanobody D8.
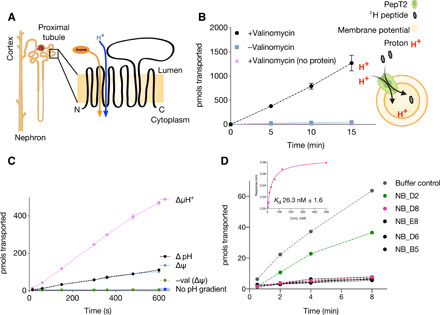
(A) Location of PepT2 within the kidney (indicated by a box) and topology schematic of mammalian peptide transporters. (B) PepT2 reconstituted into liposomes can uptake peptide in the presence of a membrane potential generated through the presence of valinomycin. The schematic shows the experimental setup used. (C) PepT2 is a proton-driven peptide transporter being able to use a membrane potential (Δψ, negative inside) or a pH gradient to drive peptide accumulation. The combination of both gradients (ΔμH+) results in increased transport. (D) Most of nanobodies (NBs) raised against PepT2 lacking the extracellular domain (ECD) could inhibit peptide uptake. The NB referred to as D8 was the one used to solve the structure of PepT2. Inset: NB_D8 has a dissociation constant (Kd) of ~26 nM for binding to full-length PepT2; a representative trace from the biolayer interferometry is shown with the calculated mean and SD (n = 3).
PepT2 is widely expressed in the human body, where, in addition to peptide retention in the kidney, the transporter also acts to regulate peptide transport across the blood-brain barrier in the choroid plexus (4). A remarkable feature of both PepT1 and PepT2 is their ability to recognize a diverse range of di- and tripeptide ligands (5), which results in these transporters playing an important role in drug transport, with well-known drug classes, including β-lactam antibiotics and several antiviral and anticancer drugs, being recognized and transported (6). PepT1 and PepT2 have been successfully targeted for the development of prodrugs, such as valacyclovir and valganciclovir, which exhibit improved oral bioavailability and retention in the human body through their ability to use PepT1 and PepT2 to cross the plasma membrane (7, 8). The location of PepT1 and PepT2 at sites of solute absorption makes these transporters excellent targets for improving drug uptake and retention in the human body (9). However, to date, structural information on the mammalian transporters is unavailable, hampering efforts to develop three-dimensional (3D) structural templates for peptide and drug recognition.
The SLC15 family form part of the proton-coupled oligopeptide transporter or POT family, members of which are widely distributed within pro- and eukaryotic genomes (10). POT family transporters belong to the major facilitator superfamily (MFS). They are all proton (H+)–driven symporters using the inwardly direct proton electrochemical gradient (ΔμH+) to drive the concentrative uptake of peptides across cell and organelle membranes (11). To date, a wide array of prokaryotic peptide transporters have successfully been used as model systems to study ligand recognition and transport within the POT family (12). However, despite numerous structures from different bacterial species, none have been captured in the outward-facing state, which is responsible for the initial capture of peptides and drugs from the extracellular side of the membrane. The bacterial structures have also been unable to inform on the structural relationship between the transporter and a large extracellular domain (ECD) unique to PepT1 and PepT2 and that is proposed to localize trypsin to the site of peptide transport (13).
To address these outstanding questions, we determined the structure of the mammalian PepT2 transporter from Rattus norvegicus to 3.5 Å resolution. The rat PepT2 protein shares 47% identity with human PepT1 and 83% identity with human PepT2 (fig. S1), making it an excellent model to understand mammalian proton-coupled peptide transport. An inhibitory nanobody was identified that stabilizes the ECD relative to the transport domain, establishing a method for structure determination of SLC transporters with dynamic accessory domains. In contrast to current structures, PepT2 adopts an outward open state, representing the transporter in the state primed for peptide and drug uptake from the renal filtrate. This previously unobserved conformation now enables a more complete model for alternating access transport to be proposed. In addition, the structure of PepT2, combined with molecular dynamics (MD) analysis of docked di- and tripeptide ligands, reveals the molecular basis for the extreme peptide promiscuity observed in the mammalian members of the SLC15 family. Thus, our results establish a model for understanding the role of mammalian SLC15 family transporters in peptide and prodrug transport across the plasma membrane.
RESULTS AND DISCUSSION
Identification of inhibitory nanobodies
To obtain the structure of a mammalian peptide transporter, we screened homologs from several different species to find a suitable target. The SLC15A2 homolog (PepT2) from the rat (R. norvegicus) was suitable for biophysical and biochemical characterization (fig. S2, A to D). Rat PepT2 showed robust proton-coupled transport in a reconstituted liposome system (Fig. 1B). We observed that either a pH gradient (ΔpH) or a membrane potential (Δψ) could drive transport and that the combination (ΔμH+) is additive (Fig. 1C), consistent with electrogenic transport (14). Rat PepT2 transports a wide range of peptides and a diverse range of clinically relevant drugs and prodrugs (fig. S2, C and D). Attempts at either vapor diffusion or lipid cubic phase (LCP) crystallization did not yield crystals. However, single-particle cryo–electron microscopy (cryo-EM) provided promising 2D class averages yet failed to produce a high-resolution reconstruction despite the use of different sample preparation techniques, including different detergents, amphipols, and nanodiscs in the presence or absence of a substrate. We reasoned that the failure to determine a high-resolution structure was due to the highly dynamic nature inherent to SLC transporters and the ECD specific to PepT2. To address this challenge, we sought to stabilize PepT2 through the addition of inhibitory nanobodies.
Initial attempts to obtain nanobodies were performed by immunizing against wild-type (WT) PepT2 reconstituted into liposomes. While this strategy was successful in generating specific nanobodies to the protein, all those tested were to the ECD of the transporter and none fully inhibited transport (fig. S2E). We therefore repeated immunization with reconstituted protein lacking the ECD (Δ410-603), which is still functional (fig. S2F). The engineered PepT2-ΔECD generated several nanobodies that were capable of inhibiting transport, with the lowest dissociation constant (Kd) of ~25 nM obtained for nanobody D8 (Fig. 1D and fig. S2G). Through the formation of a stable complex of WT PepT2 with the inhibitory nanobody D8, we successfully obtained the structure of PepT2 through cryo-EM to 3.5 Å (Table 1).
Table 1. Cryo-EM data collection, refinement, and validation statistics.
| PepT2-NB (EMDB-12528) (PDB 7NQK) | ||
|
Data collection and
processing |
||
| Magnification | 105,000 | 105,000 |
| Voltage (kV) | 300 | 300 |
| Electron exposure (e−/Å2) | 59.1 | 56.9 |
| Defocus range (μm) | 0.5–3.0 | 0.5–3.0 |
| Pixel size (Å) | 0.832 | 0.832 |
| Symmetry imposed | C1 | C1 |
| Initial particle images (no.) | 7,878,916 | 8,666,269 |
| Final particle images (no.) | 298,562 | |
| Map resolution (Å) | 3.5 | |
| FSC threshold | 0.143 | |
| Map resolution range (Å) | 3.5–4.5 | |
| Refinement | ||
| Initial model used (PDB code) | None | |
| Model resolution (Å) | 3.5 | |
| FSC threshold | 0.143 | |
| Model resolution range (Å) | 3.5–4.5 | |
| Map sharpening B factor (Å2) | −94.4 | |
| Model composition | ||
| Nonhydrogen atoms | 6139 | |
| Protein residues | 781 | |
| Ligands | 0 | |
| B factors (Å2) | ||
| Protein | 95.74 | |
| Ligand | N/A | |
| Root mean square deviations | ||
| Bond lengths (Å) | 0.005 | |
| Bond angles (°) | 0.841 | |
| Validation | ||
| MolProbity score | 2.22 | |
| Clashscore | 16.40 | |
| Poor rotamers (%) | 0.90 | |
| Ramachandran plot | ||
| Favored (%) | 91.38 | |
| Allowed (%) | 8.62 | |
| Disallowed (%) | 0.00 | |
Cryo-EM structure of PepT2
PepT2 consists of two domains, a transmembrane (TM) domain that functions to couple peptide recognition to proton-driven transport and a large ECD inserted between TM9 and TM10 (Fig. 1A and fig. S1) (13). The cryo-EM maps were of sufficient quality to build the complete structure of PepT2 de novo (Fig. 2A and fig. S3). The TM domain adopts the canonical MFS fold, with helices TM1 to TM6 forming the N-terminal bundle and helices TM7 to TM12 forming the C-terminal bundle. The ECD consists of two immunoglobulin G (IgG) domains that are linked in tandem and sits directly above the C-terminal bundle (Fig. 2B). The ECD makes only a single hydrogen bond to the transporter domain, through Arg553 to the backbone carbonyl group of Asn328 on TM7, which contains a large loop that extends out horizontally from the transporter before connecting to TM8. The inhibitory nanobody was clearly observed in the maps, with the CDR3 loop binding to side chains on TM1 and TM2 from the N-terminal bundle and β strands 13 to 14 and the loop between β strands 10 and 11 on the second IgG-2 in the ECD (Fig. 2C and fig. S4B). This configuration explains why the nanobody was instrumental in determining the structure, as it functions to stabilize the TM helices and ECD, fixing them in a single state that could be used for high-resolution reconstruction.
Fig. 2. Cryo-EM structure of PepT2.
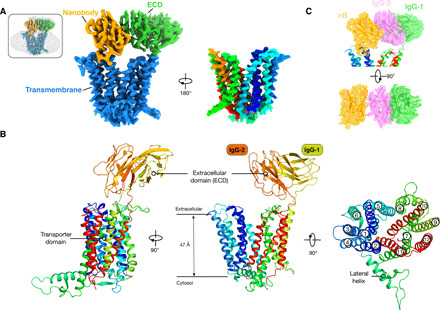
(A) Cryo-EM density of the PepT2 nanobody complex, contoured to a threshold level of 0.43. Left: The TM domain, ECD, and nanobody are represented in blue, green, and orange, respectively. Right: Rotated view of the TM domain, colored as rainbow. Inset: Superposition with lower contoured (threshold level of 0.13) volume to display the detergent micelle. (B) Cartoon representation of PepT2 highlighting the two domains, the membrane-embedded transport domain and the ECD composed of two IgG domains linked in tandem. (C) Cryo-EM density with overlaid model of ECD and nanobody. IgG-1 subdomain, IgG-2 subdomain, and nanobody are colored in green, violet, and orange, respectively. Map is contoured to a threshold level of 0.29.
Functionally, the ECD is thought to bind to extracellular trypsin, localizing the protease close to the TM domain to increase the efficiency of cationic peptide transport (13). An interesting question concerning the role of the ECD in mammalian peptide transport is whether this region is structurally rigid with respect to the transport domain or flexible, free to move around and capture nearby proteases. The structure reveals the latter model is more likely, as the ECD does not make any substantial contacts to the TM domain and is linked by flexible extensions from TM9 and TM10 (Fig. 2B). To test the degree of structural flexibility, we analyzed the movement of the ECD relative to the TM domain using MD (Fig. 3A). During MD simulations, we found that the ECD behaves as a rigid body with very little in the way of internal motions (fig. S5, A and B), consistent with previous studies on the isolated domain (13). Principal components analysis (PCA) on the trajectory demonstrates that most of the motion could be captured by the first four principal components (Fig. 3B), which can be assigned to translations in the x, y, and z axes and an additional rotation around the z axis (Fig. 3C). Our results show that the ECD does not occupy a fixed position with respect to the TM domain. Previously, we identified a potential binding site for trypsin (fig. S5C) (13), consisting of two conserved acidic side chains on the ECD (Asp576 and Glu599). The MD analysis supports the accessibility of this site for trypsin binding and would position the protease above the transporter domain facilitating peptide transport.
Fig. 3. PCA of the dynamic movements of the ECD of PepT2.
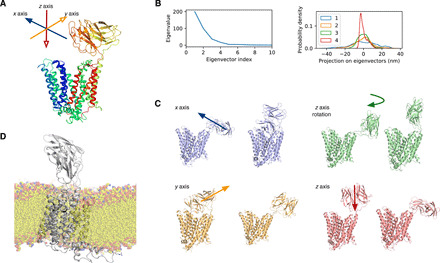
(A) Decomposition of the ECD domain motion by PCA showing that most motion can be captured by the first four eigenvectors, shown in (B). Projections of the first four eigenvectors show that the motions are normally centered on the mean with no distinctive hotspots. (C) The first four motions can be classified as an x- or y-plane translation (purple and orange) and rotation along the z axis (green) and a z-axis translation (red), which can be summarized as translations in all three dimensions and a rotation of the IgG along the z axis with respect to the membrane. (D) Snapshot of the simulations showing PepT2 in a lipid bilayer and the role of the lateral helix in stabilizing the position of the transporter domain. The conserved arginine side chains on the lateral helix are shown (gray sticks).
On the cytoplasmic side of the transporter, inserted between the N- and C-terminal bundles, is an intracellular domain, consisting of 42 amino acids. This domain is predominantly α-helical and extends away from the transporter at an approximate 90° angle (Fig. 2B). At the distal end of a long lateral helix that constitutes the bulk of this domain are two arginine side chains, which our MD analysis shows to stabilize this domain on the intracellular side of the membrane (Fig. 3D and fig. S5D). A similar intracellular domain is observed in the distantly related plant nitrate transporter NRT1.1 (15, 16), where it functions as a binding platform for signaling proteins, including kinases and transcription factors (17). Although PepT2 is not known to function as a signaling system in mammalian cells, it is posttranslationally regulated through the binding of PDZK1 (Putative PDZ domain-containing protein kinase 1), a member of the Na+/H+ exchanger regulator family of intracellular binding proteins (18). Binding of PDZK1 (NHERF3) to the C terminus of PepT2 results in a significant increase in the Vmax for peptide transport, which occurs under periods of high metabolic activity in the cell (19). The intracellular domain makes substantial interactions with TM7, a key gating helix in the MFS and sits close to the C terminus of TM12. Our structure thus suggests the kinetic effects observed following PDZK1 binding are likely to stem from modulation on the stability of TM7 and therefore affecting the gating dynamics of the transporter.
Outward open conformation
Contrary to previous POT family transporter structures, which have all adopted an inward open or inward occluded state (12), PepT2 adopts an outward open conformation (Fig. 2A). A large polar cavity extends from the extracellular side of the membrane and reaches down ~37 Å toward the intracellular gate, which is sealed to the inside of the cell (Fig. 4A). The intracellular gate is constructed by the close packing of the cytoplasmic ends of TM4 to TM5 with TM10 to TM11. The close packing of these four helices is stabilized through a salt bridge interaction between Asp170 on TM4 and Lys642 on TM11, both of which are strictly conserved within the mammalian and mammalian-like bacterial POT family members (Fig. 4B and fig. S1). In addition, several other side chains are conserved in this area of the protein and likely to facilitate the close packing of these helices. In particular, Pro162 on TM4, which packs against Gln646 on TM11, is located at the base of the binding pocket, acting as a pinch point in the transporter. A conserved feature of MFS transporters are pairs of salt bridge interactions that coordinate structural rearrangements during transport. In the extracellular gate, which is constructed from TM1 to TM2 and TM7 to TM8, a conserved histidine on TM1, His87, forms a salt bridge with Asp317 on TM7, which drives closure of the extracellular gate following peptide and proton binding (Fig. 4C) (20). The identity of the intracellular gate salt bridge, however, has remained elusive, owing to a lack of structural information on an outward open state. Our structure now reveals that the intracellular gate salt bridge is located much further down the transporter, in a region that would be accessible to the cytoplasm (Fig. 4C). This location is not the same as the previously suggested salt bridge interaction between a conserved lysine on TM4, Lys161, and glutamate on TM10, Glu622 (12). To investigate the importance of the newly identified salt bridge between TM4 and TM11, we analyzed variants of these side chains using a cell-based transport assay (Fig. 4, D and E). An Asp170Ala variant resulted in loss-of-transport function, while still being expressed at the plasma membrane (fig. S6). Similarly, its interaction partner Lys642 also displayed markedly reduced transport when mutated to alanine. These results confirm the importance of this salt bridge for coordinating structural rearrangements that result in opening the intracellular gate during transport. However, the location of the salt bridge on the cytoplasmic side of the transporter argues against a direct role in proton coupling or peptide binding. More likely, the role of this salt bridge is simply to stabilize the close packing of the intracellular gate helices in the outward open state. Last, a notable feature of the peptide binding site is a prominent dipole, which is located toward the bottom half of the cavity (Fig. 4B). The dipole is formed by Arg57 on TM1 and Lys161 on TM4, which sit opposite of Asp317 on TM7 and Glu622 on TM10. The dipole is a strictly conserved feature of the peptide binding site within the wider POT family and plays an important role in peptide recognition when the transporters adopt an inward-facing state (21, 22). As discussed below, these side chains also play essential roles in ligand recognition within the outward-facing state.
Fig. 4. Outward open conformation of PepT2.
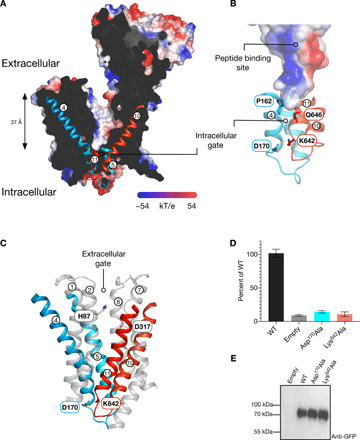
(A) Slice through the electrostatic surface representation of PepT2 as viewed in the plane of the membrane. The intracellular gating helices TM4 to TM5 and TM10 to TM11 are shown. (B) Zoomed-in view of the intracellular gate, with the key stabilizing interactions identified and labeled. (C) Cartoon representation showing the gating helices in PepT2. Key side chains involved in gate stabilization are shown. (D) Cell-based transport assays for PepT2 and variants of the intracellular gate–interacting side chains. (E) Western blot using an anti–green fluorescent protein (GFP) antibody to detect WT and variant forms of PepT2.
Structural basis for ligand promiscuity
An important physiological function for intestinal peptide transporters is the bulk uptake and retention of dietary peptides (23). To achieve this function, both PepT1 and PepT2 have evolved to recognize a diverse library of di- and tripeptides, with upper estimates at >8000 different combinations being recognized (5). The availability of the outward open state of PepT2 now enables a detailed analysis of the peptide binding site at the start of the transport cycle. To understand how the binding site accommodates peptides of different length and size, we used MD to dock peptides into to the binding site and supported these simulations with biochemical assays. We chose a small library of six peptides, where structural and biochemical information was already available from bacterial POT family homologs (21, 22, 24). Using a liposome-based assay, we calculated median inhibitory concentration (IC50) values for the six peptides (fig. S7D). The IC50 values were very similar, ranging from the tightest binding peptide l-Tyr-Tyr-Tyr (10 μM) to the weakest binding peptide l-Phe-Ala (60 μM). This result contrasts with peptide recognition in bacterial homologs, which show distinct preferences for smaller, hydrophobic dipeptides (24, 25) and suggests that PepT2, unlike its bacterial counterparts, does not discriminate based on peptide length.
To further understand peptide recognition, we used a strategy that combined docking with MD to predict the binding poses of dipeptides (l-Ala-Ala, l-Ala-Phe, and l-Phe-Ala) and tripeptides (l-Ala-Ala-Ala, l-Phe-Ala-Gln, and l-Tyr-Tyr-Tyr) (fig. S7A). AutoDock Vina (26) was used to generate initial docking poses for the peptides (fig. S7B), which were then relaxed through unbiased MD simulations. Representative binding poses were lastly obtained through clustering of four independent 100-ns-long trajectories for each peptide (fig. S7C). As a negative control, we used the amino acid l-alanine, which predictably failed to establish a stable binding position (fig. S8A), consistent with the inability of amino acids to inhibit transport (fig. S2C). In contrast, all di- and tripeptides established a stable binding pose after 100 ns (fig. S8, B to F). Next, we computed the absolute binding free energies (ABFE) based on these representative binding poses (fig. S7D). The calculated binding free energies correlated well with our previous IC50 values (Fig. 5A) {Spearman rank correlation: rs = 0.9, P = 0.04; Pearson correlation coefficient [ABFE versus log(IC50)]: r = 0.83, P = 0.08}, with the tightest binding peptide also being l-Tyr-Tyr-Tyr, with a calculated ΔG at −26 kcal mol−1 compared to the worst binding peptide, Phe-Ala, at −7 kcal mol−1.
Fig. 5. Peptide binding to PepT2.
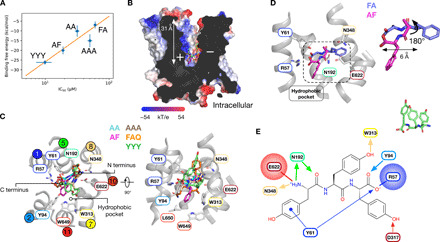
(A) Correlation between IC50 values and ABFE [Spearman rank correlation: rs = −0.9, P = 0.04; Pearson correlation coefficient, ABFE versus log(IC50): r = −0.83, P = 0.08]. (B) Slice through the electrostatic surface representation of PepT2, with the peptides shown overlaid in the binding site. (C) Close-up view of the binding site shown in (B). The five peptides are shown as different colored sticks, with key side chains shown in sticks and labeled. Side-chain positions are taken from the cryo-EM structure. (D) Zoomed-in view of the binding site showing the different binding poses for l-Ala-Phe (magenta) and l-Phe-Ala (purple). (E) Schematic of the peptide binding site, highlighting the key structural features (see text) for Tyr-Tyr-Tyr recognition. The final binding pose for Tyr-Tyr-Tyr is shown at the inset, top right. Arrows indicate direction of hydrogen bonds, with ionic interactions depicted as straight lines.
All of the peptides adopted a similar position at the base of the binding site, ~31 Å from the extracellular side of the membrane, with their N and C termini orientated with respect to the dipole within the cavity (Fig. 5B). A structural overlay of the peptides reveals a consistent pattern of interactions (Fig. 5C). Specifically, N termini all interacted with the conserved glutamate on TM10 (Glu622) and through hydrogen bonds to two further strictly conserved asparagines on TM5 (Asn192) and TM8 (Asn348). At the opposite end of the peptides, we observed that all of the C termini interact with Arg57, which forms part of a conserved ExxER57 motif on TM1 (24, 27). Both Arg57 and Glu622 are functionally critical side chains in the mechanism of proton-coupled peptide transport and variations of either abolish transport in both bacterial and mammalian members of the family (12). In addition to the conserved interaction at the N and C termini, all of the peptides project their N-terminal carbonyl groups toward Asn192. This enables the peptides to position the first side-chain group toward the binding site entrance, facilitating optimal interactions between the N terminus, asparagines 192 and 348, and Glu622 (Fig. 5D). The weakest binding peptide tested, l-Phe-Ala, is unable to adopt this pose. The position of the phenylalanine ring at the N terminus forces the peptide bond to rotate almost 180° relative to the other peptides, forcing the carbonyl group to extend toward the opening of the binding site. In this position, the carbonyl group is unable to interact with Asn192, and, subsequently, the tight interaction network is lost. The reduced interactions observed in the simulations explain why the presence of a carbonyl group close to the N terminus is a key determinant of high affinity binding to the mammalian transporters, as the carbonyl group acts to stabilize the interactions around the N terminus of the peptide ligands.
Previous studies on the bacterial homologs had identified several specificity pockets that accommodate different side-chain groups (21, 22) and highlighted the role of conserved tyrosine side chains in creating a promiscuous binding site (28). In particular, a conserved hydrophobic pocket was observed to form around the phenylalanine in the l-Ala-Phe complex with PepTSt (21). We observe similar pockets in the outward-facing state PepT2 (Fig. 5C), and our MD docking predicts an almost identical binding pose for the Ala-Phe peptide, with the phenylalanine side chain pointing toward the same hydrophobic pocket (Fig. 5D). This result suggests that the peptide is likely to remain stable during transport, with the transporter moving around the peptide.
Peptides interact with proteins in a wide variety of ways but are frequently held in an extended conformation, as observed previously in OppA, calmodulin, and major histocompatibility complex class I and class II molecules (29). A key question we wanted to address was how larger peptides, such as l-Tyr-Tyr-Tyr, are accommodated in PepT2, as these are similar in size to drug and prodrug ligands, such as cefadroxil and valacyclovir (30). Unlike the Phe-Ala peptide, where we observe the phenylalanine side chain binding into the hydrophobic pocket, the tyrosine side chains adopt a vertical orientation, in a crown-like arrangement (Fig. 5E). Specific interactions are made to conserved side chains—Tyr61, Tyr94, and Trp313—via hydrogen bonds. Unlike the Phe-Ala peptide, however, the first side chain does not orientate toward Glu622. Instead, the first tyrosine side chain interacts with Tyr61 through both a hydrogen bond and a π-π stacking interaction. Tyrosine-61 also coordinates the C terminus, helping to clamp the large peptide in place. Together, a substrate binding model for the outward open state of the mammalian SLC15 family can be summarized (Fig. 5E). The key features of this model build on earlier work (21, 22, 31–33) and confirm the critical importance of conserved acidic (Glu622) and basic (Arg57) side chains that clamp the N and C termini in place, respectively, with an ideal distance between these two interaction sites being 6 Å. The first carbonyl group is important for discriminating between high- and low-affinity ligands through the interaction with a conserved hydrogen bond donor (Asn192), which also coordinates the N terminus by acting as a hydrogen bond acceptor. In addition, the peptide binding poses explain how diverse side chains are accommodated through the presence of conserved aromatic residues (Tyr61, Tyr94, and Trp313), which can also contribute to hydrophobic and polar pockets where needed. Similar mechanisms of recognition have been observed in OppA, the periplasmic binding protein from the oligopeptide adenosine triphosphate–binding cassette transporter Opp, and the transporter associated with antigen processing (TAP). In these systems, which exhibit similar extreme promiscuity, peptide side chains are accommodated in cavities that are not sequence specific (34), whereas peptide length is also constrained through salt bridges to the N and C termini (35, 36). Last, the comparison between the outward open state of PepT2 and the inward open bacterial structures suggests that peptides are held rigidly, acting as a fulcrum around which the gating helices move during transport.
Initial engagement of peptides with the binding pocket is via N-terminal interactions
Given that all of the di- and tripeptides interacted with PepT2 via both their N and C termini, we sought to understand to what extent each terminus contributes to the binding mode and understand the likely sequence of peptide engagement. l-Ala-Ala-Ala was chosen as our model ligand because of its medium size and inert side chains. Potential of mean force (PMF) calculations show that engagement via the N terminus first yields a favorable free energy landscape, compared to an initial engagement via the C terminus (Fig. 6A). To gain a better understanding of the preference for the initial N-terminal engagement, we examined the interactions the peptide made with the binding site using MD. Binding proceeds via a hopping mechanism with the N terminus initially forming a salt bridge with Asp317 before transferring to Glu622 (Fig. 6B). In this position, the N terminus makes further interactions with Asn192 and Asn348, creating a stable binding pose (~−5 kcal/mol) that firmly locks the N terminus in place (Fig. 6C), confirming our previous docking results. Following N terminus binding, the C terminus interacts initially with Lys64 on TM1 before adopting its final position close to Arg57. The final stable binding pose is facilitated through interactions with the conserved tyrosine side chains within the binding site (Fig. 6D and movie S1) as described in our binding model.
Fig. 6. Binding of Ala-Ala-Ala proceeds via N-terminal engagement followed by C-terminal engagement.
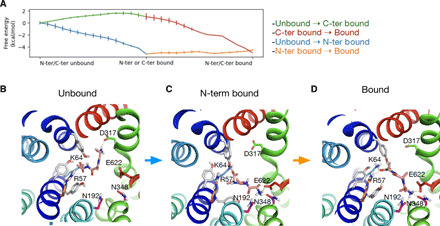
(A) Free energy calculations show that N-terminal engagement followed by C-terminal engagement is more energetically favorable. (B) The N terminus of Ala-Ala-Ala initially interacts with Asp317 before transferring to Glu622 and is further coordinated by Asn192 and Asn348. (C). Once the N terminus has formed a stable interaction, the C terminus engages with Arg57 from Lys64 and the movement is smoothened by Tyr60, Tyr61, and Tyr64 (D).
Structural analysis of inward and outward open states
MFS transporters contain a canonical 12 TM fold, which can be split into two six-helix bundles (Fig. 7A). Alternating access transport is thought to occur following the movement of these two bundles around a central binding site, although mechanistic differences are common between subfamilies of MFS transporters (37, 38). Although the POT family has been extensively studied, all current structures of bacterial members were captured in the inward open state, hampering efforts to understand the mechanism of alternating access transport within this family. The structure of PepT2 reported here now enables a detailed analysis of the key structural changes that occur during proton-coupled peptide transport. Previously, we identified a closely related mammalian-like bacterial homolog of the mammalian peptide transporters, PepTSo (28), and determined its structure to high resolution using LCP crystallization [Protein Data Bank (PDB): 4UVM] (39). Using the inward open structure of PepTSo, we analyzed the major conformational differences between the two structures to gain insight into the structural changes that occur during alternating access transport in the POT family. The superimposition reveals that the main structural changes between the outward- and inward-facing states of the two transporters reside in the N-terminal six-helix bundle, with very little structural change observed in the C-terminal bundle helices (Fig. 7B). The structural overlay reveals that TM1 and TM2 move toward TM7 and TM8, consistent with previous models for closure of the extracellular gate (39). TM1 and TM2 pivot forward ~35° in the inward open state relative to the outward open state, with the hinge point sitting close to Tyr94 on TM2 and Arg57 and Tyr61 on TM1. Similarly, TM4 and TM5 swing away in the opposite direction at ~42°, with the hinge point at Lys161, a conserved site of proton binding in the N-terminal bundle (24, 27). In the C-terminal bundle, we observe that TM11 rotates ~24° between the inward- and outward-facing states, and TM7 bulges near to Asp317. Unexpectedly, the small movements in the C-terminal bundle are inconsistent with previous transport models based on ligand-bound structures of PepTSt, another bacterial homolog (21, 24). However, we have previously shown that PepTSo and PepTSt operate via different mechanisms, with PepTSt able to couple transport di- and tripeptides to different numbers of protons, whereas PepTSo operates using a single mechanism (20, 40). A similar structural analysis comparing PepT2 to PepTSt reveals a different result to one obtained with PepTSo (fig. S9). When using PepTSt as the comparator, the main structural movements occur in the C-terminal bundle. We conclude from this analysis that, in keeping with two thermodynamic mechanisms of proton-coupled peptide transport, there likely exist at least two different mechanisms for structural changes within the POT family. These are the non–mammalian-like POT members, which are characterized by structural movements in the C-terminal domain, and the mammalian or mammalian-like bacterial homologs, which operate using a different mechanism where structural changes occur mostly in the N-terminal domain.
Fig. 7. Transport mechanism of PepT2.
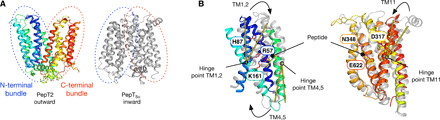
(A) Cartoon representation of PepT2 in the outward open state compared to PepTSo (PDB: 2XUT) in the inward open state. The N- and C-terminal six-helix bundles are marked with blue and red dotted lines, respectively. (B) Structural overlay of the N-terminal bundle (left) and C-terminal bundle (right) colored as in (A). The key structural changes in the N-terminal bundles are highlighted by yellow lines, showing the angles of movement in TM2, TM4, and TM11. Key side chains involved in peptide and proton binding are indicated (purple sticks) and labeled. The docked l-Ala-Phe peptide is shown for reference.
A model for proton-coupled transport by PepT2
The outward open structure of PepT2 reveals an important missing link in our understanding of alternating access within the POT family. Together with previous biochemical and structural studies on POT family peptide transporters, our current work enables a clearer understanding for a transport mechanism within the mammalian SLC15 family, which we have summarized in Fig. 8. In the outward-facing state, the transporter exposes a large polar cavity to the extracellular side of the membrane, which displays a strong dipole between the N- and C-terminal bundles. A conserved histidine on TM2, His87, is solvent accessible and protonated (i). A peptide enters the transporter via its N terminus, which is attracted to the solvent-exposed aspartic acid on TM7, Asp317. The peptide then moves down into the transporter, hopping from Asp317 to Glu622, a strictly conserved side chain on TM10 (movie S1). In this position, the peptide orientates within the binding site under the influence of the dipole, with the C terminus interacting with Arg57, part of the conserved ExxER57 motif on TM1 (ii) (Fig. 5). Side chains are accommodated within the various polar pockets, and conserved tyrosine side chains spread around the binding site. Once locked in place, TM1 to TM2 will move toward TM7 to TM8, closing the extracellular gate and stabilized by the interaction between His87 and Asp317. In this occluded state, the proton on His87 will transfer down, through Asp317 to Glu622 (iii). Proton binding to Glu622 will disrupt the interaction with the N terminus of the peptide. At the opposite end of the binding site, protonation of the conserved ExxER57 motif will lead to disruption of the interactions with Lys127 that hold TM4 to TM5 in place, enabling these helices to swing away and release both peptide and protons into the cytoplasm (iv). In the inward open state, a water-filled channel that forms from the extracellular side of the transporter down toward His87 enables the reprotonation of this side chain, weakening the interaction with TM7, and initiating the reorientation of the transporter to the outward-facing state, completing the cycle (i). This model assumes that neutral peptides are transported with two protons in the mammalian proteins, which we also propose is the minimal number for cotransport and consistent with previous electrophysiological studies (14, 41).
Fig. 8. Alternating access transport mechanism within the SLC15 family.
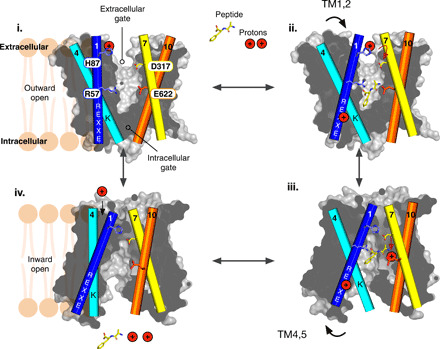
Schematic representation of the transport cycle for PepT2, detailed in the main text.
Prodrug recognition
Last, we wanted to explore how PepT2 would interact with prodrug molecules. To date, crystal structures of bacterial POT transporters PepTSh, from Staphylococcus hominis (PDB: 6GZ9), and DtpA, from Escherichia coli (PDB: 6GS4), have been reported in the inward open state and in complex with valacyclovir and valganciclovir, respectively (42, 43). Valacyclovir is a prodrug derivative of the antiviral agent acyclovir, which is used in the treatment of herpes virus and in the suppression of latent disease (44). Valacyclovir consists of an l-valine amino acid attached to the active acyclovir drug through an ester linkage, which creates a molecule that is recognized and transported by both PepT1 and PepT2 (7, 45). Valganciclovir was developed later to treat cytomegalovirus infections in patients with HIV/AIDS or following organ transplant (46) and differs in the presence of a methoxy group attached to the ester linkage. However, in the structure of DtpA, valganciclovir adopts a notably different pose to that of valacyclovir in PepTSh, flipped ~180° (47). Therefore, to probe the binding pose of valacyclovir in PepT2, we docked the prodrug using the binding poses from both PepTSh and DtpA. However, valacyclovir only yielded a stable binding pose in a position similar to that observed in PepTSh. We were unable to identify a binding pose similar to that observed in DtpA for valganciclovir. However, we previously postulated that DtpA might recognize prodrugs differently to the mammalian peptide transporters due to the presence of a pronounced discontinuity in TM10, which changes the size and shape of the binding site (47). In PepT2, TM10 adopts a standard helical configuration (Fig. 2), which likely explains the difference in binding positions between these two proteins.
Valacyclovir (PDB: TXC) sits in an elongated state in the binding pocket (Fig. 9A), with the positively charged amino group of the l-valine moiety making hydrogen bond interactions with Glu622, Asn192, and Asn348 (Fig. 9B), similar to the peptide ligands discussed above (Fig. 5C). The carbonyl group interacts with Tyr188 on TM5, which forms part of the highly conserved POT family PTR2_2 motif (FYxxINxG194), which plays an important role in peptide transport (48). Unlike the complex with PepTSh, we did not observe any interactions to either the ester or ether groups in the drug. However, the primary amine of the purine ring forms a stable hydrogen bound with Glu53, while the imidazole interacts with the Trp649. Glu53 forms part of the conserved ExxER57 motif on TM1 and plays a central role in proton coupling, while Trp649 on TM10 is part of the intracellular gate in the POT family (24). Superimposing the drug-bound structure reveals a notable similarity to the position of the tripeptide l-Phe-l-Ala-l-Gln [root mean square fluctuation (RMSF) of 0.8 Å], particularly with respect to the free N terminus of the amino acid (Fig. 9C). At the other end of the drug molecule, the amine group of acyclovir sits close to the side-chain carbonyl of l-Gln in the tripeptide, suggesting that the interaction with the ExxER57 motif is a conserved and necessary feature of ligand recognition. This binding pose would also accommodate valganciclovir, with the methoxy group extending out toward Tyr61, which, as discussed above, also plays a role in peptide binding. IC50 values for both prodrugs are similar (Fig. 9D), suggesting that the drugs interact with PepT2 in an analogous manner.
Fig. 9. Model for prodrug recognition by PepT2.
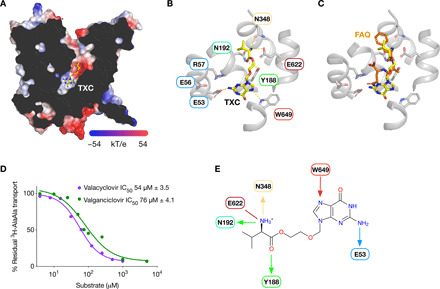
(A) Slice through the electrostatic surface representation of PepT2, showing the location of valacyclovir (PDB: TXC) docked into the peptide binding site. (B) Close-up view of the binding site shown in (A). (C) Structural overlay of the l-Phe-l-Ala-l-Gln peptide on the valacyclovir binding pose. (D) Representative IC50 curves for valacyclovir and valganciclovir reporting calculated means and SD (n = 3). (E) Schematic of valacyclovir binding site, highlighting the key structural features in prodrug recognition. Arrows indicate direction of hydrogen bonds, with ionic interactions depicted as straight lines.
Together, the interactions identified as playing important roles in valacyclovir binding are consistent with those identified for the physiological peptide ligands (Fig. 9E) (4, 31). In particular, the prodrug binding model identifies the importance of the free N-terminal α-amino group of the l-valine conjugate in recognition and transport. This requirement appears to extend to β-lactam antibiotics, as those without a free amino group show substantially reduced or, in many cases, no transport by PepT1 or PepT2 (4). In conclusion, the structure of the outward open state of PepT2, coupled with the insights into peptide and prodrug recognition, now enable a more rationalized approach to drug and prodrug design, targeting the intestinal and renal peptide transporters.
MATERIALS AND METHODS
Expression and purification
PepT2 (SLC15A2) from R. norvegicus (I.M.A.G.E. clone p970C0364D) was cloned into a modified pLexM vector (49) that contained a C-terminal His-tagged green fluorescent protein (GFP) with a TEV cleavage site between PepT2 and the GFP. The ECD was removed through overlap polymerase chain reaction (PCR), which removed amino acids 410 to 603, and cloned into plexm-tev-GFPHis. The plasmid is available through Addgene (167988).
The plasmids containing PepT2 were transiently transfected into human embryonic kidney–293F cells in the FreeStyle 293 Expression Medium (Thermo Fisher Scientific, UK). The cells were cultured in suspension phase at 37°C and 8% CO2. Eighteen to 24 hours before transfection, cells were passed at a density of 7 × 10⁵ cells/ml to give a density of 1.3 × 10⁶ to 1.4 × 10⁶ cells/ml at transfection. For the 2-liter culture, 2 mg of plasmid DNA was diluted in Dulbecco’s modified Eagle’s medium (Thermo Fisher Scientific, UK) to a total volume of 30 ml, it was mixed gently and left to stand for 5 min. In that time, 4 ml (from 1 mg/ml of stock) of linear polyethyleneimine (PEI) MAX (MW 40,000; Polysciences Inc., USA) was diluted in the same medium to a volume of 30 ml in a separate tube and mixed. The diluted PEI MAX was added to the diluted DNA and mixed gently. The mixture was incubated for 10 to 15 min at room temperature and was added dropwise to the cells with gentle swirling. Sodium butyrate was then added at 8 mM final concentration. Cells were returned to the incubator and harvested 36 hours after transfection and frozen until required.
The cell pellet was thawed and resuspended in ice-cold phosphate-buffered saline (PBS) containing deoxyribonuclease, and cells were subsequently lysed using a sonicator (Qsonica, USA), 8 cycles of 30-s on followed by 60-s off on ice. Unbroken cells and cell debris were pelleted at 10,000g for 10 min at 4°C, and membranes were harvested through centrifugation at 200,000g for 1 hour and washed once with 20 mM Hepes (pH 7.5) and 20 mM KCl. After washing, the membranes were resuspended in PBS and snap-frozen for storage at −80 until required.
Membranes were thawed and solubilized in 1× PBS, 150 mM NaCl, and 10% glycerol containing 1% n-dodecyl-β-d-maltopyranoside (DDM):cholesterol hemisuccinate (CHS) (5:1 ratio) for 90 min at 4°C. Insoluble material was removed through centrifugation for 1 hour at 200,000g. PepT2 was purified to homogeneity using standard immobilized metal affinity chromatography protocols in DDM detergent (Glycon, DE) with CHS (5:1 ratio DDM:CHS). Following TEV cleavage, the protease and cleaved His-tagged GFP were removed through nickel affinity chromatography, and the protein was subjected to size exclusion chromatography (Superdex 200) in a buffer consisting of 20 mM tris (pH 7.5) and 150 mM NaCl with 0.03% DDM and 0.006% CHS. Biotinylated PepT2 was produced by adding a C-terminal Avi tag before the TEV cleavage site within the vector. The protein was purified as for WT, following biotinylation by BirA overnight, the protein was subjected to a further size exclusion run.
Reconstitution into liposomes
PepT2 was reconstituted into liposomes consisting of a 3:1 palmitoyloleoylphosphatidylethanolamine:1-palmitoyl-2-oleoyl-sn-glycero-3-phospho-(1′-rac-glycerol) (POPE:POPG) using biobeads following procedures previously described (50). Chloroform was removed from the lipids (Avanti Polar Lipids, USA) through the use of a rotary evaporator to obtain a thin film. The lipids were washed twice in pentane and then resuspended at 12 mg ml−1 in lipid buffer [50 mM potassium phosphate (pH 7.5)]. These lipid vesicles were frozen and thawed twice in liquid nitrogen and stored at −80°C until required. For reconstitution, the lipids were thawed and then extruded first through a 0.8-μm filter and then through a 0.4-μm filter. Purified PepT2 in DDM:CHS (at 0.3 μg μl−1) was added to the lipids at a final lipid:protein ratio of 100:1 and incubated for 1 hour at room temperature and then for a further 1 hour on ice; for the no-protein liposome control, the same volume of gel filtration buffer containing 0.03% DDM and 0.006% CHS was added. After this time, biobeads were added in batches over 24 hours. Biobeads were removed, and the proteoliposomes were harvested by centrifugation at 120,000g for 40 min before resuspension in lipid buffer at a final protein concentration of 0.25 μg μl−1. They were subjected to three rounds of freeze-thawing in liquid nitrogen before storage at −80°C. The amount of protein (both WT and mutant variants) reconstituted into the lipids was quantified by SDS–polyacrylamide gel electrophoresis (PAGE) and densitometry. For immunization into llamas to raise nanobodies, either 0.6 mg of full-length ECDΔ or 0.6 mg of PepT2_ECDΔ was reconstituted into POPE:POPG (3:1) ratio at a lipid:protein ratio of 50:1 and resuspended at a final protein concentration of 0.8 mg/ml using the same method outlined above.
Transport assays
Transport assays were performed following procedures previously described in (50). Proteoliposomes were thawed, and the required amount of proteoliposomes was harvested through centrifugation before resuspending in inside buffer [typically 120 mM potassium acetate, 2 mM MgSO4, and 20 mM Hepes (pH 7.5)]. The liposomes were subjected to four rounds of freeze-thawing in liquid nitrogen to fully distribute the buffer and then extruded through a 0.2-μm filter. The proteoliposomes were diluted into the desired external buffer [typically 120 mM NaCl, 2 mM MgSO4, and 20 mM Hepes (pH 7.5)] containing peptide and trace amounts of 3H di-alanine or in the presence or absence of 1 μM valinomycin. The reaction was incubated at 30°C and stopped by rapidly filtering onto 0.22-μm filters, which were then washed with 2 × 2 ml of cold water. The amount of peptide transported inside the liposomes was calculated by scintillation counting in Ultima Gold (PerkinElmer) with comparison to a standard curve for the substrate. Experiments were performed a minimal of three times to generate an overall mean and SD.
Details of specific experiments
Experiments to show proton-coupled uptake (Fig. 1B) used 1 μg of protein per time point, and the inside buffer was 120 mM potassium chloride, 2 mM MgSO4, and 20 mM Hepes (pH 7.5). The outside buffer consisted of 120 mM NaCl, 2 mM MgSO4, and 20 mM Hepes (pH 7.5 or 6.8), with 1 μM valinomycin where required. Experiments in Fig. 1C used 0.4 μg of protein per time point. The buffers for ΔμH+ consisted of 120 mM potassium acetate, 2 mM MgSO4, and 20 mM Hepes (pH 7.5) for the inside buffer and 120 mM sodium chloride, 2 mM MgSO4, and 20 mM Hepes (pH 7.5) for the outside buffer in the presence of valinomycin. For ΔpH, acetate-induced pH gradients were used, and the outside buffer was 120 mM potassium chloride, 2 mM MgSO4, and 20 mM Hepes (pH 7.5) or 120 mM potassium acetate as the no pH control. For Δψ, the inside buffer was 120 mM potassium chloride, 2 mM MgSO4, and 20 mM Hepes (pH 7.5), and the outside buffer was 120 mM sodium chloride, 2 mM MgSO4, and 20 mM Hepes (pH 7.5), with valinomycin to generate the membrane potential or no valinomycin as the control.
To test inhibition of transport by nanobodies, the nanobodies were included at 500 μM in the inside and outside buffers with 0.5 μg of PepT2 used per time point. Transport was driven only using a membrane potential generated through valinomycin. For the pH optimum experiments, 0.5 μg of protein was used per time points and a final concentration of 50 μM di-alanine with trace amounts of 3H di-alanine. The internal buffer was 120 mM potassium chloride, 2 mM MgSO4, and 20 mM of the desired buffer, and external buffers used consisted of 120 mM NaCl, 2 mM MgSO4, and 20 mM buffer. The buffers used were MES (pH 6.0 to 6.5) or Hepes (pH 7.0 to 8.0) and tris for pH 8.5. Competition assays used ΔμH to drive transport for 4 min, with the competing substrate present at 100 μM or at varying concentrations to calculate the IC50. Counterflow experiments were performed using a buffer consisting of 50 mM sodium chloride, 2 mM MgSO4, and 20 mM Hepes (pH 7.5) on both the inside and outside. The inside contained 1 mM of the potential substrate of interest and the outside contained 25 μM di-alanine with trace amounts of 3H di-alanine. One microgram of protein was used per experiment, and the reaction was stopped after 4 min.
Cell-based peptide uptake assays
Transport assays were carried out with transiently transfected Hela cells, which were cultured in RPMI 1640 medium (supplemented with 10% fetal bovine serum, 2 mM l-glutamine, and the Gibco MEM Non-Essential Amino Acids) under 5% CO2 at 37°C. To transfect a 12-well plate, 2 × 10⁵ cells were seeded per well and, 24 hours later, transfected using Lipofectamine 2000 with PepT2 constructs in the vector plexm-tev-GFPHis. Assays were conducted 36 hours after transfection. Cells were washed three times with PBS (1 ml per well), before application of 0.5-ml assay buffer containing di-alanine with trace amounts of 3H di-alanine. The buffer consisted of 120 mM NaCl, 2 mM MgSO4, and 20 mM Hepes (pH 7.5). After the desired time, the assay buffer was removed, and the cells were quickly washed twice with 0.5-ml assay buffer with no peptide. Cells were removed from the plate using trypsin, placed in a scintillation vial containing 100 μl of 1 M NaOH, and lysed for 5 min before the addition of scintillation fluid. The amount of di-alanine taken up by the cells was calculated by scintillation counting in Ultima Gold (PerkinElmer) with comparison to a standard curve for the substrate. Experiments were performed for a minimal of four times to generate an overall mean and SD. To assess expression of the mutant variants within the cells, one well of each plate was harvested and lysed through freeze-thawing. Membranes were pelleted at 120,000g for 60 min, and the subsequent membrane pellet was solubilized in 20-μl PBS containing 1% DDM:CHS. Ten microliters of each sample was loaded onto an 8% SDS-PAGE gel, and Western blot was performed using an anti-GFP antibody. The data shown in Fig. 4D are a percentage compared to WT of the amount transported after 6 min; “empty” refers to cells transfected with the empty plasmid, pLexM-GFP.
Identification and screening of nanobodies
To identify PepT2-specific nanobodies, a library raised from immunization of a llama with reconstituted full length or ECD and screened using C-terminally biotinylated protein using a method modified from (51). Specifically, nanobodies were raised in a llama following intramuscular immunization with purified protein reconstituted into liposomes and using GERBU LQ 3000 as the adjuvant. Immunizations and handling of the llama were performed under the authority of the project license PPL 70/8108. Blood (150 ml) was collected, and peripheral blood mononuclear cells were prepared using Ficoll-Paque PLUS according to the manufacturers’ protocol. Total RNA was extracted using TRIzol and VHH cDNAs were generated by reverse transcription PCR using primer “CALL_GSP” (table S1). The pool of VHH encoding sequences were amplified by two rounds of nested PCR: first with “CALL_001” and “CALL_002,” followed by “VHH_For” and “VHH_Rev_IgG2” as well as “VHH_Rev_IgG3,” and cloned into the Sfi I sites of the phagemid vector pADL-23c. In this vector, the VHH encoding sequence is preceded by a pelB leader sequence followed by a linker, His6, and cMyc tag (GPGGQHHHHHHGAEQKLISEEDLS). Electrocompetent E. coli TG1 cells were transformed with the recombinant pAD-23c vector resulting in a VHH library of about 2 × 10⁸ independent transformants. The resulting TG1 library stock was then infected with M13K07 helper phage to obtain a library of VHH-presenting phages. Phages displaying VHHs specific for PepT2-ECDΔ were enriched after two rounds of biopanning on 50 and 5 nM biotinylated PepT2-ECDΔ, respectively, through capturing with Dynabeads M-280 (Thermo Fisher Scientific). Enrichment after each round of panning was determined by plating the cell culture with 10-fold serial dilutions. After the second round of panning, 93 individual phagemid clones were picked; VHH displaying phages were recovered by infection with M13K07 helper phage and tested for binding to PepT2-ECDΔ by enzyme-linked immunosorbent assay (ELISA). Phage binders were ranked according to the ELISA signal and grouped according to CDR3 sequence identity.
ELISA-positive clones were sequenced, and unique nanobodies were identified as previously described (50). These were further characterized using biolayer interferometry using an Octet Red385 (Sartorius) and streptavidin biosensors loaded with biotinylated PepT2 at 100 nM in 20 mM tris (pH 7.5), 150 mM NaCl, 0.03% DDM, and 0.006% CHS to compare kon and koff. To calculate Kd, a serial dilution of the nanobody from 500 to 3.9 nM was made, and following a 60-s baseline step, the nanobody was allowed to associate for 300 s followed by a dissociation step of 300 s. Data were analyzed in the Octet v9.0 software package and fit to a single binding site model in Prism. All raw data were baseline and reference subtracted, in-step corrected, y-axis aligned, and filtered with a Savitzky-Golay filter. The nanobodies exhibiting the slowest off rate were analyzed for coelution with PepT2 via size exclusion chromatography on a Superdex 200 column at pH 7.5 at 4°C.
Cryo-EM sample preparation and data acquisition
Cryo-EM sample preparation, data acquisition, and processing were carried out as described in (50). PepT2 after size exclusion was mixed with a 1.2 M excess of nanobody D8 and incubated on ice for at least 30 min, and the complex was separated via size exclusion chromatography as above. PepT2-nanobody complex was concentrated to 4.2 mg/ml and adsorbed to glow-discharged holey carbon-coated grids (Quantifoil 300 mesh, Au R1.2/1.3) for 10 s. Grids were then blotted for 2 s at 100% humidity at 8°C and frozen in liquid ethane using a Vitrobot Mark IV (Thermo Fisher Scientific).
Data were collected in counted super-resolution mode on a Titan Krios G3 (FEI) operating at 300 kV with a BioQuantum imaging filter (Gatan) and K3 direct detection camera (Gatan) at ×105,000 magnification, with a physical pixel size of 0.832 Å. Initially, 21,739 movies were collected at a dose rate of 22.2 e−/Å2 per second, exposure time of 2.66 s, corresponding to a total dose of 59.1 e−/Å2 over 40 fractions. An additional 22,805 movies were collected at a dose rate of 21.4 e−/Å2 per second, exposure time of 2.66 s, corresponding to a total dose of 56.9 e−/Å2 over 40 fractions.
Cryo-EM data processing
Movie processing was performed in real time using the SIMPLE pipeline (52), using SIMPLE-unblur for patched (15 × 10) motion correction, SIMPLE-CTFFIND for patched contrast transfer function estimation, and SIMPLE-picker for particle picking. After initial 2D classification in SIMPLE to remove junk particles, all subsequent processing was performed in either cryoSPARC (53) or RELION-3.1 (54) using the csparc2star.py script within UCSF pyem (55) to convert between formats. Resolution estimates were derived from gold-standard Fourier shell correlations (FSCs) using the 0.143 criterion as calculated within RELION-3.1 (54), cryoSPARC (v2.15.0) (53), or the remote 3DFSC (56) processing server. Local resolution estimations were calculated within RELION-3.1 (54).
The cryo-EM processing workflow for PepT2 is outlined in fig. S3. Briefly, after 2D classification in SIMPLE using cluster2D-stream to remove junk particles, a model was generated ab initio in SIMPLE (52). This initial model was low-pass–filtered to 30 Å and used as reference for unsupervised 3D classification in RELION-3.1 (54) against 2,055,487 particles selected from the initial dataset. TM helices were apparent in only one class; particles (510,976) belonging to this class were subjected to 3D autorefinement in RELION resulting in a map of modest resolution (6.9 Å). This map was low-pass–filtered to 20 Å and used as reference for unsupervised 3D classification against 1,826,753 “cleaned” particles from the later dataset, generating a class with 338,477 particles that produced a moderate resolution map (7.1 Å) after 3D autorefinement in RELION-3.1. Refined particle subsets from both datasets were Bayesian polished in RELION-3.1, combined, and subjected to reference-free 2D classification (k = 200) in cryoSPARC. cryoSPARC multiclass ab initio reconstruction from these particles (463,053) in cryoSPARC generated two volumes with strong TM helices and one “junk” volume.
Larger particle subsets from earlier within the processing pipeline were imported into cryoSPARC and subjected to two rounds of 2D classification (k = 200 for each round) followed by heterogeneous refinement against the three ab initio maps, low-pass–filtered to 8 Å. Particles belonging to the two best classes were subjected to nonuniform refinements (57) against their corresponding 8 Å low-pass–filtered maps, generating volumes with global resolution estimates of 6.4 or 4.7 Å. While density for the TM helices and nanobody were consistent across both volumes, density for the second IgG domain within the ECD was stronger in the 4.7 Å map due to packing against the nanobody, resulting in a stabilized conformation. Particles belonging to the higher-resolution reconstruction (437,817) were imported into RELION-3.1 and Bayesian polished in a 320 × 320 box followed by another round of multiclass heterogeneous refinement in cryoSPARC against the same 8 Å low-pass–filtered reference maps as previous. Particles (298,562) belonging to the strongest class were subjected to cryoSPARC nonuniform refinement, generating an improved 3.8 Å map. Map quality was further improved to 3.5 Å by local nonuniform refinement in cryoSPARC using prior orientations, an 8 Å of low-pass–filtered reference, and a soft mask encompassing only protein.
Model building and refinement
Guided by docking of a generic nanobody and the ECD of R. norvegicus PepT2 (PDB 5A9H), the model of PepT2 (Table 1) was generated de novo from the globally sharpened 3.5 Å map following multiple rounds of manual building using Coot v.0.9 (58) and real-space refinement in PHENIX v.1.18.2-3874 (59) using secondary structure, rotamer, and Ramachandran restraints. PepT2 model was validated using MolProbity (60) within PHENIX. Figures were prepared using UCSF ChimeraX v.1.1 (61) and PyMOL v.2.4.0 (The PyMOL Molecular Graphics System, v.2.0; Schrödinger).
Molecular docking and pose refinement by MD
The protein and the ligand were prepared with the prepare_ligand4.py and prepare_receptor4.py from MGLTools 1.5.6. Docking was performed with smina (62) using the AutoDock Vina scoring function (26). The smina search space was defined using the autobox_ligand option based on the location of the dipeptide AF from the superimposed bacterial POT homolog (PDB: 4d2c and 4d2d) (21). All nine generated binding poses generated by smina were used.
The protein was embedded into a 1-palmitoyl-2-oleoyl-sn-glycero-3-phosphocholine membrane using the coarse-grain (martini_3.0.b.3.2) self-assembly protocol (63). The membrane was edited to a ratio of POPE:POPG = 3:1 and equilibrated for a further of 1 μs. The resulting coordinates were then converted to an atomistic representation by cg2at (64), which was then energy-minimized and equilibrated in a constant number, volume and temperature (NVT) ensemble with V-rescale (65) at 310 K for 200 ps and then in a constant number, pressure and temperature (NPT) ensemble with the Berendsen barostat at 1 bar (66) and the Nosé-Hoover thermostat (67) at 310 K for 25 ns. The nine binding poses obtained from docking were superimposed onto the protein, solvated with TIP3P (68) water, and neutralized with NaCl to a concentration of 0.15 M.
For each ligand (alanine, AF, FA, AA, AAA, FAQ, and YYY), four repeats were run with 200-ps NVT and 1-ns NPT equilibration followed by 100-ns production runs with the Parrinello-Rahman barostat (69) at 1 bar. The resulting trajectory for each ligand is clustered with the GROMACS 2020 (70) single linkage clustering function, and the frame from the largest cluster with the smallest average root mean square deviation (RMSD) from all other structures of that cluster was selected as the representative binding pose. To assess binding stability of ligand binding, the RMSD of the ligand was computed with respect to both the representative frame of the largest cluster and the initial docking pose, while the trajectory was superimposed via the Cα of the residues within 10 Å of the ligand.
We superimposed the binding pose of valacyclovir from PepTSh (PDB: 6GZ9) and valganciclovir from DtpA (PDB: 6GS4) to rPepT2. For the binding pose from PepTSh, three distance restraints were imposed between the oxygen from Glu622, Asn192, and Asn348 to the nitrogen from the valine group of valacyclovir at 0.3 nm with a force constant of 1000 kj/mol per nm2. Replica exchange with solute tempering (71) was used to enhance the sampling of ligand conformation at 310, 385, 475, 575, 676, 777, 878, and 979 K (72). The resulting trajectory at 310 K was then clustered with gmx (70) cluster in the same fashion as the di- and tripeptides. The representative frame of the largest cluster was then used for an extra 100 ns of unbiased simulation where RMSF calculations were used to assess stability.
ECD motion analysis
The motion of the ECD was analyzed by concatenating all the trajectories from nine ligands, nine binding poses, and four repeats. The resulting trajectory was superimposed via the Cα of the TMD (residue IDs 4-404 and 606-707), and the RMSF was computed for the Cα of all residues. The RMSF of the ECD was also computed when the trajectory was superimposed via the Cα of the ECD (residue ID 413-599). To perform PCA, the whole trajectory was superimposed via the Cα of the TMD, and the covariance matrix was computed for the ECD with gmx covar. The eigenvalues and eigenvectors were computed on the basis of the covariance matrix and were done with gmx anaeig.
ABFE calculation
To obtain the ABFE of the ligands in the protein, Boresch restraint (73)–based calculations described previously by us (74) were used. The MDRestraintsGenerator (https://github.com/bigginlab/MDRestraintsGenerator) was used for generating the restraint for each ligand. For each ligand, three repeats were run with 200 ps of NVT and 1 ns of NPT equilibration followed by 30 ns of production with replica exchange performed every 1000 steps. The results were analyzed using alchemical analysis (75).
PMF calculation
To obtain the free energy of disengaging the N terminus or the C terminus from the binding pocket, umbrella sampling was used. Two collective variables (CVs) were defined as the distance between the N terminus (name: N) and Glu622:OE1 and between the C terminus (atom name: OC2) and Arg57:NH2. For the route of initial N-terminal disengagement followed by C-terminal disengagement, the C-terminal distance was kept constant at 0.3 nm at 1000 kj/mol per nm2, while the N-terminal distance was restrained from 0.3 to 1.0 nm with a step of 0.05 nm at 1000 kj/mol per nm2. This was followed by keeping the N-terminal distance at 1.0 nm, while the C-terminal distance was restrained from 0.3 to 1.0 nm with a step of 0.05 nm at 1000 kj/mol per nm2. For the route of initial C-terminal disengagement followed by N-terminal disengagement, the N-terminal distance was fixed at 0.3 nm, while the C-terminal distance was changed from 0.3 to 1.0 nm, which was followed by fixing the C-terminal distance at 1.0 nm and moving the N-terminal distance from 0.3 to 1.0 nm. The initial frames were generated using steered MD, where the CV was moved gradually from 0.3 to 1.0 nm across the 100-ns simulation. The production run was performed for 100 ns with replica exchanged performed every 1000 steps preceded by 200 ps of NVT and 1 ns of NPT equilibration. The free energy landscape was recovered with WHAM (weighted histogram analysis method) (76). Three runs were performed, where the SD was derived. Analysis of hydrogen bonds was computed with MDAnalysis (77, 78).
Acknowledgments
We thank T. Sobajima for assistance with fluorescence microscopy. Funding: The Central Oxford Structural Microscopy and Imaging Centre is supported by the Wellcome Trust (201536), The EPA Cephalosporin Trust, and a Royal Society/Wolfson Foundation Laboratory Refurbishment grant (WL160052). Computing was supported via the Advanced Research Computing facility, Oxford; the ARCHER UK National Supercomputing Service; and JADE (EP/T022205/1) granted via the High-End Computing Consortium for Biomolecular Simulation (HECBioSim; www.hecbiosim.ac.uk), supported by the EPSRC (EP/R029407/1). This research was supported by Wellcome Awards to S.M.L. (209194 and 100298), P.C.B. (219531), and S.N. (215519 and 219531) and through MRC grants to S.M.L. (MR/M011984/1) and J.L.P. (MR/S021043/1). Z.W. is a Wellcome Trust Ph.D. student (203741). Author contributions: J.L.P. and S.N. conceived the project. G.K. maintained cell stocks and undertook large-scale expression and tissue culture. S.N. and J.L.P. performed all protein preparation. J.H. and R.J.O. generated and screened the llama library. J.C.D. and S.M.L. performed all cryo-EM sample processing, data collection, and image analysis. J.C.D., S.M.L., and S.N. constructed the atomic models. J.L.P. conducted all transport and biochemical assays. Z.W. and P.C.B. performed all MD analysis. J.L.P. and S.N. wrote the manuscript and prepared figures with contributions and discussions from Z.W., P.C.B., J.C.D., and S.M.L. Competing interests: The authors declare that they have no competing interests. Data and materials availability: Atomic coordinates for PepT2 have been deposited in the PDB under ID 7NQK and maps in Electron Microscopy Data Bank under ID 12528. The plasmids for expression of rat PepT2 and the nanobody have been deposited in Addgene under IDs 167988 and 167989. All data needed to evaluate the conclusions in the paper are present in the paper and/or the Supplementary Materials.
SUPPLEMENTARY MATERIALS
Supplementary material for this article is available at http://advances.sciencemag.org/cgi/content/full/7/35/eabh3355/DC1
REFERENCES AND NOTES
- 1.D. M. Matthews, in Protein Absorption: Development and Present State of the Subject (Wiley-Liss, 1991), pp. 414. [Google Scholar]
- 2.Fei Y. J., Kanai Y., Nussberger S., Ganapathy V., Leibach F. H., Romero M. F., Singh S. K., Boron W. F., Hediger M. A., Expression cloning of a mammalian proton-coupled oligopeptide transporter. Nature 368, 563–566 (1994). [DOI] [PubMed] [Google Scholar]
- 3.Daniel H., Rubio-Aliaga I., An update on renal peptide transporters. Am. J. Physiol. Renal Physiol. 284, F885–F892 (2003). [DOI] [PubMed] [Google Scholar]
- 4.Brandsch M., Knütter I., Bosse-Doenecke E., Pharmaceutical and pharmacological importance of peptide transporters. J. Pharm. Pharmacol. 60, 543–585 (2008). [DOI] [PubMed] [Google Scholar]
- 5.Ito K., Hikida A., Kawai S., Lan V. T. T., Motoyama T., Kitagawa S., Yoshikawa Y., Kato R., Kawarasaki Y., Analysing the substrate multispecificity of a proton-coupled oligopeptide transporter using a dipeptide library. Nat. Commun. 4, 2502 (2013). [DOI] [PMC free article] [PubMed] [Google Scholar]
- 6.Brandsch M., Drug transport via the intestinal peptide transporter PepT1. Curr. Opin. Pharmacol. 13, 881–887 (2013). [DOI] [PubMed] [Google Scholar]
- 7.Ganapathy M. E., Huang W., Wang H., Ganapathy V., Leibach F. H., Valacyclovir: A substrate for the intestinal and renal peptide transporters PEPT1 and PEPT2. Biochem. Biophys. Res. Commun. 246, 470–475 (1998). [DOI] [PubMed] [Google Scholar]
- 8.Sugawara M., Huang W., Fei Y. J., Leibach F. H., Ganapathy V., Ganapathy M. E., Transport of valganciclovir, a ganciclovir prodrug, via peptide transporters PEPT1 and PEPT2. J. Pharm. Sci. 89, 781–789 (2000). [DOI] [PubMed] [Google Scholar]
- 9.Colas C., Ung P. M.-U., Schlessinger A., SLC transporters: Structure, function, and drug discovery. Med. Chem. Commun. 7, 1069–1081 (2016). [DOI] [PMC free article] [PubMed] [Google Scholar]
- 10.Daniel H., Spanier B., Kottra G., Weitz D., From bacteria to man: Archaic proton-dependent peptide transporters at work. Physiology 21, 93–102 (2006). [DOI] [PubMed] [Google Scholar]
- 11.Daniel H., Kottra G., The proton oligopeptide cotransporter family SLC15 in physiology and pharmacology. Pflügers Arch. 447, 610–618 (2004). [DOI] [PubMed] [Google Scholar]
- 12.Newstead S., Recent advances in understanding proton coupled peptide transport via the POT family. Curr. Opin. Struct. Biol. 45, 17–24 (2017). [DOI] [PMC free article] [PubMed] [Google Scholar]
- 13.Beale J. H., Parker J. L., Samsudin F., Barrett A. L., Senan A., Bird L. E., Scott D., Owens R. J., Sansom M. S. P., Tucker S. J., Meredith D., Fowler P. W., Newstead S., Crystal structures of the extracellular domain from PepT1 and PepT2 provide novel insights into mammalian peptide transport. Structure 23, 1889–1899 (2015). [DOI] [PMC free article] [PubMed] [Google Scholar]
- 14.Chen X.-Z., Zhu T., Smith D. E., Hediger M. A., Stoichiometry and kinetics of the high-affinity H+-coupled peptide transporter PepT2. J. Biol. Chem. 274, 2773–2779 (1999). [DOI] [PubMed] [Google Scholar]
- 15.Sun J., Bankston J. R., Payandeh J., Hinds T. R., Zagotta W. N., Zheng N., Crystal structure of the plant dual-affinity nitrate transporter NRT1.1. Nature 507, 73–77 (2014). [DOI] [PMC free article] [PubMed] [Google Scholar]
- 16.Parker J. L., Newstead S., Molecular basis of nitrate uptake by the plant nitrate transporter NRT1.1. Nature 507, 68–72 (2014). [DOI] [PMC free article] [PubMed] [Google Scholar]
- 17.Ho C.-H., Lin S.-H., Hu H.-C., Tsay Y.-F., CHL1 functions as a nitrate sensor in plants. Cell 138, 1184–1194 (2009). [DOI] [PubMed] [Google Scholar]
- 18.Hajizadeh N. R., Pieprzyk J., Skopintsev P., Flayhan A., Svergun D. I., Löw C., Probing the architecture of a multi-PDZ domain protein: Structure of PDZK1 in solution. Structure 26, 1522–1533.e5 (2018). [DOI] [PubMed] [Google Scholar]
- 19.Noshiro R., Anzai N., Sakata T., Miyazaki H., Terada T., Shin H. J., He X., Miura D., Inui K., Kanai Y., Endou H., The PDZ domain protein PDZK1 interacts with human peptide transporter PEPT2 and enhances its transport activity. Kidney Int. 70, 275–282 (2006). [DOI] [PubMed] [Google Scholar]
- 20.Parker J. L., Li C., Brinth A., Wang Z., Vogeley L., Solcan N., Ledderboge-Vucinic G., Swanson J. M. J., Caffrey M., Voth G. A., Newstead S., Proton movement and coupling in the POT family of peptide transporters. Proc. Natl. Acad. Sci. U.S.A. 114, 13182–13187 (2017). [DOI] [PMC free article] [PubMed] [Google Scholar]
- 21.Lyons J. A., Parker J. L., Solcan N., Brinth A., Li D., Shah S. T. A., Caffrey M., Newstead S., Structural basis for polyspecificity in the POT family of proton-coupled oligopeptide transporters. EMBO Rep. 15, 886–893 (2014). [DOI] [PMC free article] [PubMed] [Google Scholar]
- 22.Martinez Molledo M., Quistgaard E. M., Flayhan A., Pieprzyk J., Löw C., Multispecific substrate recognition in a proton-dependent oligopeptide transporter. Structure 26, 467–476.e4 (2018). [DOI] [PMC free article] [PubMed] [Google Scholar]
- 23.Smith D. E., Clemencon B., Hediger M. A., Proton-coupled oligopeptide transporter family SLC15: Physiological, pharmacological and pathological implications. Mol. Aspects Med. 34, 323–336 (2013). [DOI] [PMC free article] [PubMed] [Google Scholar]
- 24.Solcan N., Kwok J., Fowler P. W., Cameron A. D., Drew D., Iwata S., Newstead S., Alternating access mechanism in the POT family of oligopeptide transporters. EMBO J. 31, 3411–3421 (2012). [DOI] [PMC free article] [PubMed] [Google Scholar]
- 25.Harder D., Stolz J., Casagrande F., Obrdlik P., Weitz D., Fotiadis D., Daniel H., DtpB (YhiP) and DtpA (TppB, YdgR) are prototypical proton-dependent peptide transporters of Escherichia coli. FEBS J. 275, 3290–3298 (2008). [DOI] [PubMed] [Google Scholar]
- 26.Trott O., Olson A. J., AutoDock Vina: Improving the speed and accuracy of docking with a new scoring function, efficient optimization, and multithreading. J. Comput. Chem. 31, 455–461 (2010). [DOI] [PMC free article] [PubMed] [Google Scholar]
- 27.Aduri N. G., Prabhala B. K., Ernst H. A., Jørgensen F. S., Olsen L., Mirza O., Salt bridge swapping in the EXXERFXYY motif of proton-coupled oligopeptide transporters. J. Biol. Chem. 290, 29931–29940 (2015). [DOI] [PMC free article] [PubMed] [Google Scholar]
- 28.Newstead S., Drew D., Cameron A. D., Postis V. L. G., Xia X., Fowler P. W., Ingram J. C., Carpenter E. P., Sansom M. S. P., McPherson M. J., Baldwin S. A., Iwata S., Crystal structure of a prokaryotic homologue of the mammalian oligopeptide-proton symporters, PepT1 and PepT2. EMBO J. 30, 417–426 (2011). [DOI] [PMC free article] [PubMed] [Google Scholar]
- 29.Stanfield R. L., Wilson I. A., Protein-peptide interactions. Curr. Opin. Struct. Biol. 5, 103–113 (1995). [DOI] [PubMed] [Google Scholar]
- 30.Brandsch M., Transport of drugs by proton-coupled peptide transporters: Pearls and pitfalls. Expert Opin. Drug Metab. Toxicol. 5, 887–905 (2009). [DOI] [PubMed] [Google Scholar]
- 31.Bailey P. D., Boyd C. A., Bronk J. R., Collier I. D., Meredith D., Morgan K. M., Temple C. S., How to make drugs orally active: A substrate template for peptide transporter PepT1. Angew. Chem. Int. Ed. 39, 505–508 (2000). [DOI] [PubMed] [Google Scholar]
- 32.Våbenø J., Lejon T., Nielsen C. U., Steffansen B., Chen W., Ouyang H., Borchardt R. T., Luthman K., Phe-Gly dipeptidomimetics designed for the di-/tripeptide transporters PEPT1 and PEPT2: Synthesis and biological investigations. J. Med. Chem. 47, 1060–1069 (2004). [DOI] [PubMed] [Google Scholar]
- 33.Colas C., Masuda M., Sugio K., Miyauchi S., Hu Y., Smith D. E., Schlessinger A., Chemical modulation of the human oligopeptide transporter 1, hPepT1. Mol. Pharm. 14, 4685–4693 (2017). [DOI] [PMC free article] [PubMed] [Google Scholar]
- 34.Berntsson R. P.-A., Doeven M. K., Fusetti F., Duurkens R. H., Sengupta D., Marrink S.-J., Thunnissen A.-M. W. H., Poolman B., Slotboom D.-J., The structural basis for peptide selection by the transport receptor OppA. EMBO J. 28, 1332–1340 (2009). [DOI] [PMC free article] [PubMed] [Google Scholar]
- 35.Tame J. R., Murshudov G. N., Dodson E. J., Neil T. K., Dodson G. G., Higgins C. F., Wilkinson A. J., The structural basis of sequence-independent peptide binding by OppA protein. Science 264, 1578–1581 (1994). [DOI] [PubMed] [Google Scholar]
- 36.Lehnert E., Mao J., Mehdipour A. R., Hummer G., Abele R., Glaubitz C., Tampé R., Antigenic peptide recognition on the human ABC transporter TAP resolved by DNP-enhanced solid-state NMR spectroscopy. J. Am. Chem. Soc. 138, 13967–13974 (2016). [DOI] [PubMed] [Google Scholar]
- 37.Quistgaard E. M., Low C., Guettou F., Nordlund P., Understanding transport by the major facilitator superfamily (MFS): Structures pave the way. Nat. Rev. Mol. Cell Biol. 17, 123–132 (2016). [DOI] [PubMed] [Google Scholar]
- 38.Yan N., Structural biology of the major facilitator superfamily transporters. Annu. Rev. Biophys. 44, 257–283 (2015). [DOI] [PubMed] [Google Scholar]
- 39.Fowler P. W., Orwick-Rydmark M., Radestock S., Solcan N., Dijkman P. M., Lyons J. A., Kwok J., Caffrey M., Watts A., Forrest L. R., Newstead S., Gating topology of the proton-coupled oligopeptide symporters. Structure 23, 290–301 (2015). [DOI] [PMC free article] [PubMed] [Google Scholar]
- 40.Parker J. L., Mindell J. A., Newstead S., Thermodynamic evidence for a dual transport mechanism in a POT peptide transporter. eLife 3, e04273 (2014). [DOI] [PMC free article] [PubMed] [Google Scholar]
- 41.Steel A., Nussberger S., Romero M. F., Boron W. F., Boyd C. A., Hediger M. A., Stoichiometry and pH dependence of the rabbit proton-dependent oligopeptide transporter PepT1. J. Physiol. 498, 563–569 (1997). [DOI] [PMC free article] [PubMed] [Google Scholar]
- 42.Minhas G. S., Newstead S., Structural basis for prodrug recognition by the SLC15 family of proton-coupled peptide transporters. Proc. Natl. Acad. Sci. U.S.A. 116, 804–809 (2019). [DOI] [PMC free article] [PubMed] [Google Scholar]
- 43.Ural-Blimke Y., Flayhan A., Strauss J., Rantos V., Bartels K., Nielsen R., Pardon E., Steyaert J., Kosinski J., Quistgaard E. M., Löw C., Structure of prototypic peptide transporter DtpA from E. coli in complex with valganciclovir provides insights into drug binding of human PepT1. J. Am. Chem. Soc. 141, 2404–2412 (2019). [DOI] [PubMed] [Google Scholar]
- 44.Perry C. M., Faulds D., Valaciclovir. A review of its antiviral activity, pharmacokinetic properties and therapeutic efficacy in herpesvirus infections. Drugs 52, 754–772 (1996). [DOI] [PubMed] [Google Scholar]
- 45.Yang B., Smith D. E., Significance of peptide transporter 1 in the intestinal permeability of valacyclovir in wild-type and PepT1 knockout mice. Drug Metab. Dispos. 41, 608–614 (2013). [DOI] [PMC free article] [PubMed] [Google Scholar]
- 46.Eid A. J., Razonable R. R., New developments in the management of cytomegalovirus infection after solid organ transplantation. Drugs 70, 965–981 (2010). [DOI] [PubMed] [Google Scholar]
- 47.Minhas G. S., Newstead S., Recent advances in understanding prodrug transport through the SLC15 family of proton-coupled transporters. Biochem. Soc. Trans. 48, 337–346 (2020). [DOI] [PMC free article] [PubMed] [Google Scholar]
- 48.Hauser M., Kauffman S., Naider F., Becker J. M., Substrate preference is altered by mutations in the fifth transmembrane domain of Ptr2p, the di/tri-peptide transporter of Saccharomyces cerevisiae. Mol. Membr. Biol. 22, 215–227 (2005). [DOI] [PubMed] [Google Scholar]
- 49.Elegheert J., Behiels E., Bishop B., Scott S., Woolley R. E., Griffiths S. C., Byrne E. F. X., Chang V. T., Stuart D. I., Jones E. Y., Siebold C., Aricescu A. R., Lentiviral transduction of mammalian cells for fast, scalable and high-level production of soluble and membrane proteins. Nat. Protoc. 13, 2991–3017 (2018). [DOI] [PMC free article] [PubMed] [Google Scholar]
- 50.Parker J. L., Deme J. C., Kuteyi G., Wu Z., Huo J., Goldman I. D., Owens R. J., Biggin P. C., Lea S. M., Newstead S., Structural basis of antifolate recognition and transport by PCFT. Nature 595, 130–134 (2021). [DOI] [PMC free article] [PubMed] [Google Scholar]
- 51.Pardon E., Laeremans T., Triest S., Rasmussen S. G. F., Wohlkönig A., Ruf A., Muyldermans S., Hol W. G. J., Kobilka B. K., Steyaert J., A general protocol for the generation of Nanobodies for structural biology. Nat. Protoc. 9, 674–693 (2014). [DOI] [PMC free article] [PubMed] [Google Scholar]
- 52.Caesar J., Reboul C. F., Machello C., Kiesewetter S., Tang M. L., Deme J. C., Johnson S., Elmlund D., Lea S. M., Elmlund H., SIMPLE 3.0. Stream single-particle cryo-EM analysis in real time. J. Struct. Biol. X 4, 100040 (2020). [DOI] [PMC free article] [PubMed] [Google Scholar]
- 53.Punjani A., Rubinstein J. L., Fleet D. J., Brubaker M. A., cryoSPARC: Algorithms for rapid unsupervised cryo-EM structure determination. Nat. Methods 14, 290–296 (2017). [DOI] [PubMed] [Google Scholar]
- 54.Zivanov J., Nakane T., Scheres S. H. W., A Bayesian approach to beam-induced motion correction in cryo-EM single-particle analysis. IUCrJ 6, 5–17 (2019). [DOI] [PMC free article] [PubMed] [Google Scholar]
- 55.D. Asarnow, E. Palovcak, Y. Cheng, UCSF pyem v0.5. Zenodo (2019).
- 56.Tan Y. Z., Baldwin P. R., Davis J. H., Williamson J. R., Potter C. S., Carragher B., Lyumkis D., Addressing preferred specimen orientation in single-particle cryo-EM through tilting. Nat. Methods 14, 793–796 (2017). [DOI] [PMC free article] [PubMed] [Google Scholar]
- 57.Punjani A., Zhang H., Fleet D. J., Non-uniform refinement: Adaptive regularization improves single-particle cryo-EM reconstruction. Nat. Methods 17, 1214–1221 (2020). [DOI] [PubMed] [Google Scholar]
- 58.Brown A., Long F., Nicholls R. A., Toots J., Emsley P., Murshudov G., Tools for macromolecular model building and refinement into electron cryo-microscopy reconstructions. Acta Crystallogr. D Biol. Crystallogr. 71, 136–153 (2015). [DOI] [PMC free article] [PubMed] [Google Scholar]
- 59.Afonine P. V., Poon B. K., Read R. J., Sobolev O. V., Terwilliger T. C., Urzhumtsev A., Adams P. D., Real-space refinement in PHENIX for cryo-EM and crystallography. Acta Crystallogr. D Struct. Biol. 74, 531–544 (2018). [DOI] [PMC free article] [PubMed] [Google Scholar]
- 60.Prisant M. G., Williams C. J., Chen V. B., Richardson J. S., Richardson D. C., New tools in MolProbity validation: CaBLAM for CryoEM backbone, UnDowser to rethink "waters," and NGL Viewer to recapture online 3D graphics. Protein Sci. 29, 315–329 (2020). [DOI] [PMC free article] [PubMed] [Google Scholar]
- 61.Pettersen E. F., Goddard T. D., Huang C. C., Meng E. C., Couch G. S., Croll T. I., Morris J. H., Ferrin T. E., UCSF ChimeraX: Structure visualization for researchers, educators, and developers. Protein Sci. 30, 70–82 (2021). [DOI] [PMC free article] [PubMed] [Google Scholar]
- 62.Koes D. R., Baumgartner M. P., Camacho C. J., Lessons learned in empirical scoring with smina from the CSAR 2011 benchmarking exercise. J. Chem. Inf. Model. 53, 1893–1904 (2013). [DOI] [PMC free article] [PubMed] [Google Scholar]
- 63.Stansfeld P. J., Goose J. E., Caffrey M., Carpenter E. P., Parker J. L., Newstead S., Sansom M. S. P., MemProtMD: Automated insertion of membrane protein structures into explicit lipid membranes. Structure 23, 1350–1361 (2015). [DOI] [PMC free article] [PubMed] [Google Scholar]
- 64.R. C. owen vickery, owenvickery/cg2at: CG2AT2 a fragment based conversion (Version v0.2) Zenodo (21 August 2020).
- 65.Bussi G., Donadio D., Parrinello M., Canonical sampling through velocity rescaling. J. Chem. Phys. 126, 014101 (2007). [DOI] [PubMed] [Google Scholar]
- 66.Berendsen H. J., Postma J. P. M., van Gunsteren W. F., DiNola A., Haak J. R., Molecular dynamics with coupling to an external bath. J. Chem. Phys. 81, 3684–3690 (1984). [Google Scholar]
- 67.Evans D. J., Holian B. L., The Nose-Hoover thermostat. J. Chem. Phys. 83, 4069–4074 (1985). [Google Scholar]
- 68.Jorgensen W. L., Chandrasekhar J., Madura J. D., Comparison of simple potential functions for simulating liquid water. J. Chem. Phys. 79, 926–935 (1983). [Google Scholar]
- 69.Parrinello M., Rahman A., Polymorphic transitions in single crystals: A new molecular dynamics method. J. Appl. Phys. 52, 7182–7190 (1981). [Google Scholar]
- 70.Abraham M. J., Murtola T., Schulz R., Páll S., Smith J. C., Hess B., Lindahl E., GROMACS: High performance molecular simulations through multi-level parallelism from laptops to supercomputers. SoftwareX 1-2, 19–25 (2015). [Google Scholar]
- 71.Liu P., Kim B., Friesner R. A., Berne B. J., Replica exchange with solute tempering: A method for sampling biological systems in explicit water. Proc. Natl. Acad. Sci. U.S.A. 102, 13749–13754 (2005). [DOI] [PMC free article] [PubMed] [Google Scholar]
- 72.Patriksson A., van der Spoel D., A temperature predictor for parallel tempering simulations. Phys. Chem. Chem. Phys. 10, 2073–2077 (2008). [DOI] [PubMed] [Google Scholar]
- 73.Boresch S., Tettinger F., Leitgeb M., Karplus M., Absolute binding free energies: A quantitive approach for their calculation. J. Phys. Chem. B 107, 9535–9551 (2003). [Google Scholar]
- 74.Aldeghi M., Heifetz A., Bodkin M. J., Knapp S., Biggin P. C., Predictions of ligand selectivity from absolute binding free energy calculations. J. Am. Chem. Soc. 139, 946–957 (2017). [DOI] [PMC free article] [PubMed] [Google Scholar]
- 75.Klimovich P. V., Shirts M. R., Mobley D. L., Guidelines for the analysis of free energy calculations. J. Comput. Aided Mol. Des. 29, 397–411 (2015). [DOI] [PMC free article] [PubMed] [Google Scholar]
- 76.A. Grossfield, WHAM: The weighted histogram analysis method, version 2.0.10.2.
- 77.Michaud-Agrawal N., Denning E. J., Woolf T. B., Beckstein O., MDAnalysis: A toolkit for the analysis of molecular dynamics simulations. J. Comput. Chem. 32, 2319–2327 (2011). [DOI] [PMC free article] [PubMed] [Google Scholar]
- 78.Smith P., Ziolek R. M., Gazzarrini E., Owen D. M., Lorenz C. D., On the interaction of hyaluronic acid with synovial fluid lipid membranes. Phys. Chem. Chem. Phys. 21, 9845–9857 (2019). [DOI] [PubMed] [Google Scholar]
Associated Data
This section collects any data citations, data availability statements, or supplementary materials included in this article.
Supplementary Materials
Supplementary material for this article is available at http://advances.sciencemag.org/cgi/content/full/7/35/eabh3355/DC1