

North Tropical Atlantic Ocean variability increases in a warming climate due to an enhanced El Niño–Southern Oscillation influence.
Abstract
Variability of North Tropical Atlantic (NTA) sea surface temperature (SST), characterized by a near-uniform warming at its positive phase, is a consequential mode of climate variability. Modulated by El Niño–Southern Oscillation (ENSO) and the North Atlantic Oscillation, NTA warm anomalies tend to induce La Niña events, droughts in Northeast Brazil, increased frequency of extreme hurricanes, and phytoplankton blooms in the Guinea Dome. Future changes of NTA variability could have profound socioeconomic impacts yet remain unknown. Here, we reveal a robust intensification of NTA variability under greenhouse warming. This intensification mainly arises from strengthening of ENSO-forced Pacific-North American pattern and tropospheric temperature anomalies, as a consequence of an eastward shift of ENSO-induced equatorial Pacific convection and of increased ENSO variability, which enhances ENSO influence by reinforcing the associated wind and moist convection anomalies. The intensification of NTA SST variability suggests increased occurrences of extreme NTA events, with far-reaching ramifications.
INTRODUCTION
Variability of North Tropical Atlantic (NTA) sea surface temperature (SST) (hereafter the NTA) typically peaks in boreal spring (March, April, and May, MAM1, where “1” refers to the current year) and is characterized by basin-wide SST warming at its positive phase (1, 2). Coupled with a latitudinal movement of the intertropical convergence zone, the NTA profoundly influences precipitation in Northeast Brazil and Sahel (3–6). An anomalous NTA warming during 1979 to 1981 induced severe drought in Northeast Brazil, leading to a more than 70% reduction in production of rice, beans, and cotton (7). An intense NTA warming contributed to the 2012 to 2016 drought in Northeast Brazil, affecting 33.4 million people and resulting in losses of U.S. $30 billion (8). By modulating the intensity, number, and track pattern of Atlantic tropical cyclones, an NTA warm event increases the number of major hurricanes and their landfall frequency along the U.S. East Coast (9–12). Moreover, the NTA has a prominent influence on the Guinea Dome (13), chlorophyll-ɑ concentration, and ecosystems (14, 15). In addition to regional influences, the NTA exerts its climatic impacts over the globe, including El Niño–Southern Oscillation (ENSO) in the Pacific (16), sea ice distribution in the Antarctic (17), and anomalous global mean temperature (18). Because of these severe effects, determining the response of NTA to greenhouse warming is an issue of great importance.
The NTA mainly arises from latent heat flux anomalies associated with anomalous northeasterly trades (19–21). Specifically, the wind-evaporation-SST feedback (22), mainly confined to the deep tropics, contributes to the development of anomalous SST (23, 24), but forcings outside of the tropical Atlantic are required to reinforce the NTA temperature anomaly (2, 25, 26). The North Atlantic Oscillation (NAO) is one such forcing (27, 28). During a negative NAO event, the northeasterly trades weaken in response to a slackened Subtropical High, reducing surface latent heat flux and leading to an anomalous NTA warming. Another important forcing comes from ENSO (29, 30), which exerts its influence in several pathways. During El Niño, tropospheric temperature over the central and eastern equatorial Pacific increases and propagates eastward in the form of equatorial Kelvin waves, which reduces moist convection over the northern tropical Atlantic and gives rise to warm SST anomalies, a process referred to as “tropospheric temperature” mechanism (20, 31). Furthermore, convective anomalies associated with increased precipitation in the western and central equatorial Pacific excite the Pacific–North American (PNA) pattern (32), a Rossby wave train with a ridge over the western North America and troughs over the Aleutians and the southeastern United States. In response, the northeasterly trades weaken over the northern tropical Atlantic, reducing evaporation and generating warm SST anomalies. In addition, El Niño induces a negative diabatic heating over the Amazon basin, which, in turn, generates an anomalous Atlantic Hadley circulation (33) and a Gill-type response (34), contributing to the weakened northeasterly trades.
Despite the advances described above, how the NTA may respond to greenhouse warming remains unknown. Below, we show that most of the Coupled Model Intercomparison Project Phase 6 (CMIP6) models simulate an increase in NTA variability.
RESULTS
Observed NTA SST variability
To identify the observed NTA, we applied empirical orthogonal function (EOF) analysis to quadratically detrended SST anomalies (see the “EOF analysis” section in Materials and Methods) averaged over boreal spring when the NTA reaches its peak. Here, we take the normalized principal component (PC) time series as the NTA index. Given that ENSO can trigger NAO events (35, 36), a partial regression (partial correlation) is conducted to extract the “pure” NAO influence on (connection with) the NTA (see the “Partial regression” and “Partial correlation” sections in Materials and Methods).
As the leading mode in boreal spring, the observed NTA accounts for 64% of the total SST variance (fig. S1). It is tightly related with ENSO and the NAO in previous winter (December, January, and February, D0JF1, where “0” refers to the previous year), due to their influence on northeasterly trades and latent heat flux (Fig. 1, A and B). The (partial) correlation coefficient between MAM1 NTA and D0JF1 ENSO (NAO) reaches 0.59 (−0.5) over the period of 1951 to 2014 (red star, Fig. 1C).
Fig. 1. NTA connections with ENSO and the NAO in observation and CMIP6 models.

(A) Response of MAM1 SST (°C, color shading) and FMA1 wind (meters per second, vector) to observed Niño3.4 over the period of 1951 to 2014, calculated by regressing SST and wind anomalies onto Niño3.4 index and then multiplying the regression coefficients by 1 SD value of Niño3.4 index. (B) Same as (A) except for partial regression against an NAO index (reversed sign) by removing variability associated with Niño3.4 index (see the “Partial regression” and “EOF analysis” sections in Materials and Methods for NTA, NAO, and Niño3.4 indices). (C) Correlation coefficients between the NTA and Niño3.4 (x axis) and partial correlation coefficients between the NTA and the NAO (y axis; see the “Partial correlation” section in Materials and Methods). The large red-filled star indicates the observed value. In seven models, marked by circles, two generate an NTA-ENSO correlation and six produce an NTA-NAO correlation that are smaller than 50% in amplitude of the observations. These are referred as nonselected models. The remaining 16 models in blue quadrant are selected models. The dashed lines represent 50% of the observed values. (D and E) Same as (A) and (B) but for an ensemble mean of 16 selected models. (F and G) Same as (A) and (B) but for an average of the two models that produce a too-weak connection between the NTA and ENSO (correlation coefficients lower than 50% of the observed) (F) and for an ensemble mean of the six models that fail to generate the connection with the NAO (G). The boxes represent the NTA center (10°N to 25°N and 60°W to 20°W).
Model selection
We conducted similar EOF analysis using outputs from 23 CMIP6 models that are forced with historical forcing during the same period (1951 to 2014) as in observations. EOF analysis is useful in extracting the pattern of NTA variability, allowing models to have different spatial patterns. The NTA emerges as the first EOF mode in each model, consistent with the observations. However, several models underestimate the NTA connections with ENSO or the NAO (Fig. 1C). Among them, 16 models produce reasonable connections, with both correlation coefficients exceeding 50% in amplitude of the observed values. These models reproduce reasonably well the observed influences from ENSO and the NAO (Fig. 1, A and B versus D and E), with maximum wind and SST anomalies located over the NTA center (box in Fig. 1), although in most models, the influence is underestimated for both ENSO and the NAO. By comparison, the remaining seven models, featuring a westward (northward) shift of anomalous trades, generate weaker SST and wind responses to ENSO (the NAO) forcing (Fig. 1, A and B versus F and G). These wind shifts are related to a westward-displaced ENSO center (37, 38) and an underestimated magnitude of NAO variability simulated in models (2, 39). Nevertheless, the selected models reasonably simulate the amplitude of observed NTA variability (0.40°C, defined by SST SD averaged over the NTA center), with a range from 0.30° to 0.46°C and an ensemble mean of 0.35°C. Therefore, we use the 16 models that realistically simulate the connections with ENSO and the NAO to study the response of the NTA to greenhouse warming.
Increased NTA variability in the future climate
We performed EOF analysis to quadratically detrended MAM1 SST anomalies over the period of 1900 to 2099 in the 16 selected models. These models are forced with historical forcing until 2014 and with Shared Socioeconomic Pathways (SSP) 2-4.5 emission scenario from 2015 onward. We compared the SD of NTA variability between the present (1900 to 1999) and future (2000 to 2099) climate. A total of 12 of the 16, or 75%, selected models simulate increased NTA variability (Fig. 2A). The ensemble mean increase is 8.3%, significant above the 95% confidence level according to a bootstrap test (see the “Bootstrap test” section in Materials and Methods) (fig. S2A). This increase is underpinned by a robust (15 of the 16 selected models) enhancement of SST variability averaged over the NTA center (fig. S3A), with a significant ensemble mean increase of 10% (fig. S3B).
Fig. 2. Projected increase in NTA variability and occurrences of extreme NTA events.

(A) Comparison of the NTA SD over the present (1900 to 1999, blue-edged bars) and future (2000 to 2099, red-edged bars) periods in the 16 selected models. (B) Same as (A), but for the number of extreme events (PC > 1.75 SD). The multimodel ensemble means over the present and future periods are shown in blue-filled and red-filled bars, respectively; error bars are calculated as 1 SD of a total of 10,000 inter-realizations of a bootstrap method (see the “Bootstrap test” section in Materials and Methods); models that simulate a reduction are grayed out. Variability of the NTA and the frequency of extreme NTA events are projected to increase under greenhouse warming.
In association, occurrences of extreme NTA events, defined as PC greater than 1.75 SD, become more frequent under greenhouse warming (Fig. 2B). Aggregated over the 16 models, the frequency increases by 38%, from 1 event every 14.7 years (109 events in 1600 years) in the present period to 1 event every 10.7 years (150 events in 1600 years) in the future period. This increase in frequency enjoys a strong intermodel consensus (Fig. 2B) and an ensemble mean increase significant above the 95% confidence level (fig. S2B). In addition, the frequency of extreme events increases by 21 or 57%, when using threshold values of 1.5 or 2.0 SD, respectively, further supporting our result.
A sensitivity test further reveals that the increase in NTA variability is not sensitive to model selection. Even when all the 23 models are considered, the intermodel consensus on the increased NTA variability is still significant, with 16 of the 23 models (70%) producing an increase (fig. S4A). Identically, the increased frequency of extreme NTA events is still robust when considering all the 23 models (fig. S4B).
Enhancement in ENSO influence under greenhouse warming
An ensemble mean of the NTA response to NAO forcing barely changes in the future climate, indicating a minor role of the NAO in driving increased NTA variability (fig. S5). Instead, a change in ENSO teleconnection and in ENSO variability under greenhouse warming is the key driver of the increase in variability of the NTA.
To describe ENSO, we use Niño3.4 index normalized by the SD over the full 200 years to enhance intermodel comparability. Total response of the NTA to ENSO forcing in each period is calculated by regressing the NTA onto the Niño3.4 index and then multiplying the regression coefficient by 1 SD value of the Niño3.4 index. A comparison of the total response shows a substantial enhancement in a warming climate (Fig. 3A) (see the “Regression analysis” section in Materials and Methods). The enhanced response to ENSO is found consistently in all the 16 models except one (94% of the models), with an ensemble mean enhancement of 20% (from 0.56 in the present climate to 0.67 in the future climate) statistically significant according to a bootstrap test (Fig. 3B). In association, ENSO influence strengthens (Fig. 3, C and D), contributing to the increase in NTA variability. Specifically, models with a greater enhancement of NTA response to ENSO forcing produce a larger increase in NTA variability, and the intermodel correlation between changes in NTA response to ENSO and in NTA variability reaches 0.83 (Fig. 3E). Moreover, the enhanced NTA response to ENSO forcing is related to more frequent extreme NTA events, while that to the NAO forcing barely contributes (fig. S6).
Fig. 3. Change in NTA response to ENSO forcing and the projected increase in NTA variability.
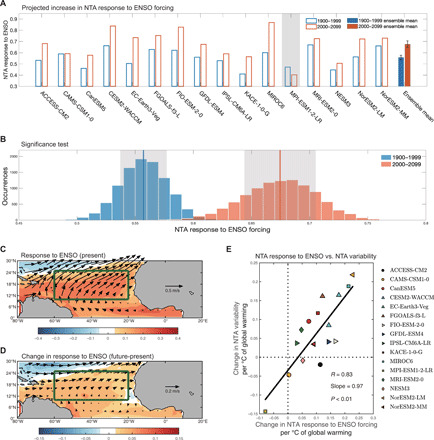
(A) Comparison of NTA response to ENSO forcing (SD) over the present (1900 to 1999, blue-edged bars) and future (2000 to 2099, red-edged bars) periods in the 16 selected models. The multimodel ensemble means over the present and future periods are shown in blue-filled and red-filled bars, respectively; error bars are calculated as 1 SD of a total of 10,000 inter-realizations of a bootstrap method (see the “Bootstrap test” section in Materials and Methods); models that simulate a reduction are grayed out. (B) Histograms of 10,000 realizations of a bootstrap method for NTA response to ENSO forcing in the present (1900 to 1999, blue) and future (2000 to 2099, red) climate. The blue and red lines indicate the mean values of the 10,000 realizations for the present and future periods, respectively. The gray shaded areas refer to the respective 1 SD of the 10,000 realizations. (C and D) Response of MAM1 SST (°C, color shading) and FMA1 surface winds to ENSO (meters per second, vector), in the present climate (C) and their projected changes (future minus present) (D). Green boxes (10°N to 25°N, 60°W to 20°W) represent the NTA center. (E) Intermodel relationship between the change in NTA response to ENSO (SD) and in NTA variability (SD). To enhance intermodel comparability, we scale the changes by an increase in global mean SST of each model. Linear fit (black solid line) is shown together with the correlation coefficient R, slope, and P value from the regression. The NTA response to ENSO forcing is projected to increase, contributing to enhanced NTA variability.
An eastward intensification of ENSO teleconnection
The enhanced NTA response to ENSO forcing is, in part, induced by an eastward shift of ENSO-induced response in convection (Fig. 4A). In the present climate, precipitation response to ENSO is centered over the western equatorial Pacific (fig. S7A). Under greenhouse warming, these anomalies intensify in the central to eastern equatorial Pacific (black box, fig. S7B), suggesting an eastward shift of convective anomalies (40–44). This shift in convection strengthens the sensitivity of PNA teleconnection to ENSO forcing (40), especially over the lobe of southeast United States, as seen in sensitivity of 200-hPa geopotential height anomalies to the Niño3.4 index (fig. S8). Specifically, 14 of 16 (88%) models produce a deepening of low-pressure anomalies, with an ensemble mean increase of 39%.
Fig. 4. Strengthening of PNA teleconnection.
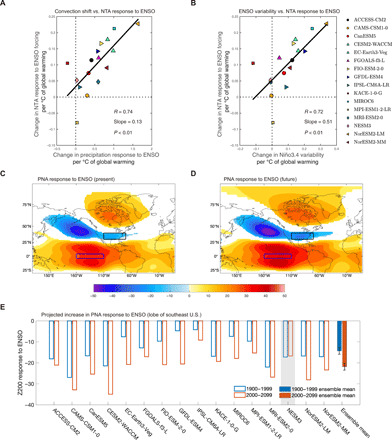
(A and B) Intermodel relationships between change in NTA response to ENSO (SD) and in FMA1 precipitation response to ENSO (millimeters per day) averaged over the central to eastern equatorial Pacific [blue boxes in (C) and (D)] (A) and in Niño3.4 variability (SD) (B). To enhance intermodel comparability, we scale the changes by an increase in global mean SST of each model. Linear fits (black solid line) are shown together with the correlation coefficients R, slopes, and P values from the regression. (C and D) Multimodel ensemble mean of the D0JF1 200-hPa geopotential height response to ENSO (meters), in the present (1900 to 1999) (C) and future (2000 to 2099) (D) climate. Only values exceeding 1 SD of intermodel spread are shown in color shading. Black and blue boxes represent the PNA center over the southeast United States (30°N to 40°N, 110°W to 70°W) and the central to eastern equatorial Pacific (4°S to 4°N, 160°W to 110°W), respectively. (E) Comparison of the D0JF1 200-hPa geopotential height response to ENSO (meters), averaged over the southeast United States [black boxes in (C) and (D)], in the present (1900 to 1999, blue-edged bars) and future (2000 to 2099, red-edged bars) periods in the 16 selected models. The multimodel ensemble means over the present and future periods are shown in blue-filled and red-filled bars, respectively; error bars are calculated as 1 SD of a total of 10,000 inter-realizations of a bootstrap method (see the “Bootstrap test” section in Materials and Methods); models that simulate a reduction are grayed out. The ENSO-induced PNA teleconnection is projected to increase, due to an increase in ENSO variability and an eastward shift of ENSO-induced equatorial Pacific convection.
Increased ENSO variability
In addition, ENSO variability increases in a warming climate, enhancing its remote forcing on NTA variability (Fig. 4B). A total of 12 of the 16 (75%) models produce increased Niño3.4 variability, with an ensemble mean increase of 11% (fig. S9). When all 23 models are considered, an increase in variability is simulated by 16 of the 23 (70%) models (fig. S4C), consistent with previous findings of enhanced variability in both eastern Pacific and central Pacific El Niño (45). The enhancement in ENSO variability further strengthens the ENSO-forced response in PNA teleconnection. Here, we examine the total change in the PNA teleconnection that includes change in PNA sensitivity to ENSO and change in ENSO variability itself. Hence, for each individual period, we regress geopotential height anomalies onto the Niño3.4 index and then multiply the regression coefficients by 1 SD value of the Niño3.4 index. In this case, a deepening of the low-pressure anomalies over the southeast United States is simulated by 15 of the 16 models (94%), with an ensemble increase reaching 53% (Fig. 4, C to E). The strengthening of PNA teleconnection is also seen in sea level pressure anomalies (fig. S10).
Consequence of enhanced ENSO teleconnections
As a result of the intensification of the PNA pattern, ENSO-forced response in wind is enhanced over the northern tropical Atlantic (Fig. 3, C and D), with a maximum increase north of 15°N. The enhanced wind speed response, with an ensemble mean increase of 21%, significantly contributes to the increase in the NTA response to ENSO forcing (Fig. 5A). The intermodel correlation between changes in the wind response and in the NTA response reaches −0.83.
Fig. 5. Mechanism for the projected increase in NTA response to ENSO forcing.

Intermodel relationships between change in NTA response to ENSO (SD) and in FMA1 wind speed response to ENSO (meters per second) averaged over the NTA center (A) and in tropospheric temperature response to ENSO (°C) averaged over the NTA center (B). To enhance intermodel comparability, we scale the changes by an increase in global mean SST of each model. Linear fits (black solid line) are shown together with the correlation coefficients R, slopes, and P values from the regression. The projected increase in NTA response to ENSO is primarily due to increased ENSO-induced wind speed variability and considerably due to increased ENSO-induced tropospheric temperature variability.
In addition, SST of the NTA center becomes more sensitive to wind forcing, as seen in MAM1 SST anomalies regressed onto unnormalized February, March, April (FMA1) wind speed anomalies (fig. S11A), which measures the sensitivity of SST to 1 m/s of wind speed change. In a warming climate, the ocean mixed layer depth shoals over the northern tropical Atlantic, a robust feature among all models (using all models with available outputs; fig. S11B). This shoaling arises from an intensification of oceanic stratification (46–48) and from a weakening of climatological northeasterly trades (using all models with available outputs; fig. S11, C and D). As a result of the shallower mixed layer, SST response to a given wind forcing increases in most of the models. However, its contribution to the NTA response to ENSO forcing is not statistically significant and therefore plays a minor role (fig. S11E).
Furthermore, under greenhouse warming, tropospheric temperature anomalies are intensified due to increased ENSO variability (fig. S12) and an amplified vapor response to ENSO (49), contributing to the enhanced NTA response to ENSO forcing (Fig. 5B). An intermodel correlation between changes in ENSO-forced response of tropospheric temperature and changes in the NTA response to ENSO forcing (R = 0.63), although not as high as that between changes in ENSO-forced response of wind speed and changes in the NTA response to ENSO forcing (R = −0.83; Fig. 5A), indicates a substantial contribution from the tropospheric temperature mechanism.
DISCUSSION
ENSO-forced responses in PNA teleconnection and tropospheric temperature are important mechanisms in driving the variability of NTA (Fig. 6A). Both of these mechanisms enhance under greenhouse warming, due to an eastward shift of ENSO-induced response in equatorial Pacific convection and an enhancement of ENSO variability. In association, ENSO-forced responses in wind speed and tropospheric temperature strengthen under greenhouse warming (Fig. 6B), leading to the increase in the amplitude of NTA SST variability and the frequency of extreme NTA events.
Fig. 6. Schematic diagram of the physical mechanisms responsible for increased NTA variability.

ENSO-induced MAM1 SST (color shading), wind (vectors), tropospheric temperature (red contour), convection (cloud) anomalies, and the associated PNA (high/low-pressure anomalies) teleconnection seen in the present-day climate (A) intensify and undergo an eastward shift (marked by the gray arrow) as greenhouse warming proceeds into the future climate (B), leading to increased NTA variability in the future climate. H, high; L, low.
We note that most of the models simulate an overly weak relationship between NTA and NAO variability. Although the weak relationship might represent a source of uncertainty, there is no intermodel consensus on a simulated increase in NAO variability (39), indicating an inconsequential impact from NAO variability on the increase in NTA variability. This result could change if there is a forced NAO signal that is currently underestimated (50). Other biases are found over the tropical Atlantic and the Pacific, for example, a bias of a double intertropical convergence zone over the Atlantic and a weaker-than-observed influence of the tropical Atlantic on ENSO (51–53). Hence, interactions between NTA variability and ENSO, and ENSO properties, may be affected by model biases. However, the nature of impacts from tropical biases on the change of tropical Atlantic SST variability is not clear, and there is no evidence that these biases may affect the strengthening of ENSO-forced responses in PNA teleconnection and tropospheric temperature, the main factors that force the increase in NTA variability.
Thus, the consequence of an increase in ENSO variability and its teleconnections under greenhouse warming is more severe than previously thought, as the increase can energize dominant modes of climate variability remote from the Pacific, such as the NTA. Given the profound climatic impacts of the NTA in inducing droughts, floods, and extreme Atlantic hurricanes in affected regions, which are projected to increase (54, 55), our results add to the urgency of reducing emissions of greenhouse gases.
MATERIALS AND METHODS
Observed and CMIP6 data
To characterize the NTA connection with ENSO and with the NAO, we use monthly SST reanalysis from Hadley Centre Sea Ice and Sea Surface Temperature dataset version 1.1 (HadISST v1.1) (56) during 1951 to 2014 and monthly 200- and 500-hPa geopotential height from the National Centers for Environmental Prediction and the National Center for Atmospheric Research global reanalysis (57) for the period of 1951 to 2014. Also, we analyze outputs from 23 CMIP6 models, with historical and ssp2-4.5 emission scenario forcings over the period of 1900 to 2014 and 2015 to 2099, respectively (table S1) (58).
EOF analysis
To capture observed and model-simulated NTA variability, EOF analysis (59) is performed on quadratically detrended MAM1 SST anomalies over the northern tropical Atlantic (0°N to 30°N and 80°W to 20°E). The NTA index is referred to as the normalized PC time series. To identify the NAO variability, the same approach was applied to quadratically detrended 500-hPa geopotential height over the North Atlantic (20°N to 70°N and 60°W to 0°E) in D0JF1. ENSO is represented by the normalized Niño3.4 index (SST anomalies averaged over 5°S to 5°N and 170°W to 120°W) after quadratically detrended in D0JF1. All data have been quadratically detrended before analysis.
Regression analysis
Regression analysis is conducted to study the influence of B on A. When regressing index A onto index B, we are interested in the sensitivity of A to B. When regressing A onto B and multiplying the slope by the SD of B, we are interested in the total response of A to B, resulting from the sensitivity of A to B and SD of B.
Bootstrap test
Bootstrap test (60) is conducted to examine whether a change is statistically significant. A total of 10,000 realizations are conducted to obtain the mean from the 16 selected models. Each realization is averaged over 16 samples that are independently and randomly resampled from the 16 selected models. In this resampling process, any model is allowed to be selected more than once. The SD of the 10,000 realizations is calculated for each period. If the mean value difference between the future and present periods is greater than the sum of the two separate 10,000-realization SD values, then the change is statistically significant above 95% confidence level.
Partial correlation
To exclude ENSO influence and achieve the “pure” relationship between the NAO and NTA, a partial correlation analysis is applied
| (1) |
where Y, B, and A represent the variables (such as the NTA), the NAO index, and Niño3.4 index, respectively. R denotes the correlation coefficient, and RY(B∣A) for partial correlation coefficient between the variable Y and NAO index (B), after the influence of ENSO (A) is removed from NAO (B).
Partial regression
To obtain the “pure” influence of NAO, a partial regression analysis is applied to exclude the ENSO influence. The partial regression coefficient is as
| (2) |
where CY(B∣A) is the partial regression coefficient between the target variable Y and NAO index (B), after the influence of ENSO (A) is removed from NAO (B). SY and SB∣A represent the SD of variable Y and NAO (B) after removing the factor Niño3.4 (A).
Acknowledgments
Funding: This work is supported by the National Key R&D Program of China (grant no. 2016YFA0601803), Strategic Priority Research Program of Chinese Academy of Sciences (XDB40000000), National Natural Science Foundation of China (NSFC) project (grant nos. 41976005, 41676190, 41976193, 41831175, 41922039, and 91858102), and Chinese Academy of Science (COMS2019Q03). W.C. is supported by the Centre for Southern Hemisphere Oceans Research, a joint research center between QNLM and CSIRO. S.-P.X. is supported by the NSF (AGS 1637450). Computation is supported by the Center for High Performance Computing and System Simulation, Pilot National Laboratory for Marine Science and Technology (Qingdao). Author contributions: Y.Y. conceived and wrote the initial manuscript in discussion with L.W. and W.C. Y.Y. and Y.G. conducted the analysis. S.-P.X., G.H., and X. Li contributed to interpreting results. All authors contributed to improving the manuscript. Competing interests: The authors declare that they have no competing interests. Data and materials availability: All data needed to evaluate the conclusions in the paper are present in the paper and/or the Supplementary Materials.
SUPPLEMENTARY MATERIALS
Supplementary material for this article is available at http://advances.sciencemag.org/cgi/content/full/7/35/eabg9690/DC1
REFERENCES AND NOTES
- 1.B. Huang, P. S. Schopf, J. Shukla, Coupled ocean–atmosphere variability in the tropical Atlantic Ocean, in CLIVAR Exchanges, Vol. 7, No. 3/4 (International CLIVAR Project Office, Southampton, United Kingdom, 2002), pp. 24–27.
- 2.Yang Y., Xie S.-P., Wu L., Kosaka Y., Li J., ENSO forced and local variability of North Tropical Atlantic SST: Model simulations and biases. Climate Dynam. 51, 4511–4524 (2018). [Google Scholar]
- 3.S.-P. Xie, J. A. Carton, Tropical Atlantic variability: Patterns, mechanisms, and Impacts, in Earth’s climate (American Geophysical Union, 2004).
- 4.Hastenrath S., Exploring the climate problems of Brazil’s Nordeste: A review. Clim. Change 112, 243–251 (2012). [Google Scholar]
- 5.Giannini A., Saravanan R., Chang P., Oceanic forcing of Sahel rainfall on interannual to interdecadal time scales. Science 302, 1027–1030 (2003). [DOI] [PubMed] [Google Scholar]
- 6.Cai W., McPhaden M. J., Grimm A. M., Rodrigues R. R., Taschetto A. S., Garreaud R. D., Dewitte B., Poveda G., Ham Y.-G., Santoso A., Ng B., Anderson W., Wang G., Geng T., Jo H.-S., Marengo J. A., Alves L. M., Osman M., Li S., Wu L., Karamperidou C., Takahashi K., Vera C., Climate impacts of the El Niño–Southern Oscillation on South America. Nat. Rev. Earth Environ. 1, 215–231 (2020). [Google Scholar]
- 7.Marengo J. A., Torres R. R., Alves L. M., Drought in Northeast Brazil—Past, present, and future. Theor. Appl. Climatol. 129, 1189–1200 (2017). [Google Scholar]
- 8.Marengo J. A., Alves L. M., Alvala R. C. S., Cunha A. P., Brito S., Moraes O. L. L., Climatic characteristics of the 2010-2016 drought in the semiarid Northeast Brazil region. An. Acad. Bras. Cienc. 90, 1973–1985 (2018). [DOI] [PubMed] [Google Scholar]
- 9.Xie L., Yan T., Pietrafesa L. J., Morrison J. M., Karl T., Climatology and interannual variability of North Atlantic hurricane tracks. J. Climate 18, 5370–5381 (2005). [Google Scholar]
- 10.Vimont D. J., Kossin J. P., The Atlantic meridional mode and hurricane activity. Geophys. Res. Lett. 34, L07709 (2007). [Google Scholar]
- 11.Vecchi G. A., Soden B. J., Effect of remote sea surface temperature change on tropical cyclone potential intensity. Nature 450, 1066–1070 (2007). [DOI] [PubMed] [Google Scholar]
- 12.Murakami H., Levin E., Delworth T. L., Gudgel R., Hsu P.-C., Dominant effect of relative tropical Atlantic warming on major hurricane occurrence. Science 362, 794–799 (2018). [DOI] [PubMed] [Google Scholar]
- 13.Doi T., Tozuka T., Yamagata T., Interannual variability of the Guinea Dome and its possible link with the Atlantic Meridional Mode. Climate Dynam. 33, 985–998 (2009). [Google Scholar]
- 14.Signorini S. R., Murtugudde R. G., McClain C. R., Christian J. R., Picaut J., Busalacchi A. J., Biological and physical signatures in the tropical and subtropical Atlantic. J. Geophys. Res. 104, 18367–18382 (1999). [Google Scholar]
- 15.Pradhan Y., Lavender S. J., Hardman-Mountford N. J., Aiken J., Seasonal and inter-annual variability of chlorophyll-a concentration in the Mauritanian upwelling: Observation of an anomalous event during 1998–1999. Deep Sea Res. Part II Top Stud. Oceanogr. 53, 1548–1559 (2006). [Google Scholar]
- 16.Ham Y. G., Kug J. S., Park J. Y., Jin F.-F., Sea surface temperature in the North Tropical Atlantic as a trigger for El Niño/Southern Oscillation events. Nat. Geosci. 6, 112–116 (2013). [Google Scholar]
- 17.Li X., Holland D. M., Gerber E. P., Yoo C., Impacts of the north and tropical Atlantic Ocean on the Antarctic Peninsula and sea ice. Nature 505, 538–542 (2014). [DOI] [PubMed] [Google Scholar]
- 18.Li X., Xie S.-P., Gille S. T., Yoo C., Atlantic-induced pan-tropical climate change over the past three decades. Nat. Clim. Change 6, 275–279 (2016). [Google Scholar]
- 19.Foltz G. R., McPhaden M. J., Lumpkin R., A strong Atlantic Meridional Mode event in 2009: The role of mixed layer dynamics. J. Climate 25, 363–380 (2012). [Google Scholar]
- 20.Jiang L., Li T., Relative roles of El Niño-induced extratropical and tropical forcing in generating Tropical North Atlantic (TNA) SST anomaly. Climate Dynam. 53, 3791–3804 (2019). [Google Scholar]
- 21.Park J.-H., Li T., Interdecadal modulation of El Niño–tropical North Atlantic teleconnection by the Atlantic multi-decadal oscillation. Climate Dynam. 52, 5345–5360 (2019). [Google Scholar]
- 22.Xie S.-P., Philander S. G. H., A coupled ocean–atmosphere model of relevance to the ITCZ in the eastern Pacific. Tellus 46, 340–350 (1994). [Google Scholar]
- 23.Chang P., Ji L., Li H., A decadal climate variation in the tropical Atlantic Ocean from thermodynamic air–sea interactions. Nature 385, 516–518 (1997). [Google Scholar]
- 24.L. Wu, Q. Zhang, Z. Liu, Toward understanding tropical Atlantic variability using coupled modeling surgery, in Earth Climate: The Ocean–Atmosphere Interaction, vol. 147 (Geophysical monograph series, American Geophysical Union, 2004), pp. 157–170.
- 25.Chiang J. C. H., Kushnir Y., Giannini A., Deconstructing Atlantic Intertropical Convergence Zone variability: Influence of the local cross-equatorial sea surface temperature gradient, and remote forcing from the eastern equatorial Pacific. J. Geophys. Res. 107, 4004 (2002). [Google Scholar]
- 26.Amaya D. J., DeFlorio M. J., Miller A. J., Xie S.-P., WES feedback and the Atlantic Meridional Mode: Observations and CMIP5 comparisons. Climate Dynam. 49, 1665–1679 (2017). [Google Scholar]
- 27.Czaja A., van der Vaart P., Marshall J., A diagnostic study of the role of remote forcing in tropical Atlantic variability. J. Climate 15, 3280–3290 (2002). [Google Scholar]
- 28.M. Visbeck, E. P. Chassignet, R. G. Curry, T. Delworth, G. Krahmann, The ocean's response to North Atlantic Oscillation variability, in The North Atlantic Oscillation: Climate Significance and Environmental Impact, J. W. Hurrell, Y. Kushnir, G. Ottersen, M. Visbeck, Eds. (Amer. Geophys. Union, 2003), pp. 113–146.
- 29.Saravanan R., Chang P., Interaction between tropical Atlantic variability and El Niño-Southern oscillation. J. Climate 13, 2177–2194 (2000). [Google Scholar]
- 30.Taschetto A. S., Rodrigues R. R., Meehl G. A., McGregor S., England M. H., How sensitive are the Pacific–tropical North Atlantic teleconnections to the position and intensity of El Niño-related warming? Climate Dynam. 46, 1841–1860 (2016). [Google Scholar]
- 31.Chang P., Fang Y., Saravanan R., Ji L., Seidel H., The cause of the fragile relationship between the Pacific El Niño and the Atlantic Niño. Nature 443, 324–328 (2006). [DOI] [PubMed] [Google Scholar]
- 32.Enfield D. B., Mayer D. A., Tropical Atlantic sea surface temperature variability and its relation to El Niño-Southern Oscillation. J. Geophys. Res. 102, 929–945 (1997). [Google Scholar]
- 33.C. Wang, ENSO, Atlantic climate variability, and the Walker and Hadley circulations, in The Hadley Circulation: Present, Past and Future (Springer, 2004), pp. 173–202. [Google Scholar]
- 34.García-Serrano J., Cassou C., Douville H., Giannini A., Doblas-Feyes F. J., Revisiting the ENSO teleconnection to the tropical North Atlantic. J. Climate 30, 6945–6957 (2017). [Google Scholar]
- 35.Cassou C., Terray L., Dual influence of Atlantic and Pacific SST anomalies on the North Atlantic/Europe winter climate. Geophys. Res. Lett. 28, 3195–3198 (2001). [Google Scholar]
- 36.Fereday D. R., Chadwick R., Knight J. R., Scaife A. A., Tropical rainfall linked to stronger future ENSO-NAO teleconnection in CMIP5 models. Geophys. Res. Lett. 47, e2020GL088664 (2020). [Google Scholar]
- 37.Lau N.-C., Nath M. J., Impact of ENSO on the variability of the Asian–Australian monsoons as simulated in GCM experiments. J. Climate 13, 4287–4309 (2000). [Google Scholar]
- 38.Lau N.-C., Nath M. J., Atmosphere–ocean variations in the Indo-Pacific sector during ENSO episodes. J. Climate 16, 3–20 (2003). [Google Scholar]
- 39.Ning L., Bradley R. S., NAO and PNA influences on winter temperature and precipitation over the eastern United States in CMIP5 GCMs. Climate Dynam. 46, 1257–1276 (2016). [Google Scholar]
- 40.Zhou Z. Q., Xie S.-P., Zheng X. T., Liu Q., Wang H., Global warming–induced changes in El Niño teleconnections over the North Pacific and North America. J. Climate 27, 9050–9064 (2014). [Google Scholar]
- 41.Huang P., Xie S. P., Mechanisms of change in ENSO-induced tropical Pacific rainfall variability in a warming climate. Nat. Geosci. 8, 922–926 (2015). [Google Scholar]
- 42.Cai W., Borlace S., Lengaigne M., Van Rensch P., Collins M., Vecchi G., Timmermann A., Santoso A., McPhaden M. J., Wu L., England M. H., Wang G., Guilyardi E., Jin F.-F., Increasing frequency of extreme El Niño events due to greenhouse warming. Nat. Clim. Change 4, 111–116 (2014). [Google Scholar]
- 43.Power S. B., Delage F., Chung C. T., Kociuba G., Keay K., Robust twenty-first century projections of El Nino and related precipitation variability. Nature 502, 541–547 (2014). [DOI] [PubMed] [Google Scholar]
- 44.Yan Z., Wu B., Li T., Collins M., Clark R., Zhou T., Murphy J., Tan G., Eastward shift and extension of ENSO-induced tropical precipitation anomalies under global warming. Sci. Adv. 6, eaax4177 (2019). [DOI] [PMC free article] [PubMed] [Google Scholar]
- 45.Cai W., Wang G., Dewitte B., Wu L., Santoso A., Takahashi K., Yang Y., Carreric A., McPhaden M., Increased variability of Eastern Pacific El Niño under greenhouse warming. Nature 564, 201–206 (2018). [DOI] [PubMed] [Google Scholar]
- 46.Yang Y., Wu L., Fang C., Will global warming suppress North Atlantic Tripole decadal variability? J. Climate 25, 2040–2055 (2012). [Google Scholar]
- 47.Geng T., Yang Y., Wu L., On the mechanisms of Pacific Decadal Oscillation Modulation in a warming climate. J. Climate 32, 1443–1459 (2019). [Google Scholar]
- 48.Li S., Wu L., Yang Y., Geng T., Cai W., Gan B., Chen Z., Jing Z., Wang G., Ma X., The Pacific Decadal Oscillation less predictable under greenhouse warming. Nat. Clim. Change 10, 30–34 (2020). [Google Scholar]
- 49.Hu K., Huang G., Huang P., Kosaka Y., Xie S.-P., Intensification of El Niño-induced atmospheric anomalies under greenhouse warming. Nat. Geosci. 14, 377–382 (2021). [Google Scholar]
- 50.Smith D. M., Scaife A. A., Eade R., Athanasiadis P., Bellucci A., Bethke I., Bilbao R., Borchert L. F., Caron L.-P., Counillon F., Danabasoglu G., Delworth T., Doblas-Reyes F. J., Dunstone N. J., Estella-Perez V., Flavoni S., Hermanson L., Keenlyside N., Kharin V., Kimoto M., Merryfield W. J., Mignot J., Mochizuki T., Modali K., Monerie P.-A., Müller W. A., Nicolí D., Ortega P., Pankatz K., Pohlmann H., Robson J., Ruggieri P., Sospedra-Alfonso R., Swingedouw D., Wang Y., Wild S., Yeager S., Yang X., Zhang L., North Atlantic climate far more predictable than models imply. Nature 583, 796–800 (2020). [DOI] [PubMed] [Google Scholar]
- 51.Yang Y., Xie S.-P., Wu L., Kosaka Y., Li J., Causes of enhanced SST variability over the equatorial Atlantic and its relationship to the Atlantic zonal mode in CMIP5. J. Climate 30, 6171–6182 (2017). [Google Scholar]
- 52.Richter I., Xie S.-P., Behera S. K., Doi T., Masumoto Y., Equatorial Atlantic variability and its relation to mean state biases in CMIP5. Climate Dyn. 42, 171–188 (2014). [Google Scholar]
- 53.Jia F., Cai W., Wu L., Gan B., Wang G., Kucharski F., Chang P., Keenlyside N., Weakening Atlantic Niño–Pacific connection under greenhouse warming. Sci. Adv. 5, eaax4111 (2019). [DOI] [PMC free article] [PubMed] [Google Scholar]
- 54.Bender M. A., Knutson T. R., Tuleya R. E., Sirutis J. J., Vecchi G. A., Garner S. T., Held I. M., Modeled impact of anthropogenic warming on the frequency of intense Atlantic hurricanes. Science 327, 454–458 (2010). [DOI] [PubMed] [Google Scholar]
- 55.J. A. Marengo, A. P. Cunha, W. R. Soares, R. R. Torres, L. M. Alves, S. S. B. Brito, L. A. Cuartas, K. Leal, N. G. Ribeiro, R. C. S. Alvalá, A. R. Magalhaes, Increase risk of drought in the semiarid lands of Northeast Brazil due to regional warming above 4 °C, in Climate Change Risks in Brazil, C. A. Nobre, J. A. Marengo, W. R. Soares, Eds. (Springer, 2019), pp. 181–200. [Google Scholar]
- 56.Rayner N. A., Parker D. E., Horton E. B., Folland C. K., Alexander L. V., Rowell D. P., Kent E. C., Kaplan A., Global analyses of sea surface temperature, sea ice, and night marine air temperature since the late nineteenth century. J. Geophys. Res. 108, 4407 (2003). [Google Scholar]
- 57.Kalnay E., Kanamitsu M., Kistler R., Collins W., Deaven D., Gandin L., Iredell M., Saha S., White G., Woollen J., Zhu Y., Chelliah M., Ebisuzaki W., Higgins W., Janowiak J., Mo K. C., Ropelewski C., Wang J., Leetmaa A., Reynolds R., Jenne R., Joseph D., The NCEP/NCAR 40-year reanalysis project. Bull. Am. Meteorol. Soc. 77, 437–472 (1996). [Google Scholar]
- 58.Eyring V., Bony S., Meehl G. A., Senior C. A., Stevens B., Stouffer R. J., Taylor K. E., Overview of the Coupled Model Intercomparison Project Phase 6 (CMIP6) experimental design and organization. Geosci. Model Dev. 9, 1937–1958 (2016). [Google Scholar]
- 59.E. N. Lorenz, Empirical Orthogonal Functions and Statistical Weather Prediction, in Statistical Forecast Project Report 1 (MIT Department of Meteorology, 1956).
- 60.Austin P. C., Tu J. V., Bootstrap methods for developing predictive models. Am. Stat. 58, 131–137 (2004). [Google Scholar]
Associated Data
This section collects any data citations, data availability statements, or supplementary materials included in this article.
Supplementary Materials
Supplementary material for this article is available at http://advances.sciencemag.org/cgi/content/full/7/35/eabg9690/DC1