

Abstract
Selective protein degradation platforms have afforded new development opportunities for therapeutics and tools for biological inquiry. The first lysosome targeting chimeras (LYTACs) targeted extracellular and membrane proteins for degradation by bridging a target protein to the cation-independent mannose-6-phosphate receptor (CI-M6PR). Here, we developed LYTACs that engage the asialoglycoprotein receptor (ASGPR), a liver-specific lysosomal targeting receptor, to degrade extracellular proteins in a cell type-specific manner. We conjugated binders to a tri-GalNAc motif that engages ASGPR to drive downregulation of proteins. Degradation of EGFR by GalNAc-LYTAC attenuated EGFR signaling compared to inhibition with an antibody. Furthermore, we demonstrated that a LYTAC comprising a 3.4 kDa peptide binder linked to a tri-GalNAc ligand degrades integrins and reduces cancer cell proliferation. Degradation with a single tri-GalNAc ligand prompted site-specific conjugation on antibody scaffolds, which improved the pharmacokinetic profile of GalNAc-LYTACs in vivo. GalNAc-LYTACs thus represent an avenue for cell-type restricted protein degradation.
Introduction
Targeted protein degradation (TPD) is a promising new therapeutic modality and a tool for probing biological pathways as well as the cellular degradation machinery. Most TPD platforms such as IMiDs1,2, proteolysis targeting chimeras (PROTACs)3,4, dTAGs5,6, Trim-Away7, and SNIPERs8, rely on the ubiquitin proteasome system (UPS). Recently, AUTACs9 and ATTECs10,11 have emerged as approaches that exploit the intracellular autophagy machinery for mediating TPD. Advances in TPD strategies have accelerated over the past two decades, and PROTACs have recently entered clinical trials12. However, the cytosolic localization of the UPS and targetable autophagy machinery restricts these approaches to proteins with cytosolic domains and requires degraders to be cell-permeable. In order to relax these constraints and expand the scope of TPD to extracellular targets, our lab has developed lysosome targeting chimeras (LYTACs) which bind and direct plasma membrane-associated or secreted proteins to lysosomes13. First-generation LYTACs employed the cation-independent mannose-6-phosphate receptor (CI-M6PR) that endogenously traffics hydrolases and other cargo to the lysosome (Fig. 1a)14. LYTACs were composed of a target binding moiety (e.g. antibody or small molecule) linked to a CI-M6PR binding ligand, mannose-6-phosphonate (M6Pn). These M6Pn-LYTACs promoted lysosomal degradation of disease-relevant extracellular and membrane proteins by bridging the target protein with CI-M6PR.
Fig. 1. LYTACs can hijack the asialoglycoprotein receptor (ASPGR) for targeted and cell-specific protein degradation.

a, First-generation LYTACs co-opt the broadly expressed cation independent mannose 6-phosphate receptor (CI-M6PR). b, GalNAc-LYTACs hijack the liver-specific ASGPR to target hepatocytes specifically. c, Structure of tri-GalNAc-DBCO (1) ligand for ASGPR-targeting. d, Synthesis of antibody-tri-GalNAc conjugates (GalNAc-LYTACs). Native gel electrophoresis of IgG, IgG-N3, and IgG-GalNAc. e, LYTAC-mediated internalization of rabbit IgG-647 in HEPG2 cells. f, Mean fluorescence intensity (MFI) relative to the control (rabbit IgG-647 only) for HEPG2 cells incubated at 37 °C for 1 h with 50 nM rabbit IgG-647 and 25 nM goat-anti-rabbit, goat-anti-rabbit-M6Pn, or goat-anti-rabbit-GalNAc. MFI was determined by live cell flow cytometry. g, Live-cell imaging of HEPG2 cells that were incubated at 37 °C for 1 h with 50 nM rabbit IgG-647 and 25 nM goat-anti-rabbit, goat-anti-rabbit-M6Pn, or goat-anti-rabbit-GalNAc. Scale bar, 20 μm. For d, g, gels and images are representative of two independent experiments. For f, data are the mean of three independent experiments ± SEM. P values were determined by unpaired two-tailed t-tests.
CI-M6PR is one of several lysosome trafficking receptors that could, in principle, be harnessed for the design of LYTACs. Indeed, whereas CI-M6PR is broadly expressed in most tissues, other lysosome trafficking receptors have tissue-specific expression patterns. Such receptors offer the opportunity to achieve tissue-specific LYTAC activity. For therapeutic development, the ability to select in which tissue degradation occurs could have benefits for the therapeutic window.
Here, we develop LYTACs that engage the liver-specific asialoglycoprotein receptor (ASGPR)20 as a lysosome targeting receptor (Fig. 1b). ASGPR recognizes glycoproteins bearing N-acetylgalactosamine (GalNAc) or galactose (Gal) ligands and internalizes them via clathrin-mediated endocytosis15,16. Following internalization and endosomal acidification, ASGPR releases GalNAc or Gal and recycles back to the plasma membrane, while glycoproteins proceed to the lysosome17. ASGPR has been exploited to achieve efficient delivery of various cargo to the liver, most notably, siRNA and ASO therapeutics18–22. We developed LYTACs comprising an antibody against a target of interest conjugated to homogeneous GalNAc ligands that induce targeted, cell type-specific degradation. In doing so, we demonstrated that receptor-mediated degradation is generalizable beyond CI-M6PR. Additionally, we showed that a synthetic 3.4 kDa peptide, a much smaller binder than an antibody, can be linked to a single tri-GalNAc ligand to degrade integrins resulting in anti-proliferative effects in hepatocellular carcinoma (HCC) cells. We then simplified the structural architecture of antibody-based GalNAc-LYTACs through site-specific conjugation, which enabled modulation of the pharmacokinetic profile of GalNAc-LYTACs.
Results
Construction and internalization of GalNAc-LYTACs
Prior work on siRNA therapeutics revealed that triantenerrary GalNAc (tri-GalNac) ligands engage ASGPR with low nanomolar affinity23,24,25 and showed promising efficacy and safety profiles26,27. The homogeneous nature of a tri-GalNAc ligand was additionally appealing as it would enable precise characterization of ligand to antibody ratios, which was challenging with the heterogenous polymers utilized in the initial M6Pn-LYTACs13. Therefore, we synthesized tri-GalNAc-DBCO (1) in 8 steps from peracetylated GalNAc and a Cbz-protected dendrimer scaffold28,21 (Fig. 1c, Supplementary Note 1). Tri-GalNAc-DBCO was conjugated to azides on non-specifically labeled antibodies via Cu-free strain-promoted azide-alkyne cycloaddition (Supplementary Fig. 1). The conjugation reaction was monitored by native gel electrophoresis, as the GalNAc conjugated antibody migrates slower than the azide functionalized starting material as a result of increased hydrodynamic size (Fig. 1d). To confirm that antibody-GalNAc conjugates can trigger internalization of extracellular targets via ASGPR, we examined LYTAC-mediated uptake in an HCC cell line, HEPG2. We included the first-generation LYTAC (M6Pn-LYTAC)13 that engages the CI-M6PR as a comparison. HEPG2 cells were incubated with rabbit IgG-647 and goat-anti-rabbit (control), goat-anti-rabbit M6Pn (M6Pn-LYTAC), or goat-anti-rabbit GalNAc (GalNAc-LYTAC) for 1 hour, then intracellular fluorescence was analyzed by flow cytometry (Fig. 1e). M6Pn-LYTAC increased cellular fluorescence 2-fold relative to the control while GalNAc-LYTAC increased 16-fold relative to the control (Fig. 1f). This result was confirmed by confocal microscopy, where GalNAc-LYTAC treatment resulted in high IgG-647 signal that co-localized with Lysotracker, indicating that GalNAc-LYTACs traffic to the acidic compartments in cells (Fig. 1g). The superior internalizing efficiency of GalNAc-LYTAC compared to M6Pn-LYTAC is potentially due to the higher surface expression of ASGPR versus CI-M6PR in hepatocytes (Supplementary Fig. 2).
Degradation of EGFR via GalNAc-LYTAC
We next asked if GalNAc-LYTACs could mediate degradation of membrane proteins in HCC cell lines. We chose epidermal growth factor receptor (EGFR) as a target as it is overexpressed in HCC patients and its dysregulated activity has been implicated in primary resistance to sorafenib, the standard of care for advanced HCC29,30. Moreover, as EGFR was previously targeted with our first-generation M6Pn-LYTACs, we sought to compare GalNAc-LYTACs with earlier congeners. Cetuximab (Ctx) is an FDA-approved blocking antibody against EGFR for colorectal and head and neck cancer31,32. We conjugated Ctx to the tri-GalNAc ligand (Fig. 2a), and MALDI-MS analysis of the product (Ctx-GalNAc) revealed an average of 10.5 tri-GalNAc moieties per antibody (Supplementary Fig. 3). We treated HEP3B cells with Ctx-GalNAc, then measured surface levels of EGFR by flow cytometry using an orthogonal detection antibody. Ctx-GalNAc degraded >70% of cell surface EGFR in HEP3B cells, a level similar to the M6Pn-LYTACs (Fig. 2b).
Fig. 2. GalNAc-LYTACs promote degradation of epidermal growth factor receptor (EGFR) in HCC cell lines.

a, EGFR degradation mediated by Cetuximab (Ctx)-GalNAc. b, Degradation of cell surface EGFR in HEP3B determined by live cell flow cytometry following 48 h of treatment with 10 nM Ctx or conjugates. c, Western blot analysis of total EGFR levels in HEP3B, HEPG2, and HUH7 after treat with 10 nM Ctx conjugates for 48 h. d, Dose-response curve for cell surface EGFR degradation in HEP3B incubated with 1 nM, 10 nM, 50 nM, 100 nM Ctx conjugates for 48 h. Relative surface expression of EGFR is determined by live cell flow cytometry. e, Time-course of degradation of cell surface EGFR in HEP3B incubated with 10 nM Ctx conjugates for 3, 6, 24, and 48 h. Relative surface expression of EGFR is determined by live cell flow cytometry. f, Visualization of EGFR degradation in HEP3B cells by confocal microscopy after 10 nM Ctx conjugate treatments for 48 h. Scale bar, 30 μm. For b-e, data are three independent experiments and mean ± SEM for b,c. Images in f are representative of two independent experiments. P values were determined by unpaired two-tailed t-tests. NS, not significant.
We then evaluated the depletion of total EGFR in HEP3B, HEPG2, and HUH7 HCC cell lines. We observed >70% total degradation with Ctx-GalNAc in HEP3B, consistent with the observations from cell-surface degradation. HEPG2 and HUH7 cells also exhibited comparable degradation efficiency (Fig. 2c). Degradation was found to depend on concentration, as Ctx-GalNAc mediated 50% degradation of cell-surface EGFR in HEP3B cells at a concentration as low as 1 nM. Maximum degradation was reached at concentration of 10 nM and this degree of degradation persisted at higher concentrations, indicating that these LYTACs do not display a significant “hook-effect” within this concentration regime, a characteristic of other bifunctional molecules33 (Fig. 2d, Supplementary Fig. 4). Ctx-GalNAc mediated degradation of cell-surface EGFR over 48 hours, reaching >50% degradation at 24 hours (Fig. 2e, Supplementary Fig. 5). Visualization and quantification of EGFR by confocal microscopy following LYTAC treatment showed diminished membrane EGFR signals, consistent with the observations from flow cytometry and western blot (Fig. 2f, Supplementary Fig. 6). Through several measurements, we showed that GalNAc-LYTACs perform comparably to M6Pn-LYTACs, demonstrating the potential generality of lysosome targeting receptor-mediated degradation mechanism and extending the internalizing ligand set to scalable, homogeneous structures.
Mechanism of ASGPR-mediated degradation
To confirm that depletion of EGFR by Ctx-GalNAc was dependent on ASGPR, HEP3B cells were treated with siRNA targeting ASGPR. Degradation via the Ctx-GalNAc LYTAC was completely abolished following ASGPR knockdown, while EGFR degradation proceeded in cells transfected with non-targeting siRNA. Furthermore, Ctx-GalNAc treatment did not alter ASGPR levels in these cells (Fig. 3a, Supplementary Fig. 7). Co-incubation with excess exogeneous tri-GalNAc (10) (Supplementary Fig. 8) also inhibited degradation by Ctx-GalNAc (Fig. 3b), indicating a dependency on GalNAc binding. Treatment with bafilomycin A1 or chloroquine ablated EGFR degradation mediated by Ctx-GalNAc, confirming that the degradation mechanism promoted by GalNAc-LYTACs depends on a functional endocytic pathway (Fig. 3c).
Fig 3. GalNAc-LYTACs operate via an endo-lysosomal mechanism and attenuate EGFR-driven signaling.

a, Western blot of EGFR in HEP3B cells treated with 10 nM Ctx conjugates for 48 h following knockdown of ASGPR by siRNA. Non-targeting siRNA is included as a control. b, Degradation of EGFR in HEP3B cells determined by live-cell flow cytometry following co-treatment with DMSO or 5 mM of exogenous tri-GalNAc ligand (10) and 10 nM Ctx conjugates for 24 h. c, Western blot of EGFR degradation in HEP3B cells incubated with 10 nM Ctx conjugates and 50 nM bafilomycin A1 or 10 μM chloroquine for 24 h. d, Western blot of pEGFR, pAkt, and pMAPK in HEP3B cells following incubation of 10 nM Ctx conjugates for 48 h then 1 h stimulation with 100 ng/ml or 50 ng/ml of EGF. a, c are representative of two independent experiments. For b, data are the mean of three independent experiments ± SEM. P values were determined by unpaired two-tailed t-tests. d is a representative of three independent experiments.
Functional effect following LYTAC mediated degradation
Next, we sought to determine whether degradation of EGFR would impact downstream kinase signaling compared to treatment with Ctx alone. Following LYTAC treatment, HEP3B cells were stimulated with 100 ng/ml or 50 ng/ml of EGF for 1 hour to activate downstream kinase phosphorylation. After EGF stimulation, levels of phosphorylated EGFR (pEGFR), Akt (pAkt), and MAPK (pERK1/2) were reduced upon Ctx-GalNAc or Ctx-M6Pn treatment compared to Ctx. Stimulation with lower concentrations of EGF resulted in greater relative reductions in phosphorylated EGFR and phosphorylated Akt and ERK1/2 by both LYTACs compared to Ctx (Fig. 3d). These results highlight that LYTAC-driven degradation can exert more profound effects on downstream signaling compared to blocking of EGFR by Ctx alone.
GalNAc-LYTAC enables cell-specific degradation
The exclusive expression of ASGPR on hepatocytes should enable selective degradation of membrane proteins on liver cells. To test this hypothesis, we co-cultured HEP3B (ASGPR+, EGFR+, M6PR+) and HeLa-GFP (ASGPR–, EGFR+, M6PR+) and treated the co-culture with Ctx conjugates and analyzed EGFR degradation in each cell-type by flow cytometry (Fig. 4a). Ctx-GalNAc selectively ablated cell-surface EGFR from HEP3B cells, while HeLa-GFP maintained high EGFR expression. The small reduction of EGFR in HeLa-GFP results from covalent modification of the antibody and was independent of the ASGPR pathway and GalNAc binding (Supplementary Fig. 9). In contrast, Ctx-M6Pn degraded EGFR in both cell types as CI-M6PR is expressed in both HEP3B and HeLa-GFP (Fig. 4b, c). These data support the hypothesis that harnessing a recycling receptor with restricted expression enables LYTACs to degrade proteins in a cell-specific manner.
Fig 4. Ctx-GalNAc mediates selective degradation of EGFR in ASGPR expressing cells.

a, HEP3B (ASGPR+, EGFR+, M6PR+) and HeLa-GFP (ASGPR-, EGFR+, M6PR+) were co-cultured and treated with Ctx conjugates. Ctx-GalNAc degrades EGFR selectively in HEP3B cells. b, Representative flow cytometry plot of cell-surface EGFR levels in HEP3B cells and HeLa-GFP cells following co-culture and treatment with 50 nM cetuximab or conjugates for 48 h. c, Quantification of relative surface expression of EGFR in b determined by live cell flow cytometry. b is a representative of three independent experiments. For c, data are the mean of three independent experiments ± SEM. P values were determined by unpaired two-tailed t-tests.
GalNAc-LYTACs can target HER2
To examine the ability of ASGPR-directed LYTACs to degrade additional membrane targets, we developed a GalNAc-LYTAC targeting HER2. HER2 may regulate tumor progression in early stage HCC patients by inducing epithelial-mesenchymal transition, and can be upregulated in HCC34. Briefly, Pertuzumab (Ptz), an approved HER2 antibody for HER2-positive breast cancer, was conjugated to the tri-GalNAc ligand, and MALDI-MS analysis confirmed that Ptz had been labeled with 11 tri-GalNAc moieties (Ptz-GalNAc) (Supplementary Fig. 10). Ptz-GalNAc reduced 76% of total HER2 in HEPG2 cells, while Ptz alone degraded only 38% (Fig. 5a). Degradation by Ptz-GalNAc was ablated by co-incubation of excess exogenous tri-GalNAc (10) (Extended Data Fig. 1). Visualization by confocal microscopy revealed stark reduction and relocalization of HER2 signal in HEPG2 cells treated with Ptz-GalNAc compared to the cells treated with unmodified Ptz (Fig. 5b). Strikingly, 2-hour treatment with Ptz-GalNAc resulted in a punctate localization pattern of HER2 by confocal microscopy (Extended Data Fig. 2a). These puncta did not co-localize with early endosome antigen 1 (EEA1), suggesting that HER2 may be sequestered in alternate endocytic vesicles within 2 hours of treatment. Treatment with Ptz-M6Pn for 2 hours showed membrane-localized HER2 and did not indicate similar internalization. After 48 hours, treatment with Ptz-M6Pn also induced reduction and relocalization of HER2 signal (Extended Data Fig. 2b). These results suggest that there is a kinetic difference in the internalization mediated by M6Pn- and GalNAc-LYTACs, and that Ptz-GalNAc can remove membrane HER2 within 2 hours.
Fig. 5. GalNAc-LYTAC degrades the membrane proteins HER2 and integrins and induces anti-proliferative effects in HEPG2 cells.

a, Western blot of HER2 degradation in HEPG2 cells following incubation with 100 nM Pertuzumab (Ptz) or Ptz conjugates for 48 h. b, Visualization of HER2 degradation in HEPG2 cells by confocal microscopy after 100 nM Ptz conjugate treatments for 48 h. Scale bar, 30 μm. c, Synthesis of PIP-GalNAc. Tri-GalNAc-DBCO was conjugated to PIP, a knottin peptide that binds to multiple integrins. d, Degradation of cell surface integrins in HEPG2 determined by live cell flow cytometry following 44 h of treatment with 100 nM PIP or PIP-GalNAc using anti-αvβ3, anti-αvβ5, and PIP-Fc fusion for detection. PIP was genetically fused to the Fc domain of a mouse IgG2a to generate a PIP-Fc fusion construct that measures the surface expression of integrins recognized by PIP. e, Percent proliferation of HEPG2 cells following 44 h of treatment with 50, 100, and 200 nM PIP or PIP-GalNAc. Proliferation was quantified by phase confluence over time on IncuCyte. f, Time-course percent proliferation of HEPG2 cells during 44 h of treatment with 200 nM PIP or PIP-GalNAc. g, Percent proliferation of HEPG2 cells for 6 days following wash-out. Cells were treated with 200 nM PIP or PIP-GalNAc on day 0. PIP+ and PIP-GalNAc+ indicate the conditions where cells were washed on day 4 and replaced with fresh media without treatment. PIP++ and PIP-GalNAc++ indicate the conditions where cells were washed on day 4 and replaced with fresh media containing 200 nM PIP or PIP-GalNAc. h, Live HEPG2 imaging by IncuCyte throughout 5 days after treatment with 100 nM PIP or PIP-GalNAc. a is a representative of three independent experiments. Images are representative of two independent experiments for b and three independent experiments for h. d-g represent three independent experiments, where d,e show the mean of three independent experiments ± SEM. P values were determined by unpaired two-tailed t-tests.
GalNAc-LYTACs do not affect lysosomal health
Given that LYTACs mediate trafficking of membrane proteins to lysosomes, we asked if GalNAc-LYTACs affect lysosomal health in cells. Untreated HEP3B cells and cells treated with Ctx-GalNAc exhibited a similar number of lysosomes upon staining with Lysotracker, while staining intensity was reduced in cells treated with L-Leucyl-L-Leucine methyl ester (LLOMe), a lysosomal damaging reagent (Extended Data Fig. 3a). Untreated cells and Ctx-GalNAc treated cells exhibited greater Cathepsin B activity (Magic Red) compared to LLOMe treated cells. Although per cell quantitation showed that Ctx-GalNAc treatment resulted in reduction of Cathepsin B activity compared to untreated cells, both displayed more activity than Ctx treated cells (Extended Data Fig. 3b). This reduction of Magic Red signal by Ctx did not extend to other antibody treatments, as Ptz and Ptz-GalNAc did not show a significant change in Cathepsin B activity compared to the untreated HEPG2 cells (Extended Data Fig. 4a). We also examined the expression levels of ALG2-interacting protein X (ALIX), a marker for lysosomal membrane damage repair. While ALIX levels were increased in LLOMe treated cells, untreated and Ctx-GalNAc or Ptz-GalNAc treated cells exhibited significantly reduced ALIX staining. Ctx induced a modest increase in ALIX staining, but this phenomenon was not observed with Ptz (Extended Data Fig. 3c, 4b). Taken together, these data indicate that treatment with GalNAc-LYTACs does not disrupt lysosomal health relative to untreated cells.
Peptide-based LYTACs potentiate anti-proliferation
Prior LYTACs targeting membrane proteins were based on antibody or antibody fragments as the target binders. Although antigen-binding fragments (Fab) non-specifically conjugated to several M6Pn polymers could induce degradation13, we wondered if a small, synthetic peptide binder containing a single ASGPR ligand can promote degradation and induce enhanced functional consequences. To test this hypothesis, we used a targeting ligand composed of a polyspecific integrin-binding peptide (PIP), also known as EETI 2.5F, that was previously engineered to bind several tumor-associated integrins with high affinity35. In particular, PIP binds to αvβ1, αvβ3, αvβ5, αvβ6, and α5β1 integrins, which are known to be overexpressed on various cancer types and facilitate proliferation, migration, and metastasis36. Given that the 3.4 kDa PIP peptide is produced by solid phase peptide synthesis37, we readily incorporated azido-L-norvaline into the sequence to enable site-specific conjugation via a single tri-GalNAc-DBCO moiety, resulting in PIP-GalNAc (Fig. 5c, Supplementary Fig. 11).
We measured the surface levels of integrins by flow cytometry following treatment in HEPG2 cells and observed that PIP-GalNAc depleted cell-surface αvβ3 integrin 3-fold relative to PIP treatment alone. Treatment with PIP increased expression of integrin αvβ5, while PIP-GalNAc overturned this effect resulting in modest degradation. Measurement of additional integrins that interact with PIP was challenging due to their low surface expression or a lack of specific detection antibody. Nonetheless, we determined the total surface level of integrins that bind to PIP by utilizing a PIP-Fc fusion for staining of the Fc fragment38. Detection of the PIP-Fc revealed that PIP-GalNAc depleted about 60% of integrins while PIP alone degraded 40% (Fig. 5d).
We then asked if PIP-GalNAc has an effect on the proliferation of HEPG2 cells compared to the parent peptide. PIP-GalNAc was significantly more effective at inhibiting proliferation than PIP at various concentrations and durations of the treatment (Fig. 5e, 5f, Extended Data Fig. 5a). We validated that tri-GalNAc must be conjugated to PIP to potentiate anti-proliferation, as co-incubation of PIP with an equimolar concentration of exogenous tri-GalNAc exhibited similar effects as incubation with PIP alone (Extended Data Fig. 5b). To verify the involvement of ASGPR on enhanced anti-proliferation, cells were co-incubated with asialofetuin (ASF), which is a commonly used inhibitor of ASGPR39,40 (Extended Data Fig. 5c). ASF ablated the enhanced anti-proliferative effect of PIP-GalNAc, confirming that PIP-GalNAc must engage ASGPR. The anti-proliferative phenotype induced by PIP-GalNAc persisted after conjugate wash-out, while wash-out rescued proliferation in PIP treated cells. The long-acting inhibition of cell growth by PIP-GalNAc indicates that continuous incubation with a LYTAC is not required for modulating the phenotypic consequences resulting from cell-surface depletion of certain targets (Fig. 5g). Moreover, cells treated with PIP-GalNAc displayed noticeable morphological changes. Untreated and PIP treated cells generally displayed epithelial-like clusters, whereas the PIP-GalNAc treated cells formed smaller, circular clusters over the course of 5 days following treatment (Fig. 5h). Prior work demonstrated that αvβ3 integrin expression is associated with tumor size, invasion, and metastasis of HCC, and that antisense gene transfections of αv and β3 integrin reduced proliferation in HEPG2 cells41,42. Our results suggest that increased degradation of integrins by LYTACs can result in significantly enhanced functional effects compared to the parent binder alone.
Site-specific LYTACs improve pharmacokinetics in vivo
Our original LYTACs were constructed by non-specific conjugation of M6Pn polymers to lysine residues on antibodies or Fabs. However, the heterogenous nature of both the polymeric ligands and conjugation chemistry prevented rigorous structure-function relationship studies. Similarly, non-specific functionalization with tri-GalNAc affords heterogeneous LYTACs that are difficult to rigorously analyze for rational improvement. The ability of PIP-GalNAc to promote degradation with a single tri-GalNAc ligand (Fig. 5) suggested that simplified antibody-based LYTACs might be similarly effective and enable the study of architectural features essential for optimal LYTAC activity. Therefore, we generated a panel of GalNAc-LYTACs based on Ctx and Ptz using site-specific conjugation chemistry via the SMARTag technology, which involves genetic encoding of a reactive aldehyde handle on a specific site of the antibody scaffold43. To create a stable linkage between the tri-GalNAc motif and the aldehyde, we utilized a hydrazino iso-Pictet Spangler (HIPS) reaction scheme44,45 (Supplementary Fig. 12). To determine whether the location of tri-GalNAc ligand on the antibody scaffold would impact the degradation profile, we labeled three different sites of the antibodies – C-terminus, hinge, and CH1 heavy chain (Fig. 6a, Extended Data Fig. 6a). For Cetuximab, conjugation at the hinge resulted in the ligand to antibody ratio of 2, while conjugation in the C-terminus and CH1 positions resulted in a ligand to antibody ratio of 1 (Extended Data Fig. 6b, c). LYTACs resulting from site-specific conjugation at the C-terminus and the CH1 heavy chain of Ctx demonstrated >50% degradation of EGFR, while conjugation at the hinge only showed 40% degradation despite the increased ligand to antibody ratio (Fig. 6b). Steric hindrance may be an issue in the hinge region for bridging EGFR and ASGPR, resulting in modest differences in degradation efficiency. The degradation efficiency of the site-specific Ctx conjugates was slightly lower than that of the non-specifically labeled LYTACs. This could imply either that the antibody requires several tri-GalNAc moieties to achieve maximum degradation or that an optimal site for conjugation remains to be identified. However, we also generated site-specific conjugates based on Pertuzumab (Extended Data Fig. 7), and observed that a single tri-GalNAc conjugation at the hinge showed comparable degradation (70%) as the non-specific Ptz-GalNAc, while attachment at the C-terminus or the CH1 domain resulted in 60% degradation (Fig. 6c). This indicates that a homogeneous, site-specific GalNAc-LYTAC can achieve comparable degradation as the non-specific conjugate and that the optimal site of the conjugation may differ between antibodies, potentially due to their different binding sites of the target and the resulting orientation of the LYTAC conjugate between ASGPR and the target.
Fig. 6. Site-specific conjugation improves pharmacokinetics of antibody-based GalNAc-LYTACs.
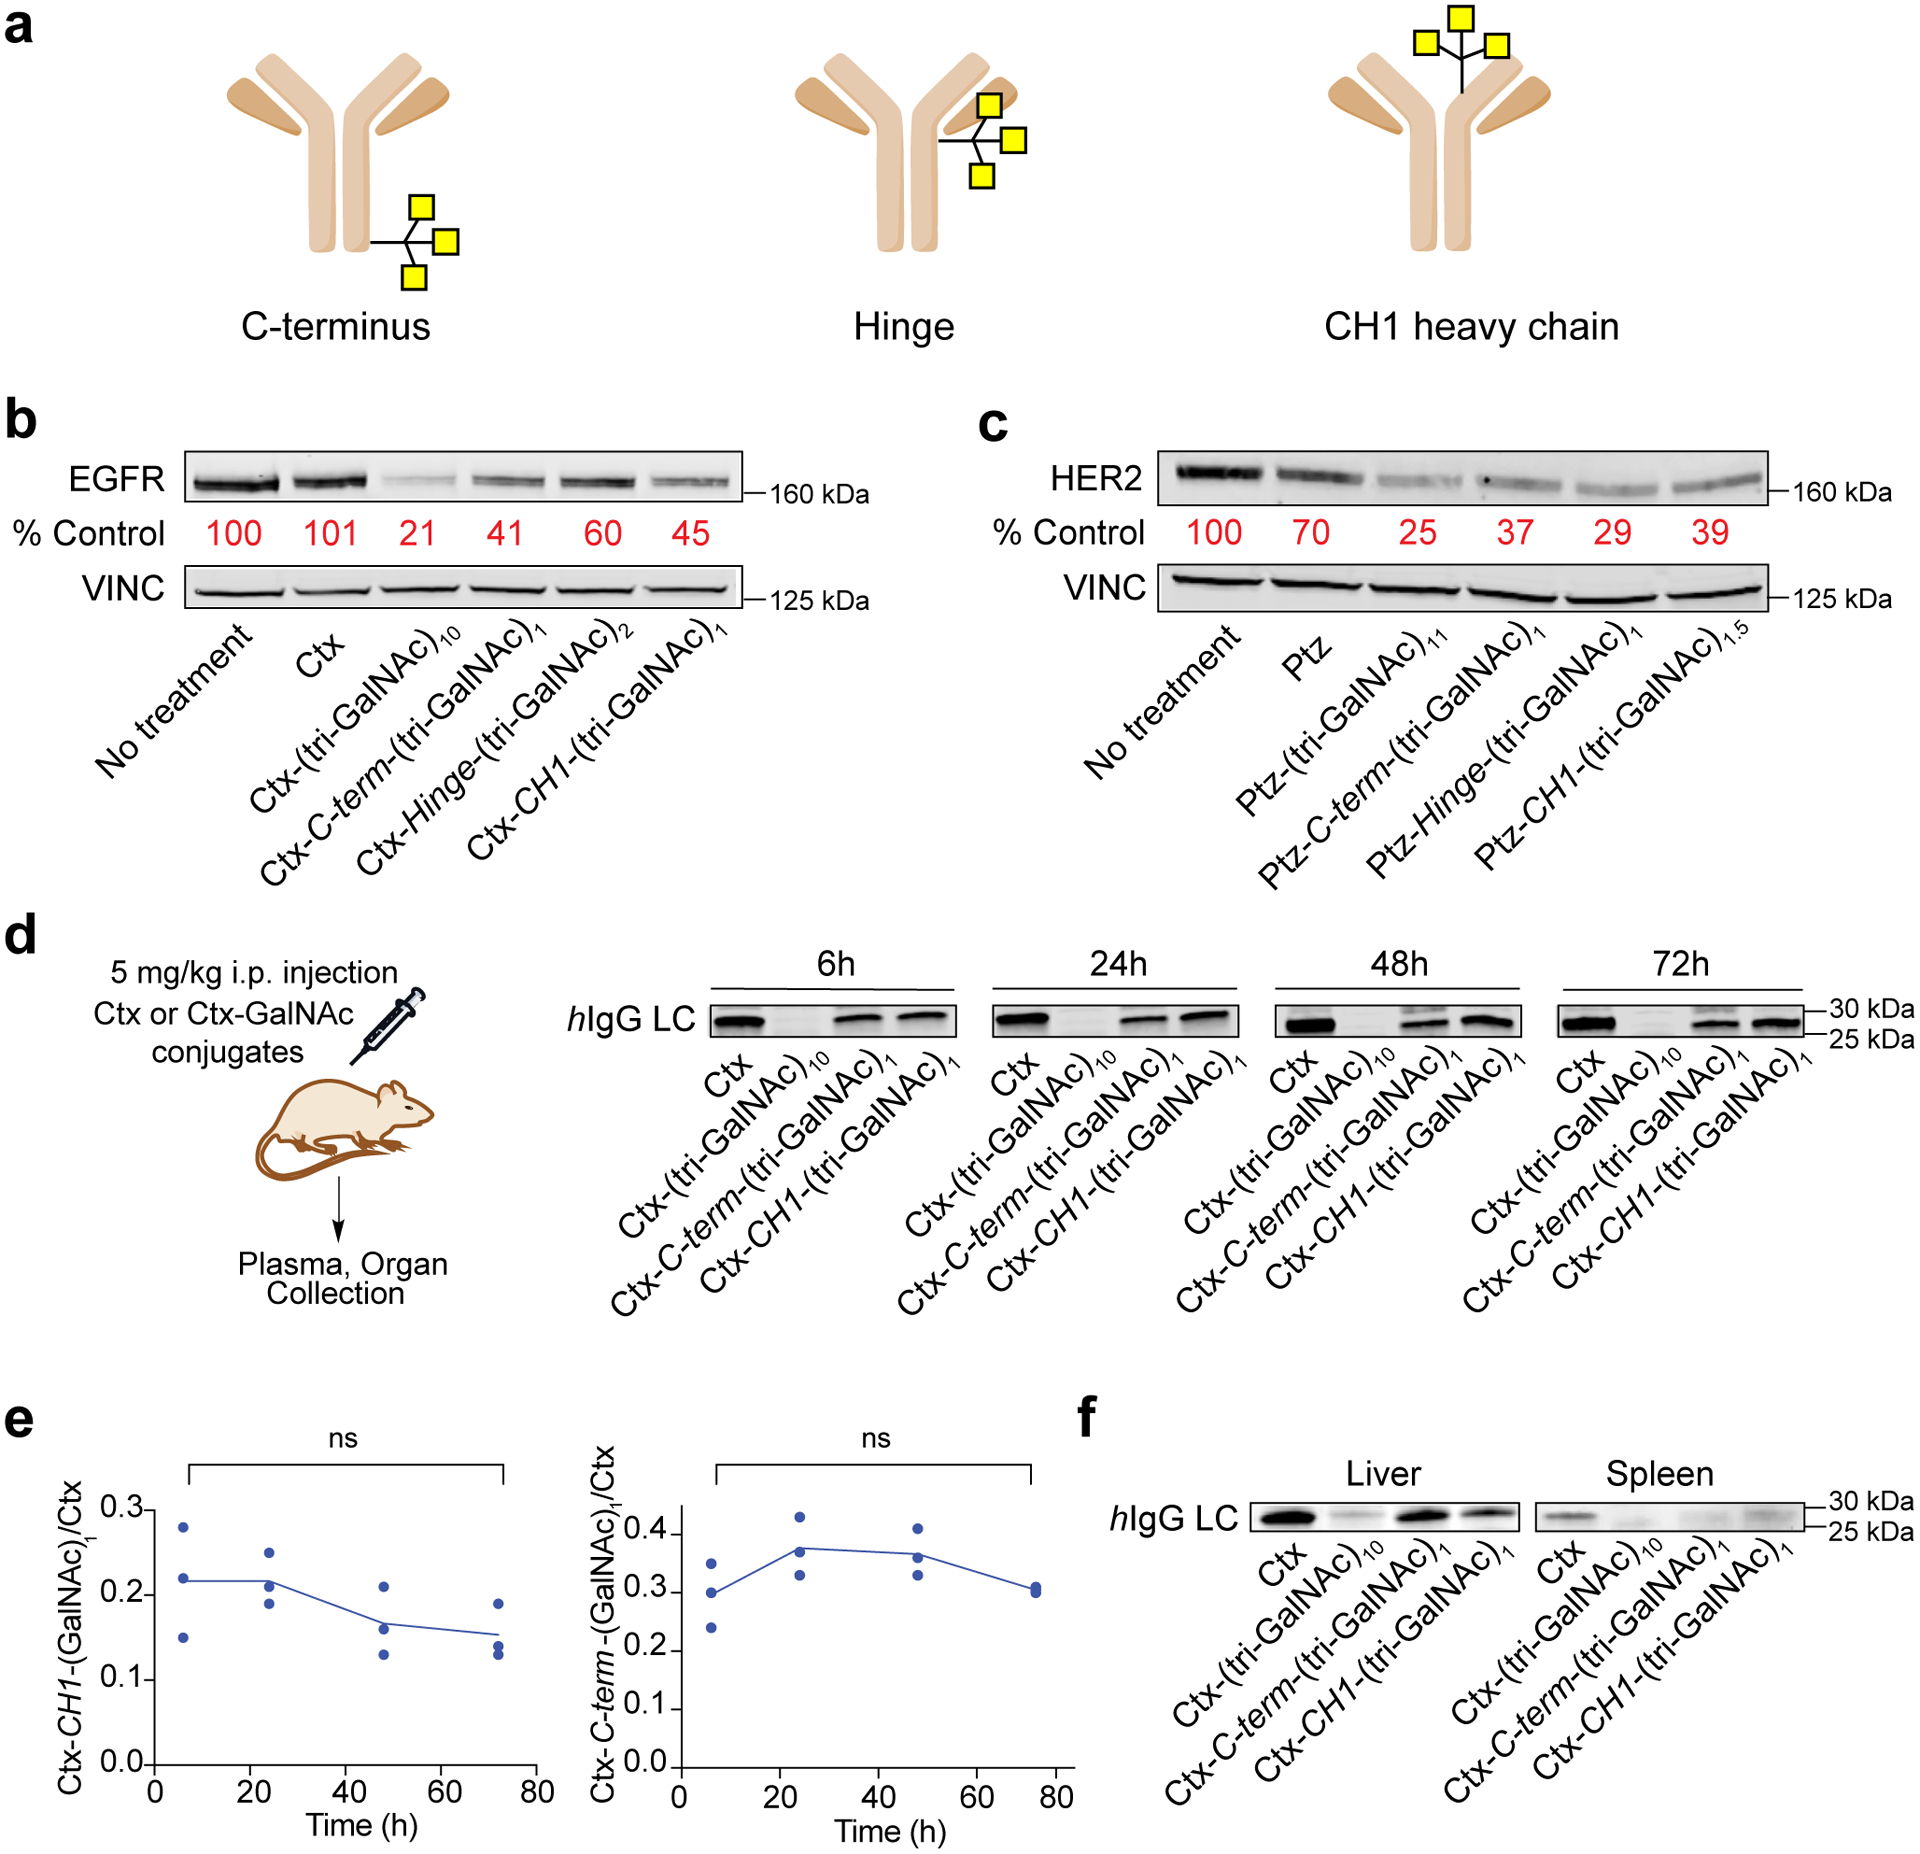
a, Site-specific conjugation of antibody at the CH1 domain, hinge, and C-terminus of the antibody using the SMARTag technology43. b, Western blot of EGFR degradation in HEP3B after treatments with 10 nM site-specific cetuximab conjugates for 48 h. c, Western blot of HER2 degradation in HEPG2 cells after treatments with 100 nM site specific pertuzumab conjugates for 48h. d, In vivo pharmacokinetic study of GalNAc LYTACs. Representative human-IgG light chain western blot of plasma following 5 mg/kg intraperitoneal injection of Ctx, Ctx-(tri-GalNAc)10, Ctx-CH1-(tri-GalNAc)1, Ctx-C-term-(tri-GalNAc)1. Plasma was collected 6, 24, 48, and 72 h post injection. e, Quantification of d representing the ratio of site specific Ctx conjugates over unmodified Ctx. Values are the average of three separate mice ± SEM. f, Representative human-IgG light chain blot of liver and spleen 72 h after Ctx and Ctx conjugate injections. For b-d, f, data are representative of three independent experiments. For e, data are the mean of three independent experiments ± SEM. P values were determined by unpaired two-tailed t-tests.
We observed that site-specifically labeled Ctx conjugates maintained similar binding to EGFR but exhibited lower uptake efficiency in HEPG2 cells compared to the nonspecific conjugates (Extended Data Fig. 8a, b). Based on these results, we asked whether site-specifically labeled conjugates might exhibit altered in vivo clearance profiles. To test this, Balb/c mice were intraperitoneally injected with 5 mg/kg of Ctx, nonspecifically conjugated Ctx-(GalNAc)10, Ctx-C-terminus-(GalNAc)1, or Ctx-CH1-(GalNAc)1 and plasma was collected at 6, 24, 48, and 72 hours to analyze their clearance rate. Ctx-(GalNAc)10 cleared rapidly before 6 hours (Fig. 6d), implying frequent treatments would be required to maintain reduced EGFR levels given that the degradation was not durable for more than 24 hours in vitro following wash-off after LYTAC treatment (Extended Data Fig. 9). However, site-specific conjugates showed an initial clearance followed by sustained presence 72 hours post injection (Fig. 6d, e), demonstrating that site-specific GalNAc-LYTACs may be advantageous in vivo due to less frequent dosing than nonspecific conjugates, enhancing the potential for sustained degradation of membrane targets. On the other hand, nonspecific conjugates may be preferred for rapid clearance of soluble targets.
Liver and spleen were collected at 72 hours and were probed for the presence of the conjugates. Ctx and Ctx-GalNAc conjugates were present in the liver while only Ctx was present in the spleen, reaffirming that Ctx-GalNAc conjugates preferentially accumulate in the liver (Fig. 6f). Based on the clearance regime of these nonspecific and site-specific LYTAC conjugates, we evaluated hepatic toxicity in mice with two different dosing schedules. Both a liver function panel from mouse serum and liver histological analysis showed that neither treatment with nonspecific nor site-specific Ctx-GalNAc result in toxicity in the liver compared to the untreated mice (Extended Data Fig. 10). Altogether, these results demonstrate that we can modulate the clearance regime of LYTACs by altering the number of ligands per antibody and that GalNAc-LYTACs are promising for future in vivo applications given their safety profiles even with repeated dosing.
Discussion
An advantage of LYTACs as a protein degradation modality is the ability to tune degradation to a specific cell-type expressing a given lysosome targeting receptor. To demonstrate this, we established that LYTACs can be designed to utilize ASGPR for liver cell-specific degradation. GalNAc-LYTACs efficiently ablated EGFR and HER2 in HCC cells. We verified that the mechanism of degradation was through the endo-lysosomal system and dependent on ASGPR internalization. Increased trafficking of proteins to the lysosome did not significantly impact lysosomal health, suggesting that removal of a desired protein does not negatively impact the lysosomal stability or homeostatic capabilities of a given cell and that LYTACs would be applicable to indications where avoiding cell damage is desirable. Co-culture of HCC cells with cells lacking ASGPR demonstrated that GalNAc-LYTACs are indeed capable of cell-specific degradation. GalNAc-LYTACs degraded EGFR and induced more substantial abrogation of downstream kinase signaling than inhibition alone. A synthetic peptide with a single tri-GalNAc moiety was able to degrade integrins and resulted in substantial anti-proliferative effect, which demonstrated that the structural design of LYTACs can be simplified to small conjugates. Finally, systematic variation of modification sites and GalNAc/antibody ratios through antibody engineering allowed us to optimize degradation activity and pharmacokinetic profile in vivo. Broadly, GalNAc-LYTACs represent a strategy for receptor-mediated and cell-specific degradation that can be applied to membrane proteins relevant in liver diseases, such as HCC, that does not depend on cell penetrance or carrier-degradation.
Additionally, we showed that GalNAc-LYTACs are far better at internalizing extracellular cargoes than M6Pn-LYTACs in HEPG2 cells, likely resulting from the higher surface expression of ASGPR relative to CI-M6PR in hepatocytes. Despite the difference in surface levels of these receptors, GalNAc- and M6Pn-LYTACs performed comparably in membrane protein degradation assays, though Ptz-GalNAc showed faster kinetics than Ptz-M6Pn. These observations suggest factors other than the expression levels of the recycling receptors modulate the degree of degradation. These factors might include the distinct sorting of these receptors, the rate of target release from the receptor to the lysosome, the rate of target turnover, or the rate of the receptor trafficking. Further studies that probe the mechanistic features influencing degradation mediated by endocytic receptors are needed, and may provide insight into rational strategies to enhance degradation efficiency.
Recently, antibody-PROTAC conjugates demonstrated HER2-dependent degradation via a mechanism of delivery similar to antibody-drug conjugates46. However, a general approach for tissue-specific degradation utilizing the UPS or intracellular autophagy machinery would require ligand development campaigns for tissue-restricted E3 ligases or autophagy regulators47,48. GalNAc-LYTACs serve as an example for applications to other recycling receptors that may be exploited for cell-specific degradation, such as mannose receptors for macrophage specific targeting49 and CD22 for B-cell selective degradation50. Additional discovery of recycling receptors with distinct and exclusive localization would expand the range of tissues or cells that LYTACs can target with selectivity. We envision that further structure-function studies in combination with mechanistic elucidation will determine the optimal architecture of LYTACs and provide structural understanding of degradation driven by lysosome targeting receptors.
Online Methods
General chemical synthesis procedures
Reagent-grade chemical reagents were purchased from Carbosynth, Sigma Aldrich, TCI, Click Chemistry Tools, and TCI. All chemical reactions were performed in standard, flame-dried glassware capped with rubber septa under an inert atmosphere of nitrogen unless stated otherwise. Stainless steel syringes or cannulae were used to transfer moisture-sensitive liquids. Anhydrous solvents (dichloromethane and N,N-dimethylformamide) were prepared by passage through an activated alumina column. Thin layer chromatography (TLC) was conducted on pre-coated glass plates covered with 0.2 mm silica gel for monitoring reactions. TLC was visualized with UV light, 5% H2SO4 in MeOH, and ninhydrin stain. Reaction mixtures were purified via column chromatography using Biotage SNAP KP-Sil or Ultra C18 cartridges (10–100g) with a Biotage Isolera Prime ACI automated fraction collector.
Chemical analysis instrumentation
Proton nuclear magnetic resonance (1H NMR) spectra were recorded on a Varian-400 spectrometer and proton-decoupled carbon-13 nuclear magnetic resonance (13C {1H} NMR) spectra were recorded on a Varian-500 NMR spectrometer at 25 °C. Spectra were reported in parts per million downfield of tetramethylsilane, and are referenced to the residual resonances of the protium NMR solvent (CD3OD: 3.31 [MeOH]) and carbon NMR solvent (CD3OD: 49.00 [MeOH]). MestReNova (v12.0.3) was used for all chemical NMR analysis. Data are reported as chemical shift, multiplicity (br = broad, s = singlet, d = doublet, t = triplet, q = quartet, quin = quintet, sept = septet, m = multiplet), coupling constants in Hertz (Hz), and integration. High-resolution mass spectrometric data were obtained on a Thermo Exactive Orbitrap mass spectrometer by the Stanford University Mass Spectrometry (SUMS) core facility.
Cell lines
Adherent cells were cultured in T75 flasks or 15 cm plates at 37 °C in a 5% CO2 atmosphere. HEP3B (ATCC), HUH7 (JCRB), and HeLa-GFP (MyBioSource) were cultured in DMEM supplemented with 10% fetal bovine serum (FBS) and 1% penicillin/streptomycin. HEPG2 (ATCC) were cultured in DMEM with low glucose supplemented with 10% fetal bovine serum (FBS) and 1% penicillin/streptomycin. Expi293 cells expressing formylglycine-generating enzyme from M. tuberculosis (tbFGE) were a generous gift from Melissa Gray, and were cultured with Expi293 Expression Medium (Thermo Fischer) supplemented with 2 μg/ml puromycin in 250 ml polycarbonate shaker flasks (Corning), rotating 120 rpm at 37 °C and 8% CO2.
LYTAC antibody conjugation
General procedure for antibody azide labeling
A 2 mg/ml solution of antibody was buffer exchanged into PBS using 7K Zeba size exclusion column. The antibody was reacted with 25 equiv. of NHS-(PEG)4-Azide (20 mg/ml in DMSO), and the reaction was incubated overnight at rt. The reaction mixture was filtered using 7K Zeba size exclusion column to yield the conjugated antibody.
General procedure for antibody tri-GalNAc labeling
Tri-GalNAc-DBCO (100 equiv) was weighed into an Eppendorf tube and 2 mg/ml solution of Antibody-(PEG)4-N3 was added. The reaction was manually agitated until the mixture was homogeneous. The reaction mixture was allowed to incubate at rt in the dark for 3 days and filtered using 40K Zeba size exclusion column.
HEPG2 internalization assay
HEPG2 cells were plated (100,000 cells/well in a 24-well plate) 2 days before the experiment. Cells were incubated with 200 μl of complete growth media with 50 nM Rabbit or Human IgG-647 and 25 nM goat anti-rabbit, cetuximab, or M6Pn or GalNAc-LYTACs for 1 hour. Following incubation, cells were washed with PBS three times, trypsinized, then transferred to a 96 well V-bottom plate. The cells were washed 3 times with PBS + 0.5% BSA + 5 mM EDTA, then incubated with Sytox Green for 15 minutes on ice prior to flow cytometry analysis.
HEPG2 co-localization live-cell imaging
To make Rabbit IgG-647, a 2 mg/ml solution of Rabbit IgG (Bio X Cell) was reacted with 15 equiv. of NHS-AF647 (Thermo Fischer) for overnight at rt. The reaction mixture was filtered using 7K Zeba size exclusion column to yield the conjugated antibody.
HEPG2 cells were plated (30,000 cells/well in an 8-well Labtek) 2 days before the experiment. Cells were incubated with 200 μl of complete growth media with 50 nM Rabbit IgG-647 and 25 nM goat anti-rabbit, goat anti-rabbit-M6Pn, or goat-anti-rabbit-GalNAc for 1 hour. Following incubation, cells were washed with HBSS then incubated with 50 nM Lysotracker in HBSS for 30 minutes at 37 °C. Cells were then washed with HBSS 3 times, incubated with Hoescht for 5 minutes, and imaged by confocal microscopy.
Protein degradation analysis by western blot
Adherent cells were plated (100,000 cells/well in a 24-well plate) one day before the experiment. Cells were incubated with 250 μl of complete growth media with 10 nM LYTAC or controls for indicated time. Cells were then washed with DPBS 3 times and lysed with RIPA buffer supplemented with protease inhibitor cocktail (Roche), 0.1% Benzonase (Millipore-Sigma), and phosphatase inhibitor cocktail (Cell Signaling Technologies) on ice for 30 minutes. The cells were scraped, transferred to Eppendorf tubes, and spun down at 21,000g for 15 minutes at 4 °C. The supernatant was collected and the protein concentration was determined by BCA assay (Pierce). Equal amounts of lysates were loaded onto 4–12% Bis-Tris gel and separated by sodium dodecyl sulfate-polacrylamide gel electrophoresis (SDS-PAGE). Then, the gel was transferred onto a nitrocellulose membrane and stained with REVERT Total Protein Stain (LI-COR), then blocked with Odyssey Blocking Buffer (TBS) (LI-COR) for 1 hour at rt. The membrane was incubated with primary antibody overnight at 4 °C, washed 3 times with TBS-T. Subsequently, the membrane was incubated with secondary antibody for 1 hour at rt, and washed 3 times with TBS-T for visualization with an Odyssey CLx Imager (LI-COR). Image Studio (LI-COR) was used to quantify band intensities.
Cell-surface EGFR and HER2 degradation analysis by flow cytometry
Adherent cells were plated (100,000 cells/well in a 24-well plate) one day before the experiment. Cells were incubated with 250 μl of complete growth media with 10 nM LYTAC or controls for indicated time. Cells were then washed with PBS 3 times, trypsinized for <5 minutes, and transferred to a 96-well V-bottom plate. The cells were washed 3 times with PBS + 0.5% BSA + 5 mM EDTA (FACS buffer) and incubated with primary antibody for 30 minutes on ice. The cells were washed 3 times with PBS + 0.5% BSA + 5 mM EDTA (FACS buffer) and incubated with secondary antibody for 30 minutes on ice. After washing 3 times with FACS buffer, cells were incubated with either Sytox Green or Sytox Blue for 15 minutes on ice. Flow cytometry was performed on either a BD LSR II or BD Accuri C6 Plus, and FlowJo software was used to gate on single cells and live cells for analysis. A representative gating strategy is shown in Supplementary Fig. 13.
Cell-surface integrin degradation analysis by flow cytometry
HEPG2 cells were plated (100,000 cells/well in a 24-well plate) one day before the experiment. Cells were incubated with 250 μl of complete growth media with 100 nM of PIP or PIP-GalNAc for 48 h. Cells were washed with integrin binding buffer (20 mM Tris, pH 7.4, 0.1% BSA, 150 mM NaCl, 2 mM CaCl2, 1 mM MgCl2, 1 mM MnCl2) and stained with primary antibodies on ice. For PIP-Fc staining, cells were washed with 5 mM EDTA in PBS to remove bound PIP following treatments, then stained with PIP-Fc (mouse IgG2a). After primary incubation, cells were washed 3 times with PBS + 0.5% BSA (PBSA) and incubated with secondary antibody in PBSA for 30 minutes on ice. After secondary incubation, cells were prepared for flow cytometry analysis as shown above.
Confocal microscopy for membrane protein degradation
Adherent cells were plated (30,000 cells/well in an 8-well Labtek) one day before the experiment. Cells were incubated with 200 μl of complete growth media with 10 nM LYTAC or controls for indicated time. Cells were then washed with DPBS and cells were stained with Membrite using the manufacturer’s protocol. Cells were fixed with 4% paraformaldehyde in PBS for 20 minutes at rt, washed 3 times, and permeabilized with 0.1% Triton for 5 minutes at 4 °C. Cells were washed 3 times with DPBS and blocked in 10% goat serum in PBS for 1 hour at rt, and incubated with primary antibody overnight at 4 °C. Cells were washed with DPBS, then incubated with secondary antibody and DAPI for 1 hour at rt. Cells were washed with DPBS and imaged with Nikon A1R confocal microscope using Plan Fluor 60x oil immersion 1.30-numerical aperture objective. 405-nm violet laser, 488-nm blue laser, 561-nm green laser, and 639-nm red laser were used.
siRNA knockdown
HEP3B (75,000 cells/well in 24 well plate) were transfected with 20 pmoles of siRNA (Dharmacon) and jetPRIME reagent using manufacturer’s specifications.
EGF stimulated phosphorylation
HEP3B cells were plated (100,000 cells/well in a 24-well plate) one day before the experiment. Cells were incubated with 250 μl of complete growth media with 10 nM LYTAC or controls for 48 hours. Following incubation, cells were washed 3 times with PBS, and 50 or 100 ng/ml of EGF was added and cells were incubated for 1 hr at 37 °C. Cells were washed and lysed for western blot analysis.
Co-culture assay
HEP3B (100,000 cells/well) and GFP-HeLa (20,000 cells/well) cells were co-cultured in 24-well plate. Cells were then treated with 50 nM of Ctx conjugates for 48 hours and surface-level EGFR was assessed by flow cytometry.
Lysosomal health assay
HEP3B cells were plated (30,000 cells/well in a 8-well Labtek) and treated with 10 nM Ctx or Ctx-GalNAc for 48 hours, or 1 μM of LLOMe for 1 hour. Cells were then treated with indicated markers. For all conditions, ImageJ was used to set the same threshold across images and quantify the fluorescence.
Lysotracker Red
Lysotracker Red (100 nM final concentration) was added to each well and incubated at 37 °C for 30 minutes protected from light. Following incubation, cells were washed with DPBS, fixed with 4% paraformaldehyde, washed, then stained with DAPI for 15 minutes.
Magic Red
Magic Red (Immunochemistry) was resuspended in DMSO and diluted according to the manufacturer’s specification. 8 μl of diluted Magic Red solution was added to each well (200 μl) and cells were incubated at 37 °C for 30 minutes protected from light. Following incubation, cells were washed with DPBS, fixed with 4% paraformaldehyde, washed, then stained with DAPI for 15 minutes.
ALIX
Cells were first washed, fixed with 4% paraformaldehyde and permeabilized with 0.1% Triton X-100. Cells were washed and blocked with 10% goat serum in PBS for 1 hour and incubated with ALIX primary antibody (BioLegend) overnight at 4 °C. Then cells were washed and stained with secondary antibody and DAPI.
Generation of PIP-GalNAc
Synthesis of PIP
Solid phase peptide synthesis, peptide cleavage, and folding methods are described in previous work that utilized azide-modified knottin synthesis37. It is important to note that 1,2-ethanedithiol (EDT) is excluded from the cleavage cocktail in this protocol because it reduces the azide of the unnatural amino acid. Briefly, solid phase peptide synthesis with standard Fmoc conditions was used to synthesize PIP with an unnatural amino acid, 5-azido-L-norvaline, at position 15. In this work, we also substituted tyrosine in place of phenylalanine at position 31 to facilitate peptide detection and concentration measurements by UV absorbance at 280 nm. The method used for HPLC purification was a linear gradient from 10% solvent B to 46% solvent B over 32 minutes (solvent A: water + 0.1% TFA; solvent B: acetonitrile + 0.1% TFA). A C18 prep column (Microsorb 100–5 C18 Dynamax, 5 μm, 21.4 mm × 250 mm, Agilent) was used at a 20 mL/min flow rate.
PIP-GalNAc conjugation
Tri-GalNAc-DBCO (5 mg/ml, 3 equiv) was added to PIP (1.88 mM in PBS). The reaction was incubated overnight at rt and purified by HPLC using an Agilent Infinity Lab Poroshell 120 EC-C19, 4.6 × 50 nm analytical LC column with a linear gradient from 10% solvent B to 46% solvent B over 32 minutes (solvent A: water + 0.1% TFA; solvent B: acetonitrile + 0.1% TFA) at 0.4 mL/min.
Anti-proliferation assay
HEPG2 cells (100,000 cells/well in a 24-well plate) were treated with various concentrations of PIP or PIP-GalNAc. After treatments were added, cells were imaged every 4 hours for the indicated times in the IncuCyte S3 Live-Cell Analysis system using the Phase imaging channel and 10X objective setting. For co-incubation experiment with asialofetuin, 10 mg/ml of asialofetuin (Sigma Aldrich) was treated with either PIP or PIP-GalNAc.
The following analysis was used to quantify Phase Confluence (%) in the Incucyte software: Segmentation Adjustment = 1, Cleanup- Hole Fill (μm2) = 300, Filters- Area Minimum (μm2) = 150. No other constraints were selected.
Percent proliferation was then calculated by normalizing Phase Confluence (%) values. Specifically, at any given timepoint n in the treatment time course (t = 0 → t = n), the change in Confluence from t = 0 to t = n (ΔConfluence t = n) was calculated for each well as follows: ΔConfluence t = n of well x = (Confluence t = n of well x) − (Confluence t = 0 of well x), where x represents any given well in the experiment. This ensures the value of each well is set to 0 at t = 0. The average ΔConfluence at the final time point of the untreated wells was set as the “Max Value” (equivalent to 100% Proliferation). Finally, data were normalized as follows:
Site-specific antibody expression
Plasmids of Antibodies with SMARTag
Cetuximab and Pertuzumab with SMARTag plasmid sequences are listed in the Supplementary Note 2. Plasmids were transformed into Stellar competent E. coli and isolated using PureLink HiPure Plasmid Filter Maxiprep Kit (Fischer Scientific).
Expression and purification of aldehyde-tagged Cetuximab antibodies
Antibodies were expressed in FGE-expressing Expi293 cells (a generous gift from Melissa Gray) following Thermo Fischer Scientific’s Expi293 expression protocol. 1 μg (0.5 μg heavy chain and 0.5 μg light chain encoding plasmid) of DNA per mL culture was used for transfection. Antibodies were harvested after 7 days by collecting the supernatant from centrifugation at 300g for 5 min, then centrifugation at 3200g for 30 min at 4 °C. The supernatant was filtered using a 0.22 μm filter unit (Fischer Scientific). Antibodies were purified using Protein A-Sepharose® 4B (Thermo Fisher Scientific) column chromatography in dark. The Protein A beads were packed into Econo-Pac chromatography column (BioRad). The beads were then washed with elution buffer (100 mM Glycine in MQ Water, pH 2.8) and equilibrated under PBS. The filtered supernatant was run through the Protein A column 3 times, washed with PBS 3 times, and eluted with elution buffer into a falcon tube containing 100 μl 1 M Tris buffer, pH 8. Antibody was then buffer exchanged to citrate buffer (50 mM sodium citrate, 50 mM NaCl, pH 5.5) using 30 kDa Amicon Centrifugal Filter.
Site-specific antibody conjugation
HIPS-azide44,45 was resuspended in DMSO to 5 mg/ml and was added to aldehyde-tagged antibody in citrate buffer. The reaction was agitated overnight at 37 °C protected from light. Upon reaction completion, the reaction mixture was filtered using a 40 kDa Zeba size exclusion column. Tri-GalNAc DBCO (50 equiv.) was then added to antibody labeled with HIPS-azide (>1 mg/ml) and the reaction mixture was incubated at rt for 3 days in dark. The reaction mixture was filtered using a 40 kDa Zeba size exclusion column and the protein concentration was determined from A280 using Nanodrop 200 Spectrophotometer.
Mass spectrometry
MALDI-MS
Samples were prepared by mixing the antibody sample with 1 μl SPA matrix (7.5 mg/ml in 0.1% TFA, 50% acetonitrile). The mixture was vortexed then loaded onto a MALDI stainless plate. The sample was dried at room temperature, and the MALDI-MS was acquired by AB SCIEX TOF/TOF and 5800 CovalX High Mass Detector with mass range of 10,000–250,000 Da and laser intensity of 5,000–5,300. Data was analyzed by AB SCIEX.
PIP and PIP-GalNAc MS
The samples were analyzed by ESI-MS on the Agilent 1260 HPLC and Bruker MicroTOF-Q II. The samples were run in a BioResolve RP mAb Polyphenyl 450Å 100×2.1mm from Waters, with a flow rate was 0.3ml/min. The injection volume was 2 μL. Data was collected in full scan MS mode. The collision RF setting was 800 Vpp.
Site-specific antibody analysis
Approximately 15–20 μg of each antibody conjugate in PBS was brought to 50 μL with 100 mM Tris, pH 8. Conjugates were reduced with 5 mM dithiothreitol for 18 minutes at 55 °C, and cysteines were alkylated with 20 mM iodoacetamide for 30 minutes at room temperature in the dark. Trypsin (Promega) was added at an approximate 1:50 protease:protein ratio and in-solution digestions proceeded overnight (~16 hours) at room temperature. The digestion was quenched by acidifying with formic acid prior to desalting with a 10 mg Strata-X polymeric reversed phase cartridge (Phenomenex). Desalting steps included: 1) conditioning the cartridge with 1 mL ACN, 2) addition of1 mL 0.2% formic acid (FA) in water, 3) loading the digestion mixture onto the cartridge, and 4) washing with 1 mL 0.2% FA in water. Peptides were eluted with 400 uL of 0.2% FA in 80% ACN, dried via lyophilization, and resuspended at 1 μg/μL in 0.2% FA.
Peptides were analyzed using 90 minute LC-MS/MS methods with a gradient that increased from 0% to 5% B over the first 6 minutes of the analysis, followed by an increase from 5% to 40% B from 6 to 70 minutes, an increase from 40% to 90% B from 70 to 71 minutes, isocratic flow at 90% B from 71 to 76 minutes, and a re-equilibration at 0% for 14 minutes. Mobile phases A and B were water and acetonitrile, respectively, each with 0.2% formic acid. Peptides were separated over a 25 cm EasySpray reversed phase LC column (75 μm inner diameter packed with 2 μm, 100 Å, PepMap C18 particles, Thermo Fisher Scientific), and precursors were ionized using an EASY-Spray ionization source (Thermo Fisher Scientific) source held at +2.2 kV compared to ground. The column temperature was held at 45 °C, and the inlet capillary temperature was held at 275 °C. Survey scans of peptide precursors were collected in the Orbitrap from 350–1350 Th with an AGC target of 1,000,000, a maximum injection time of 50 ms, RF lens at 60%, and a resolution of 60,000 at 200 m/z. Monoisotopic precursor selection was enabled for peptide isotopic distributions, precursors were selected for data-dependent MS/MS scans for 2 seconds of cycle time, and dynamic exclusion was set to exclude after 3 times with an exclusion duration of 10 seconds and a ±10 ppm window set around the precursor monoisotope. Precursor ions with z = 2–4 were isolated with a 1 m/z window with the quadruple and fragmented with both HCD at a normalized collision energy of 30 and ETD with supplemental HCD activation of 25 nce (EThcD) and calibrated charged dependent ETD parameters enabled51. Precursor ions with z = 5–10 were only fragmented with EThcD using the same conditions. Product ions from all MS/MS events were mass analyzed in the Orbitrap with a resolution of 60,000 at 200 m/z, with an AGC target of 50,000 and a maximum injection time of 118 ms. The mass range was set to automatic (normal) with a first mass set to 100 m/z. Precursor priorities were set to favor highest charge state and lowest m/z precursor ions, and an isolation window of 2 Th was used to select precursor ions with the quadrupole.
Separate fasta files were created for each cetuximab and pertuzumab conjugate. For each, the canonical antibody sequence was included in addition to sequences that included the SmarTag sequence at various locations as described in the text. SmarTag sequences included two versions: one with the cysteine remaining and one with the cysteine as a glycine to represent conversion by the formylglycine-generating enzyme. Raw files were searched against corresponding fasta sequences using MetaMorpheus52, and custom modifications were created for formylglycine (CO), HIPS-azide modifier (C23H33N7O4), and the intact tri-GalNAc modification (105H160N18O33). These searches confirmed exclusive modification at expected SmarTag sequences. Carbamidomehtylation of cysteine was set as a fixed modification with formylglycine, HIPS-azide, and tri-GalNAc as variable modifications on glycine. Tryptic cleavage specificity was set with up to 2 missed cleavages allowed. Appropriate m/z ratios for modified peptide sequences were calculated for variations that included carbamidomethylated cysteine (i.e., unconverted) in the SmarTag sequence, formylglycine in the SmarTag sequence (i.e., unreacted), HIPS-azide modified glycine in the SmarTag sequence, and tri-GalNAc-modified in the SmarTag sequence. An additional modification for the GalNAc-modified sequences was also calculated to account for possible gas-phase fragmentation of the tri-GalNAc moiety (modification on glycine = C44H52N8O7). The Xcalibur QualBrowser software suite was used to calculate areas under the curve for m/z values of appropriate charge states for each peptide species for each conjugate using the ICIS algorithm. Areas for each sequence and modification type were summed and ratios of total signal were generated, as shown in Extended Data Figures 6 and 7. The Interactive Peptide Spectral Annotator (IPSA) was used to aid with spectral annotation53.
In vivo pharmacokinetic study
Mouse experiments were performed at Stanford University in compliance with ethical regulations approved by the Administrative Panel on Laboratory Animal Care (APLAC) under protocol 31511. Mice were housed in the veterinary service center facility at Stanford where they were kept at a constant temperature and humidity, exposed to 12 h cycles of alternating light and dark, and were continuously provided water and standard rodent food. Female BALB/c (6–8 weeks old, Jackson Laboratory) were injected intraperitoneally with 5 mg/kg Ctx or Ctx conjugates. Blood was collected at 6, 24, 48, 72h via tail-bleed and plasma was separated. 2 μl of plasma was loaded onto SDS-PAGE (4–12% Bis-Tris gel) and transferred onto a nitrocellulose membrane for detecting human antibody presence (800CW goat anti-human, LI-COR). Organs were harvested at 72 hours, lysed with RIPA buffer supplemented with protease inhibitor and 0.1% Benzonase. Protein concentration was determined using BCA and 50 μg of total protein were loaded onto SDS-PAGE (4–12% Bis-Tris gel) and transferred onto a nitrocellulose membrane for detecting human antibody presence (800CW goat anti-human, LI-COR).
In vivo hepatic toxicity study
Female BALB/c (6–8 weeks old, Jackson Laboratory) were intraperitoneally injected with 5 mg/kg of Ctx or Ctx-(tri-GalNAc)10 every 2 days or 5 mg/kg Ctx or Ctx-C-term-(tri-GalNAc)1 every 4 days for a week. Blood and liver were harvested on day 8. Blood was submitted to the Stanford Veterinary Service Center (VSC) Diagnostics Lab for liver biochemistry testing (ALP, AST, ALP, bilirubin). Livers were fixed with 10% neutral buffered formalin and submitted to the Stanford Animal Histology Services (AHS) for histopathology analysis.
Statistical analyses
All statistical analyses were performed using GraphPad Prism 8. Two-tailed tests were used for all t-tests.
Figure illustration
Illustration of the cell membrane, organelles, and organs in Fig. 1a, 1b, 1e, and 2a were modified from Servier Medical Art, licensed under a Creative Common Attribution 3.0 Generic License. https://smart.servier.com
Data Availability
All data that supported the findings of this manuscript are included and are also available from the corresponding author upon request. Source data are provided with this paper. The flow cytometry gating strategy is provided in the Supplementary Information.
Extended Data
Extended Data Fig. 1. HER2 degradation by Ptz-GalNAc is inhibited by exogenous tri-GalNAc ligand.

Degradation of HER2 in HEPG2 cells determined by live-cell flow cytometry following co-treatment with DMSO or 5 mM of exogenous tri-GalNAc ligand (10) and 10 nM Ptz conjugates for 48 h. Data are the mean of three independent experiments ± SEM. P values were determined by unpaired two-tailed t-tests.
Extended Data Fig. 2. Ptz-GalNAc internalizes membrane HER2 within 2 hours.

a, Visualization of HER2 in HEPG2 cells by confocal microscopy after 10 nM pertuzumab conjugate treatments for 2 h. EEA1 is included as an early endosomal marker. b, Visualization of HER2 in HEPG2 cells by confocal microscopy after 10 nM pertuzumab conjugate treatments for 48 h. EEA1 is included as an early endosomal marker. Images are representative of two independent experiments. Scale bar, 30 μm.
Extended Data Fig. 3. Ctx-GalNAcs show similar lysosomal health as untreated cells.

a, Visualization and quantification of Lysotracker by confocal microscopy imaging of HEP3B cells treated with 10 nM cetuximab conjugates for 48 h or 1 μM LLOMe for 1 hour. b, Visualization and quantification of Cathepsin B activity using Magic Red in HEP3B cells treated with 10 nM cetuximab conjugates for 48 h or 1 μM LLOMe for 1 h. c, Visualization and quantification of ALIX in HEP3B cells treated with 10 nM cetuximab conjugates for 48 h or 1 μM LLOMe for 1 h. Scale bar, 30 μm. Values are the average ± SEM of three separate images from confocal microscopy. P values were determined by unpaired two-tailed t-tests.
Extended Data Fig. 4. Ptz-GalNAcs do not affect lysosomal health.
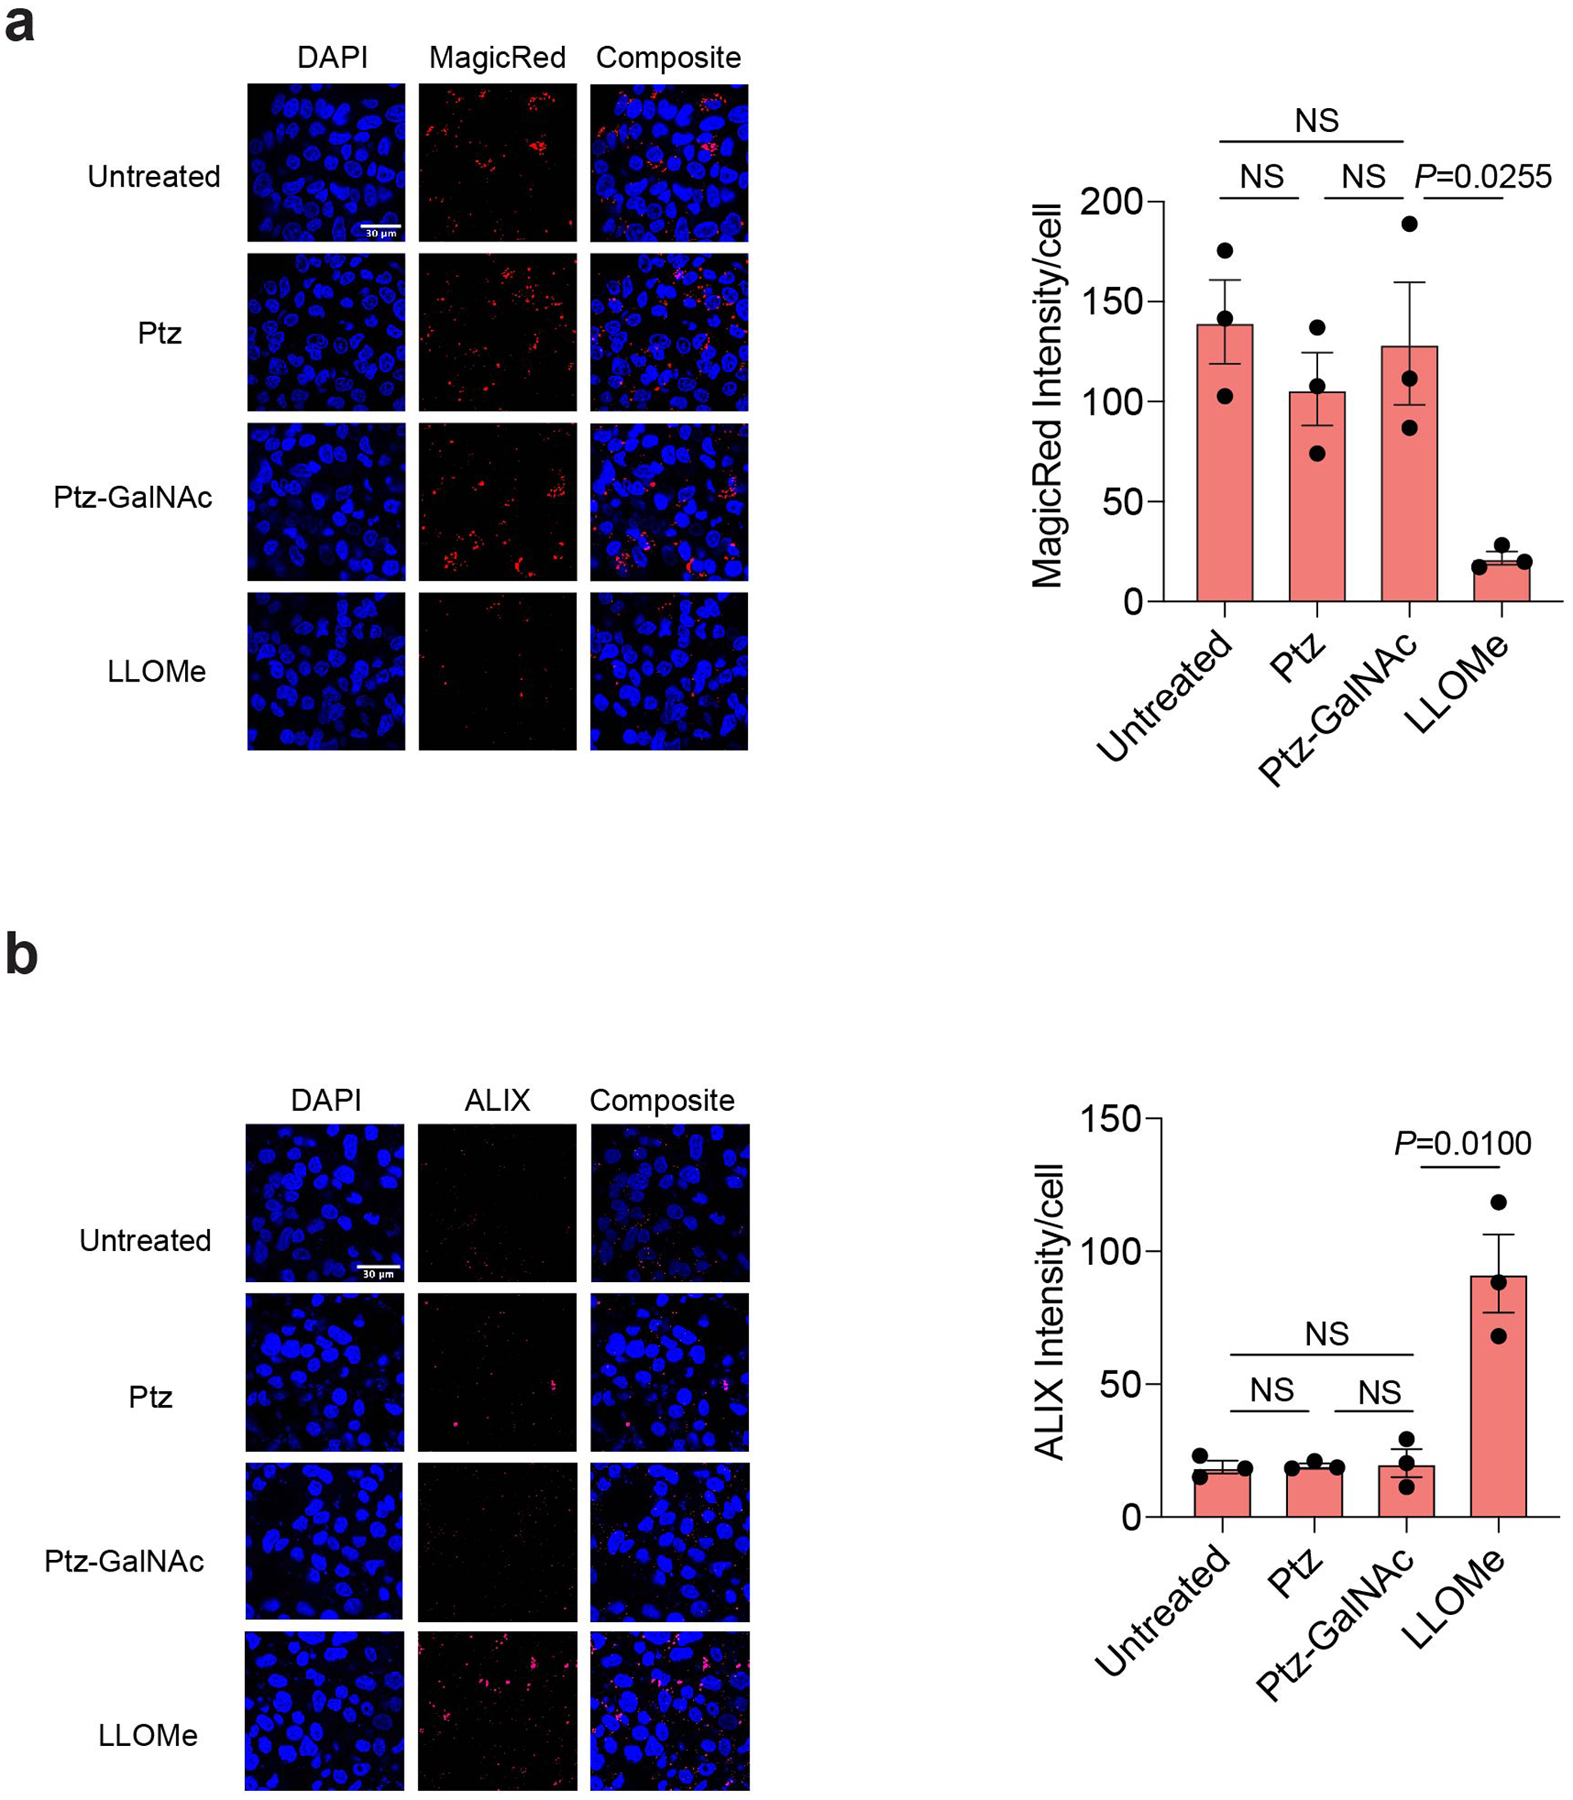
a. Visualization and quantification of Cathepsin B activity using Magic Red in HEPG2 cells treated with 100 nM Ptz conjugates for 48 h or 1 μM LLOMe for 1 h. b, Visualization and quantification of ALIX in HEPG2 cells treated with 100 nM Ptz conjugates for 48 h or 1 μM LLOMe for 1 h. Scale bar, 30 μm. Values are the average ± SEM of three separate images from confocal microscopy. P values were determined by unpaired two-tailed t-tests.
Extended Data Fig. 5. PIP-GalNAc conjugate and ASGPR are required for enhanced anti-proliferative effect.

a, Time-course percent proliferation of HEPG2 cells during 44 h of treatment with 50 or 100 nM PIP or PIP-GalNAc. b, Percent proliferation of HEPG2 cells over 48 h with 100 nM exogenous tri-GalNAc, 100 nM PIP, 100 nM PIP + 100 nM exogenous tri-GalNAc, or 100 nM PIP-GalNAc conjugate. c, Percent proliferation of HEPG2 cells at 48h following co-incubation of 100 nM of PIP or PIP-GalNAc with or without 10 mg/ml asialofetuin (ASF). Data are three independent experiments in b. For c, values are the average of three independent experiments ± SEM. Ordinary two-way ANOVA with adjusted P values shown from Tukey’s multiple comparisons.
Extended Data Fig. 6. Analysis of site-specific conjugation of the tri-GalNAc ligand to three different locations on cetuximab.

a, Reducing SDS-PAGE gel of Ctx and Ctx with aldehyde tag at C-terminus, Hinge, and CH1 Heavy chain. b, The proportion of signal seen between tri-GalNAc-modified (blue) peptides and peptides from the sequence that should have harbored the tri-GalNAc ligand but were seen unmodified (gray). Due to the dimer nature of the antibody, 50% of signal as modified indicates one site of modification per antibody molecule while 100% of signal as modified shows two ligands per antibody molecule. c, EThcD spectra of peptides showing site-specific localization of the tri-GalNAc ligand in the SMARTag sequence. Note, “M” represents the intact mass of the modified peptide, “GalNAc” shows the oxonium ion of a GalNAc residue, and the “M-GalNAc(x)” annotations show the intact mass minus × number of GalNAc moieties. a is a representative data from two independent experiments.
Extended Data Fig. 7. Analysis of site-specific conjugation of the tri-GalNAc ligand to three different locations on pertuzumab.

a, Reducing SDS-PAGE gel of Ptz with aldehyde tag at C-terminus, Hinge, and CH1 Heavy chain.b, The proportion of signal seen between tri-GalNAc-modified (blue) peptides and peptides from the sequence that should have harbored the tri-GalNAc ligand but were seen unmodified (gray). Due to the dimer nature of the antibody, 50% of signal as modified indicates one site of modification per antibody molecule while 100% of signal as modified shows two ligands per antibody molecule. c, EThcD spectra of peptides showing site-specific localization of the tri-GalNAc ligand in the SMARTag sequence. Note, “M” represents the intact mass of the modified peptide, “GalNAc” shows the oxonium ion of a GalNAc residue, and the “M-GalNAc(x)” annotations show the intact mass minus × number of GalNAc moieties. a is a representative data from two independent experiments.
Extended Data Fig. 8. Non-specific Ctx-GalNAc conjugates show enhanced uptake in vitro compared to site-specific Ctx conjugates.

a, Binding of Ctx conjugates in HEPG2 cells measured by live-cell flow cytometry following 1 h incubation on ice. b, Mean fluorescence intensity (MFI) relative to the control (human IgG-647 only) for HEPG2 cells incubated at 37 °C for 1 h with 50 nM human IgG-647 and 25 nM Ctx, Ctx-(tri-GalNAc)10, Ctx-C-term-(tri-GalNAc)1, or Ctx-CH1-(tri-GalNAc)1. MFI was determined by live cell flow cytometry. Values are the average ± SEM of three independent experiments. P values were determined by unpaired two-tailed t-tests.
Extended Data Fig. 9. Durability of LYTAC-mediated degradation in HEP3B cells.

a, HEP3B cells were treated with 10 nM Ctx conjugates, then washed with PBS 3 times, and were incubated in fresh media for 6, 24, 48h. EGFR levels were measured by western blot. 100 ng/ml of EGF was included as a control. b, Quantification of EGFR levels with and without wash-off following treatment with Ctx conjugates. Values are the average of three independent experiments ± SEM. P values were determined by unpaired two-tailed t-tests.
Extended Data Fig. 10. GalNAc-LYTACs do not cause hepatic toxicity in mice.
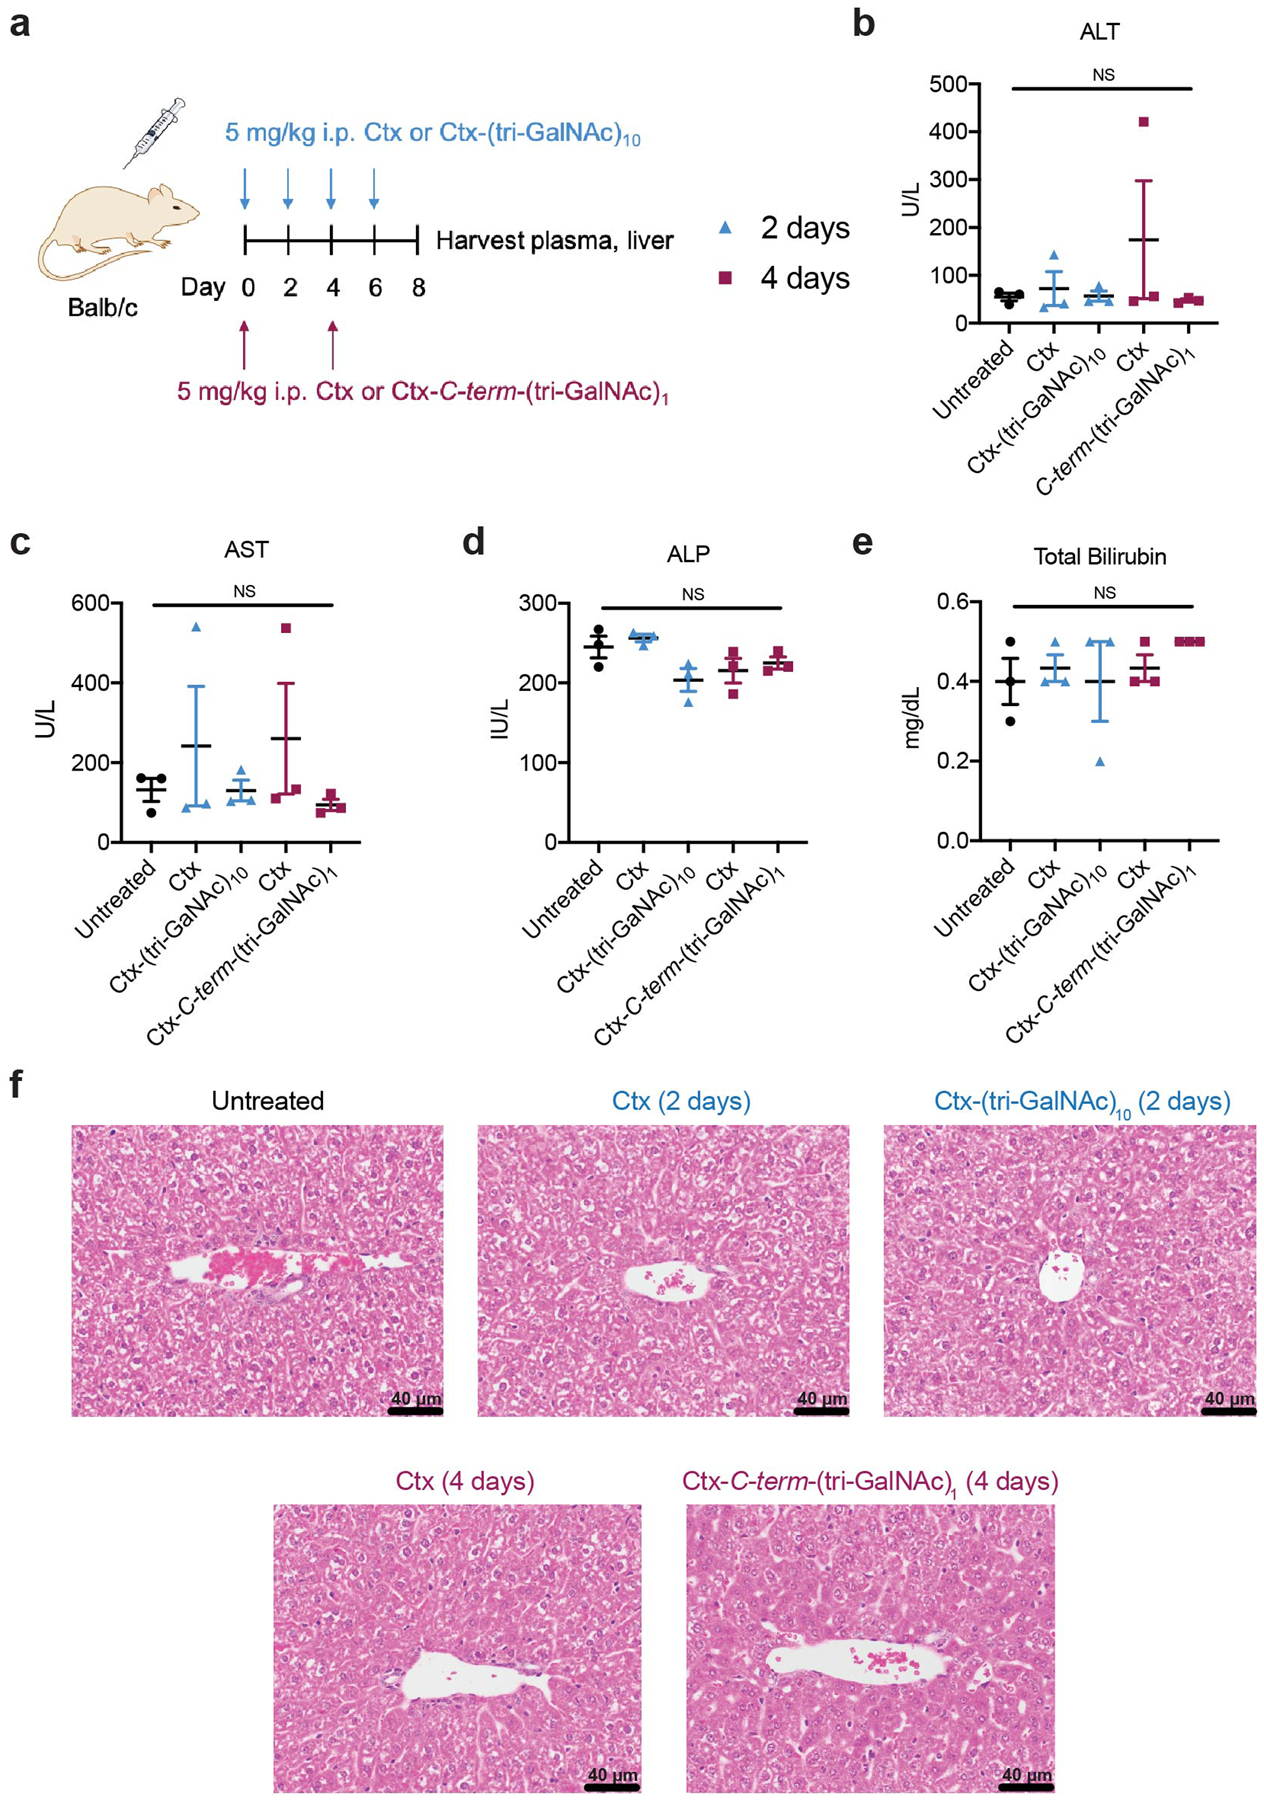
a, Balb/c mice were intraperitoneally injected with 5 mg/kg of Ctx or Ctx-(tri-GalNAc)10 every 2 days or 5 mg/kg Ctx or Ctx-C-term-(tri-GalNAc)1 every 4 days for a week. Plasma and liver were harvested on day 8, and levels of liver enzymes (b – alanine transaminase (ALT); c – aspartate transaminase (AST), d, alkaline phosphatase (ALP), e – total bilirubin) from plasma were measured. Values in b-e are the average of three independent mice ± SEM and were evaluated using Ordinary one-way ANOVA with Tukey’s multiple comparisons. f, Representative H&E staining of the liver from three independent experiments. Scale bar, 40 μm.
Supplementary Material
Acknowledgements
We thank M. A. Gray for providing FGE-expressing Expi293 cells and her expertise in site-specific antibody conjugations. We thank M. A. Gray and J.Tanzo for providing HIPS-azide and the Cochran laboratory for providing PIP-Fc (mIgG2a). We thank S. Pitteri and K.Lau for performing MALDI-TOF-MS characterization and analysis. We thank J.Vilches-Moure and the Stanford Animal Histology Services (AHS) for performing liver histopathology. We thank the Stanford VSC Diagnostics Lab for liver biochemistry testing. We thank K. Pedram for helpful discussions. We thank T. McLaughlin and Stanford University Mass Spectrometry for HRMS characterization. This work was supported in part by National Institutes of Health grant R01GM058867 (C.R.B) and a St. Baldrick’s / Stand Up 2 Cancer Pediatric Dream Team Translational Cancer Research Grant (J.R.C). Researchers were supported by National Science Foundation Graduate Research Fellowship (G.A. and C.L.M.), National Institute of General Medical Sciences F32 Postdoctoral Fellowship (S.M.B.), and National Institutes of Health grant K00CA21245403 (N.M.R.)
Footnotes
Competing interests
Stanford University has filed patent applications relating to lysosome targeting chimeras which are licensed to Lycia Therapeutics, listing G.A., S.M.B., and C.R.B. as co-inventors. G.A., S.M.B., C.L.M., J.R.C., and C.R.B. are co-inventors on a patent application relating to PIP-LYTACs filed by Stanford University (docket number STAN-1780PRV). C.R.B. is a co-founder and Scientific Advisory Board member of Lycia Therapeutics, Palleon Pharmaceuticals, Enable Bioscience, Redwood Biosciences (a subsidiary of Catalent), and InterVenn Biosciences, and a member of the Board of Directors of Eli Lilly & Company. J.R.C. is a founder of xCella Biosciences and Combangio Inc. and co-founder and director of Trapeze Therapeutics.
References
- 1.Krönke J, Udeshi ND, Narla A, Grauman P, Hurst SN, McConkey M, Svinkina T, Heckl D, Comer E, Li X, Ciarlo C, Hartman E, Munshi N, Schenone M, Schreiber SL, Carr SA & Ebert BL Lenalidomide Causes Selective Degradation of IKZF1 and IKZF3 in Multiple Myeloma Cells. Science 343, 301–305 (2014). [DOI] [PMC free article] [PubMed] [Google Scholar]
- 2.Lu G, Middleton RE, Sun H, Naniong M, Ott CJ, Mitsiades CS, Wong K-K, Bradner JE & Kaelin WG The Myeloma Drug Lenalidomide Promotes the Cereblon-Dependent Destruction of Ikaros Proteins. Science 343, 305–309 (2014). [DOI] [PMC free article] [PubMed] [Google Scholar]
- 3.Sakamoto KM, Kim KB, Kumagai A, Mercurio F, Crews CM & Deshaies RJ Protacs: Chimeric molecules that target proteins to the Skp1-Cullin-F box complex for ubiquitination and degradation. Proc. Natl. Acad. Sci 98, 8554–8559 (2001). [DOI] [PMC free article] [PubMed] [Google Scholar]
- 4.Winter GE, Buckley DL, Paulk J, Roberts JM, Souza A, Dhe-Paganon S & Bradner JE Phthalimide conjugation as a strategy for in vivo target protein degradation. Science 348, 1376–1381 (2015). [DOI] [PMC free article] [PubMed] [Google Scholar]
- 5.Nabet B, Roberts JM, Buckley DL, Paulk J, Dastjerdi S, Yang A, Leggett AL, Erb MA, Lawlor MA, Souza A, Scott TG, Vittori S, Perry JA, Qi J, Winter GE, Wong K-K, Gray NS & Bradner JE The dTAG system for immediate and target-specific protein degradation. Nat. Chem. Biol 14, 431–441 (2018). [DOI] [PMC free article] [PubMed] [Google Scholar]
- 6.Nabet B, Ferguson FM, Seong BKA, Kuljanin M, Leggett AL, Mohardt ML, Robichaud A, Conway AS, Buckley DL, Mancias JD, Bradner JE, Stegmaier K & Gray NS Rapid and direct control of target protein levels with VHL-recruiting dTAG molecules. Nat. Commun 11 (2020). doi: 10.1101/2020.03.13.980946 [DOI] [PMC free article] [PubMed] [Google Scholar]
- 7.Clift D, McEwan WA, Labzin LI, Konieczny V, Mogessie B, James LC & Schuh M A Method for the Acute and Rapid Degradation of Endogenous Proteins. Cell 171, 1692–1706.e18 (2017). [DOI] [PMC free article] [PubMed] [Google Scholar]
- 8.Naito M, Ohoka N & Shibata N SNIPERs—Hijacking IAP activity to induce protein degradation. Drug Discov. Today Technol 31, 35–42 (2019). [DOI] [PubMed] [Google Scholar]
- 9.Takahashi D, Moriyama J, Nakamura T, Miki E, Takahashi E, Sato A, Akaike T, Itto-Nakama K & Arimoto H AUTACs: Cargo-Specific Degraders Using Selective Autophagy. Mol. Cell 76, 797–810 (2019). [DOI] [PubMed] [Google Scholar]
- 10.Li Z, Wang C, Wang Z, Zhu C, Li J, Sha T, Ma L, Gao C, Yang Y, Sun Y, Wang J, Sun X, Lu C, Difiglia M, Mei Y, Ding C, Luo S, Dang Y, Ding Y, Fei Y & Lu B Allele-selective lowering of mutant HTT protein by HTT–LC3 linker compounds. Nature 575, 203–209 (2019). [DOI] [PubMed] [Google Scholar]
- 11.Li Z, Zhu C, Ding Y, Fei Y & Lu B ATTEC: a potential new approach to target proteinopathies. Autophagy 16, 185–187 (2020). [DOI] [PMC free article] [PubMed] [Google Scholar]
- 12.Mullard A First targeted protein degrader hits the clinic. Nat. Rev. Drug Discov 18, 237 (2019). [DOI] [PubMed] [Google Scholar]
- 13.Banik SM, Pedram K, Wisnovsky S, Ahn G, Riley NM & Bertozzi CR Lysosome-targeting chimaeras for degradation of extracellular proteins. Nature 584, 291–297 (2020). [DOI] [PMC free article] [PubMed] [Google Scholar]
- 14.Ghosh P, Dahms NM & Kornfeld S Mannose 6-phosphate receptors: new twists in the tale. Nat. Rev. Mol. Cell Biol 4, 202 (2003). [DOI] [PubMed] [Google Scholar]
- 15.Spiess M The asialoglycoprotein receptor: a model for endocytic transport receptors. Biochemistry 29, 10009–10018 (1990). [DOI] [PubMed] [Google Scholar]
- 16.Park EI, Mi Y, Unverzagt C, Gabius H-J & Baenziger JU The asialoglycoprotein receptor clears glycoconjugates terminating with sialic acidα2,6GalNAc. Proc. Natl. Acad. Sci 102, 17125–17129 (2005). [DOI] [PMC free article] [PubMed] [Google Scholar]
- 17.Stockert RJ The asialoglycoprotein receptor: relationships between structure, function, and expression. Physiol. Rev 75, 591–609 (1995). [DOI] [PubMed] [Google Scholar]
- 18.Matsuda S, Keiser K, Nair JK, Charisse K, Manoharan RM, Kretschmer P, Peng CG, V. Kel’in A, Kandasamy P, Willoughby JLS, Liebow A, Querbes W, Yucius K, Nguyen T, Milstein S, Maier MA, Rajeev KG & Manoharan M siRNA Conjugates Carrying Sequentially Assembled Trivalent N-Acetylgalactosamine Linked Through Nucleosides Elicit Robust Gene Silencing In Vivo in Hepatocytes. ACS Chem. Biol 10, 1181–1187 (2015). [DOI] [PubMed] [Google Scholar]
- 19.Springer AD & Dowdy SF GalNAc-siRNA Conjugates: Leading the Way for Delivery of RNAi Therapeutics. Nucleic Acid Ther. 28, 109–118 (2018). [DOI] [PMC free article] [PubMed] [Google Scholar]
- 20.Zimmermann TS, Karsten V, Chan A, Chiesa J, Boyce M, Bettencourt BR, Hutabarat R, Nochur S, Vaishnaw A & Gollob J Clinical Proof of Concept for a Novel Hepatocyte-Targeting GalNAc-siRNA Conjugate. Mol. Ther 25, 71–78 (2017). [DOI] [PMC free article] [PubMed] [Google Scholar]
- 21.Prakash TP, Graham MJ, Yu J, Carty R, Low A, Chappell A, Schmidt K, Zhao C, Aghajan M, Murray HF, Riney S, Booten SL, Murray SF, Gaus H, Crosby J, Lima WF, Guo S, Monia BP, Swayze EE & Seth PP Targeted delivery of antisense oligonucleotides to hepatocytes using triantennary N-acetyl galactosamine improves potency 10-fold in mice. Nucleic Acids Res. 42, 8796–8807 (2014). [DOI] [PMC free article] [PubMed] [Google Scholar]
- 22.Kanasty R, Dorkin JR, Vegas A & Anderson D Delivery materials for siRNA therapeutics. Nat. Mater 12, 967–977 (2013). [DOI] [PubMed] [Google Scholar]
- 23.Lee YC, Townsend RR, Hardy MR, Lönngren J, Arnarp J, Haraldsson M & Lönn H Binding of synthetic oligosaccharides to the hepatic Gal/GalNAc lectin. Dependence on fine structural features. J. Biol. Chem 258, 199–202 (1983). [PubMed] [Google Scholar]
- 24.Nair JK, Willoughby JLS, Chan A, Charisse K, Alam Md. R., Wang Q, Hoekstra M, Kandasamy P, Kel’in AV, Milstein S, Taneja N, O’Shea J, Shaikh S, Zhang L, van der Sluis RJ, Jung ME, Akinc A, Hutabarat R, Kuchimanchi S, Fitzgerald K, Zimmermann T, van Berkel TJC, Maier MA, Rajeev KG & Manoharan M Multivalent N-Acetylgalactosamine-Conjugated siRNA Localizes in Hepatocytes and Elicits Robust RNAi-Mediated Gene Silencing. J. Am. Chem. Soc 136, 16958–16961 (2014). [DOI] [PubMed] [Google Scholar]
- 25.Huang X, Leroux J-C & Castagner B Well-Defined Multivalent Ligands for Hepatocytes Targeting via Asialoglycoprotein Receptor. Bioconjug. Chem 28, 283–295 (2017). [DOI] [PubMed] [Google Scholar]
- 26.Huang Y Preclinical and Clinical Advances of GalNAc-Decorated Nucleic Acid Therapeutics. Mol. Ther. Nucleic Acids 6, 116–132 (2017). [DOI] [PMC free article] [PubMed] [Google Scholar]
- 27.Fitzgerald K, White S, Borodovsky A, Bettencourt BR, Strahs A, Clausen V, Wijngaard P, Horton JD, Taubel J, Brooks A, Fernando C, Kauffman RS, Kallend D, Vaishnaw A & Simon A A Highly Durable RNAi Therapeutic Inhibitor of PCSK9. N Engl J Med. 376, 41–51 (2017). [DOI] [PMC free article] [PubMed] [Google Scholar]
- 28.Probert MA, Zhang J & Bundle DR Synthesis of α- and β-linked tyvelose epitopes of the Trichinella spiralis glycan: 2-acetamido-2-deoxy-3-O-(3,6-dideoxy-d-arabino-hexopyranosyl)-β-d-galactopyranosides. Carbohydr. Res 296, 149–170 (1996). [DOI] [PubMed] [Google Scholar]
- 29.Ezzoukhry Z, Louandre C, Trécherel E, Godin C, Chauffert B, Dupont S, Diouf M, Barbare J-C, Mazière J-C & Galmiche A EGFR activation is a potential determinant of primary resistance of hepatocellular carcinoma cells to sorafenib. Int. J. Cancer 131, 2961–2969 (2012). [DOI] [PubMed] [Google Scholar]
- 30.Blivet-Van Eggelpoël M-J, Chettouh H, Fartoux L, Aoudjehane L, Barbu V, Rey C, Priam S, Housset C, Rosmorduc O & Desbois-Mouthon C Epidermal growth factor receptor and HER-3 restrict cell response to sorafenib in hepatocellular carcinoma cells. J. Hepatol 57, 108–115 (2012). [DOI] [PubMed] [Google Scholar]
- 31.Baselga J, Trigo JM, Bourhis J, Tortochaux J, Cortés-Funes H, Hitt R, Gascón P, Amellal N, Harstrick A & Eckardt A Phase II Multicenter Study of the Antiepidermal Growth Factor Receptor Monoclonal Antibody Cetuximab in Combination With Platinum-Based Chemotherapy in Patients With Platinum-Refractory Metastatic and/or Recurrent Squamous Cell Carcinoma of the Head and Neck. J. Clin. Oncol 23, 5568–5577 (2005). [DOI] [PubMed] [Google Scholar]
- 32.Vermorken JB, Trigo J, Hitt R, Koralewski P, Diaz-Rubio E, Rolland F, Knecht R, Amellal N, Schueler A & Baselga J Open-Label, Uncontrolled, Multicenter Phase II Study to Evaluate the Efficacy and Toxicity of Cetuximab As a Single Agent in Patients With Recurrent and/or Metastatic Squamous Cell Carcinoma of the Head and Neck Who Failed to Respond to Platinum-Based Therapy. J. Clin. Oncol 25, 2171–2177 (2007). [DOI] [PubMed] [Google Scholar]
- 33.Bondeson DP, Smith BE, Burslem GM, Buhimschi AD, Hines J, Jaime-Figueroa S, Wang J, Hamman BD, Ishchenko A & Crews CM Lessons in PROTAC Design from Selective Degradation with a Promiscuous Warhead. Cell Chem. Biol 25, 78–87.e5 (2018). [DOI] [PMC free article] [PubMed] [Google Scholar]
- 34.Shi J-H, Guo W-Z, Jin Y, Zhang H-P, Pang C, Li J, Line P-D & Zhang S-J Recognition of HER2 expression in hepatocellular carcinoma and its significance in postoperative tumor recurrence. Cancer Med. 8, 1269–1278 (2019). [DOI] [PMC free article] [PubMed] [Google Scholar]
- 35.Kimura RH, Levin AM, Cochran FV & Cochran JR Engineered cystine knot peptides that bind αvβ3, αvβ5, and α5β1 integrins with low-nanomolar affinity. Proteins Struct. Funct. Bioinforma 77, 359–369 (2009). [DOI] [PMC free article] [PubMed] [Google Scholar]
- 36.Desgrosellier JS & Cheresh DA Integrins in cancer: biological implications and therapeutic opportunities. Nat. Rev. Cancer 10, 9–22 (2010). [DOI] [PMC free article] [PubMed] [Google Scholar]
- 37.Cox N, Kintzing JR, Smith M, Grant GA & Cochran JR Integrin-Targeting Knottin Peptide–Drug Conjugates Are Potent Inhibitors of Tumor Cell Proliferation. Angew. Chem. Int. Ed 55, 9894–9897 (2016). [DOI] [PMC free article] [PubMed] [Google Scholar]
- 38.Kwan BH, Zhu EF, Tzeng A, Sugito HR, Eltahir AA, Ma B, Delaney MK, Murphy PA, Kauke MJ, Angelini A, Momin N, Mehta NK, Maragh AM, Hynes RO, Dranoff G, Cochran JR & Wittrup KD Integrin-targeted cancer immunotherapy elicits protective adaptive immune responses. J. Exp. Med 214, 1679–1690 (2017). [DOI] [PMC free article] [PubMed] [Google Scholar]
- 39.Arangoa MA, Düzgüneş N & Tros de Ilarduya C Increased receptor-mediated gene delivery to the liver by protamine-enhanced-asialofetuin-lipoplexes. Gene Ther. 10, 5–14 (2003). [DOI] [PubMed] [Google Scholar]
- 40.Treichel U, Meyer zum Büschenfelde KH, Dienes HP & Gerken G Receptor-mediated entry of hepatitis B virus particles into liver cells. Arch. Virol 142, 493–498 (1997). [DOI] [PubMed] [Google Scholar]
- 41.Jin Y, Chen J, Feng Z, Zhang Z, Fan W, Wang Y & Li J OPN and αvβ3 expression are predictors of disease severity and worse prognosis in hepatocellular carcinoma. PloS One 9, e87930 (2014). [DOI] [PMC free article] [PubMed] [Google Scholar]
- 42.Li J, Tan H, Dong X, Xu Z, Shi C, Han X, Jiang H, Krissansen GW & Sun X Antisense integrin αV and β3 gene therapy suppresses subcutaneously implanted hepatocellular carcinomas. Dig. Liver Dis 39, 557–565 (2007). [DOI] [PubMed] [Google Scholar]
- 43.Rabuka D, Rush JS, deHart GW, Wu P & Bertozzi CR Site-specific chemical protein conjugation using genetically encoded aldehyde tags. Nat. Protoc 7, 1052–1067 (2012). [DOI] [PMC free article] [PubMed] [Google Scholar]
- 44.Agarwal P, Kudirka R, Albers AE, Barfield RM, de Hart GW, Drake PM, Jones LC & Rabuka D Hydrazino-Pictet-Spengler Ligation as a Biocompatible Method for the Generation of Stable Protein Conjugates. Bioconjug. Chem 24, 846–851 (2013). [DOI] [PubMed] [Google Scholar]
- 45.Gray M, Stanczak MA, Xiao H, Pijnenborg JFA, Mantuano NR, Malaker SA, Weidenbacher PA, Miller CL, Tanzo JT, Ahn G, Woods EC, Läubli H & Bertozzi C Targeted glycan degradation potentiates the anticancer immune response in vivo. Nat Chem Bio 16, 1376–1374 (2020). [DOI] [PMC free article] [PubMed] [Google Scholar]
- 46.Maneiro M, Forte N, Shchepinova MM, Kounde CS, Chudasama V, Baker JR & Tate EW Antibody-PROTAC conjugates enable HER2–dependent targeted protein degradation of BRD4. ACS Chem. Biol (2020). doi: 10.1021/acschembio.0c00285 [DOI] [PMC free article] [PubMed] [Google Scholar]
- 47.Lai AC & Crews CM Induced protein degradation: an emerging drug discovery paradigm. Nat. Rev. Drug Discov 16, 101–114 (2017). [DOI] [PMC free article] [PubMed] [Google Scholar]
- 48.Schapira M, Calabrese MF, Bullock AN & Crews CM Targeted protein degradation: expanding the toolbox. Nat. Rev. Drug Discov 1–15 (2019). [DOI] [PubMed] [Google Scholar]
- 49.Stahl PD The Macrophage Mannose Receptor: Current Status. Am. J. Respir. Cell Mol. Biol 2, 317–318 (1990). [DOI] [PubMed] [Google Scholar]
- 50.O’Reilly MK, Tian H & Paulson JC CD22 Is a Recycling Receptor That Can Shuttle Cargo between the Cell Surface and Endosomal Compartments of B Cells. J. Immunol 186, 1554–1563 (2011). [DOI] [PMC free article] [PubMed] [Google Scholar]
- 51.Rose CM, Rush MJP, Riley NM, Merrill AE, Kwiecien NW, Holden DD, Mullen C, Westphall MS & Coon JJ A Calibration Routine for Efficient ETD in Large-Scale Proteomics. J. Am. Soc. Mass Spectrom 26, 1848–1857 (2015). [DOI] [PMC free article] [PubMed] [Google Scholar]
- 52.Solntsev SK, Shortreed MR, Frey BL & Smith LM Enhanced Global Post-translational Modification Discovery with MetaMorpheus. J. Proteome Res 17, 1844–1851 (2018). [DOI] [PubMed] [Google Scholar]
- 53.Brademan DR, Riley NM, Kwiecien NW & Coon JJ Interactive peptide spectral annotator: A versatile web-based tool for proteomic applications. Mol. Cell. Proteomics 18, S193–S201 (2019). [DOI] [PMC free article] [PubMed] [Google Scholar]
Associated Data
This section collects any data citations, data availability statements, or supplementary materials included in this article.
Supplementary Materials
Data Availability Statement
All data that supported the findings of this manuscript are included and are also available from the corresponding author upon request. Source data are provided with this paper. The flow cytometry gating strategy is provided in the Supplementary Information.