Abstract
Objective assessment of fluid status is vital for the appropriate management of patients with hyponatremia. Conventional physical examination suffers from several limitations in this regard, and point‐of‐care Doppler ultrasonography can be used as an adjunct to clinical and laboratory data in evaluating these patients.
Keywords: Doppler, Hyponatremia, Nephrology, POCUS, point‐of‐care ultrasound, VExUS
Objective assessment of fluid status is vital for the appropriate management of patients with hyponatremia. Conventional physical examination suffers from several limitations in this regard, and point‐of‐care Doppler ultrasonography can be used as an adjunct to clinical and laboratory data in evaluating these patients.

1. INTRODUCTION
Accurate assessment of volume status is crucial in the management of hyponatremia. Hypovolemic patients respond well to volume expansion, euvolemic hyponatremia is typically treated with fluid restriction, and those who are hypervolemic require fluid removal using diuretics or ultrafiltration in addition to addressing the underlying cause. However, volume status assessment is not so easy as it sounds as conventional physical examination findings have several shortcomings in this context. For example, jugular venous pressure (JVP) measurement may be limited by factors such as patient's body habitus, ambient lighting, and difficulty in distinguishing venous from carotid pulsations; lower‐extremity edema may be secondary to low plasma oncotic pressure or high vascular permeability, as opposed to elevated right atrial pressure; and in hospitalized patients lying supine, apparently resolving edema may actually be due to redistribution to the sacral region and does not necessarily reflect improvement in congestion. Similarly, the absence of crackles on lung auscultation does not exclude pulmonary congestion; one study showed that the sensitivity of lung crackles, peripheral edema, and elevated JVP together was only 58% when attempting to identify an elevated pulmonary capillary wedge pressure (PCWP) >22 mm Hg.1 Other commonly used parameters such as body weight and laboratory findings such as B‐type natriuretic peptide suffer from limitations as well.2, 3 Interestingly, in a study including nonedematous patients with hyponatremia (serum sodium <130 mEq/L), clinical assessment correctly identified only 47% of hypovolemic patients and 48% of those who were euvolemic.4
In the past few years, point‐of‐care ultrasonography (POCUS) has emerged as a valuable, noninvasive adjunct to physical examination in internal medicine and subspecialties including nephrology. Clinician‐performed bedside Doppler ultrasonography aids in the objective assessment of a patient's hemodynamic status and, when interpreted in conjunction with laboratory data such as urine electrolytes, can effectively guide therapy in disorders such as hyponatremia.5 Herein, we present one such case, demonstrating how this can be achieved.
2. CASE PRESENTATION
A 92‐year‐old woman with a past medical history of atrial fibrillation, pulmonary hypertension, chronic kidney disease stage III with a baseline serum creatinine ~1.1–1.3 mg/dl, and heart failure with preserved ejection fraction was admitted for the evaluation of acute kidney injury and hyponatremia, found on the routine outpatient laboratories. Serum creatinine was 1.73 mg/dl; blood urea nitrogen, 53 mg/dl (previous value ~20 mg/dl); and serum sodium, 125 mmol/L (baseline 133–137 mmol/L) at the time of admission. The patient reported decreased fluid intake, skin had wrinkles and bruises, and urine sodium was <20 mmol/L. Based on this information, the admitting provider felt it was hypovolemic hyponatremia and administered a bolus of normal saline as well as held bumetanide that she was taking at home. However, the serum sodium worsened to 122 mmol/L, at which time nephrology was consulted. On the day of the consult, two physicians from different specialties felt the patient was “euvolemic” based on independent assessment. Repeat urine electrolytes still showed urine sodium of <20, urine osmolality of 279 mOsm/kg, and serum osmolality of 265 mOsm/kg (reference: 276–295). N‐terminal pro B‐natriuretic peptide (NT‐proBNP) was elevated at 9040 pg/mL (reference: <450) but was similar to that of five months ago (8323 pg/ml; serum creatinine 1.2 mg/dl at that time).
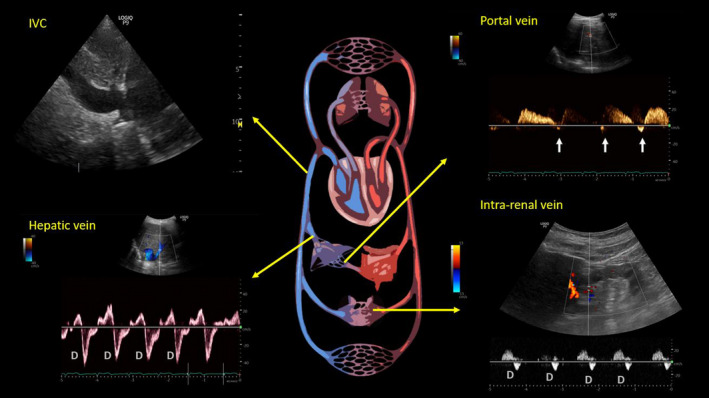
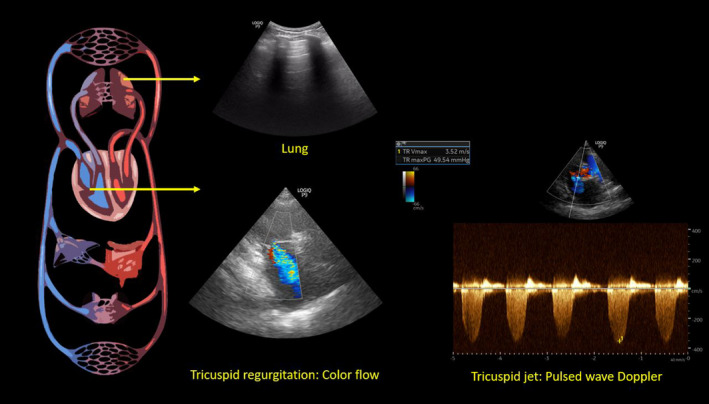
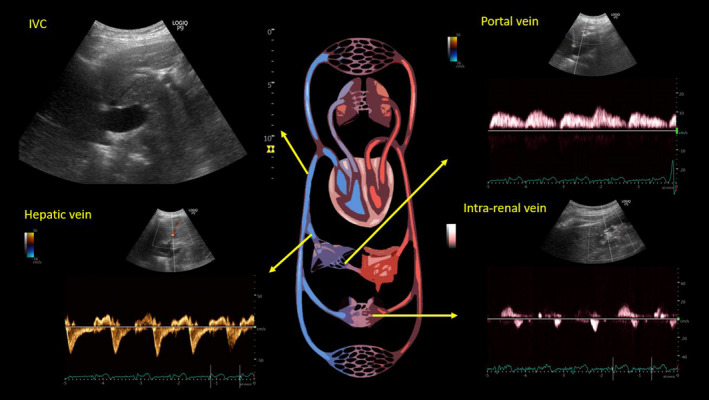
We undertook a thorough POCUS‐assisted hemodynamic assessment to elucidate her volume status. Inferior vena cava (IVC) had a maximal diameter of 2.4 cm and less than 50% collapsibility with inspiration consistent with a high right atrial pressure (RAP) of approximately 15 mm Hg.6 As the patient has chronic pulmonary hypertension and IVC can be dilated at baseline, we performed further evaluation of the venous congestion using bedside Doppler ultrasound. Hepatic vein Doppler showed only diastolic wave below the baseline (systolic flow reversal), suggestive of severe congestion. Similarly, intrarenal vein showed venous flow only during diastole (monophasic pattern). Portal vein was 100% pulsatile with flow reversal at the end of each cardiac cycle, also consistent with severe flow reversal (Figure 1). Color Doppler evaluation of the tricuspid valve was suggestive of a moderate‐to‐severe regurgitation. Based on the tricuspid regurgitant jet, right ventricular systolic pressure was ~64.5 mm Hg (Figure 2), which was slightly elevated (or similar accounting for variations in technique, but not low) from a baseline value of 59 mm Hg on cardiology‐performed echocardiogram performed 3 months ago. Lung ultrasound was not suggestive of congestion and consisted of predominantly A‐line pattern. While one may argue these findings could be seen in chronic pulmonary hypertension, in our experience from the cardiorenal clinic at our institution,7 portal vein tends to be less congested compared to hepatic and intrarenal veins even in patients with severe chronic pulmonary hypertension. This is likely because central venous pressure is not completely transmitted to portal vein through the hepatic sinusoidal system as opposed to hepatic vein, which is a direct tributary of the IVC.8 In addition, low urine sodium taken together with these findings is more suggestive of hypervolemia rather than euvolemia. Based on this information, we recommended intravenous diuretic therapy. Serum sodium quickly improved to 124 mmol/L the next day and 127 mmol/L the day after, at which time she was transitioned to oral diuretics and discharged from the hospital. Interestingly, her serum creatinine also improved and trended down to 1.3 mg/dl at discharge suggestive of congestive nephropathy. A repeat POCUS examination at the time of discharge showed improvement in the portal vein pulsatility as we expected, although there was no significant change in hepatic and intrarenal waveforms as well as IVC collapsibility (Figure 3). Serum sodium and NT‐proBNP at 1‐week follow‐up were 137 mmol/L and 7801 pg/ml, respectively.
FIGURE 1.

Ultrasound of the inferior vena cava (IVC) and abdominal vein Doppler at the time of initial nephrology consultation. Arrows in the portal vein waveform indicate flow reversal. D = diastolic wave. As mentioned in the text, D‐only pattern represents severe congestion
FIGURE 2.

Focused cardiac ultrasound at the time of initial consult demonstrating tricuspid regurgitation—color flow and pulsed wave Doppler waveform. Right ventricular systolic pressure is obtained by adding the right atrial pressure (15 mm Hg in this case) to the tricuspid gradient (49.54 mm Hg in this case). Also note the representative lung image from the patient demonstrating normal horizontal artifacts (A‐lines)
FIGURE 3.

Ultrasound of the inferior vena cava (IVC) and abdominal vein Doppler at the time of discharge. While hepatic and intrarenal vein Doppler waveforms remain essentially unchanged, note the improvement in portal vein waveform. Although more pulsatile than normal, there is no flow reversal
3. DISCUSSION
POCUS uses a pump, pipes, and leaks schema to assess fluid status as we previously described.5 The “pump” is the heart, assessed via focused cardiac ultrasound (FoCUS); the “pipes” refer to the IVC and intraabdominal venous system; and “leaks” constitute pulmonary congestion and intra‐abdominal free fluid. FoCUS rapidly assesses pump function in a hypotensive patient by analyzing the “5 Es”: left ventricular ejection, presence or absence of pericardial effusion, equality (relative right ventricular size), entrance (IVC size and collapsibility), and exit (ascending aorta diameter) as described by Kennedy Hall et al.9 Clinicians with advanced training in POCUS can perform additional evaluations such as stroke volume measurement using left ventricular outflow tract pulsed wave Doppler, estimation of right ventricular systolic pressure using tricuspid regurgitant jet continuous wave Doppler, and left ventricular filling pressure assessment using mitral valve pulsed wave and tissue Doppler.
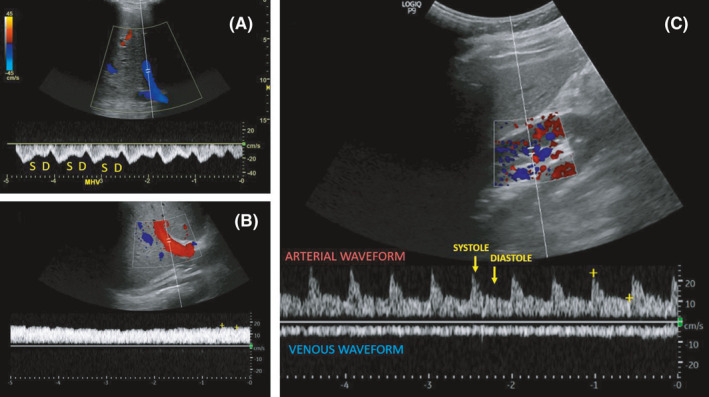
The first step in analyzing venous congestion is the assessment of the IVC. POCUS uses the maximal diameter and collapsibility of the IVC as a surrogate measurement for RAP. Normally, inspiration causes negative intrathoracic pressure, which compresses and collapses the IVC; the magnitude of inspiratory effort can influence the degree of collapse, and hence, patients are usually asked to “sniff” to standardize the effort. An IVC diameter ≤2.1 cm and a collapsibility >50% with a sniff indicate normal RAP of 3 mm Hg (0–5 mm Hg); IVC diameter >2.1 cm with <50% collapse indicates high RAP of 15 mm Hg (10–20 mm Hg); and an intermediate value of 8 mm Hg (5–10 mm Hg) is assigned to scenarios in between.6 Despite being a good indicator of RAP and popular application among novice POCUS users, IVC ultrasound is subject to numerous pitfalls in day‐to‐day practice especially when used in isolation.10 Recently, Beaubien‐Souligny et al. proposed a venous excess ultrasound grading system (VExUS), which uses Doppler evaluation of the hepatic, portal, and intrarenal veins to quantify systemic congestion at the end‐organ level when used in patients with a dilated IVC.11 We incorporated it into our practice and found it immensely useful when evaluating patients with fluid and electrolyte disorders including hyponatremia.12 Briefly, a normal hepatic vein Doppler waveform comprises of two main waves below the baseline (flow away from the transducer and toward the heart), called the S and D waves that occur during ventricular systole and diastole, respectively. With increasing RAP, the amplitude of the S wave decreases and finally reverses, especially when accompanied by tricuspid regurgitation. This leaves only the D wave below the baseline as seen in our patient.
The portal vein is separated from the systemic circulation by the liver sinusoids and splanchnic capillaries, dampening flow changes during the cardiac cycle. Normal portal venous waveform is relatively continuous with less than 30% pulsatility above the baseline (flow toward the transducer). With increasing RAP, the pulsatility increases and eventually flow reversal occurs during each cardiac cycle as seen in our patient.
The normal intrarenal vein waveform, measured at the interlobar vessels, is continuous, similar to that of the portal vein; as RAP increases, these veins become less compliant, creating pulsatile biphasic flow with distinct systolic and diastolic waves. As RAP increases further, a monophasic (diastolic‐only) flow pattern may develop, in which flow is dependent solely on right ventricular filling (ie, flow only during diastole as in our patient). Figure 4 illustrates normal venous waveforms.
FIGURE 4.

Normal hepatic vein (A), portal vein (B), and intrarenal vein (C) Doppler waveforms. S = systolic wave, D = diastolic wave. Note that the normal flow is below the baseline in hepatic and intrarenal veins, while it is above the baseline in portal vein. Figure adapted from senior author's previously published open access article, reference # 15
How venous congestion acts as a stimulus for antidiuretic hormone and contributes to hyponatremia is incompletely understood at this time. Nevertheless, it provides a valuable data point in the evaluation of a hyponatremic patient when used in conjunction with clinical and laboratory parameters. Through this case report, we do not intend to convey POCUS is a gold standard in establishing the nature of hyponatremia. Over‐reliance on any single parameter, whether history or physical examination findings or even POCUS, can lead to diagnostic errors. For example, patient was initially thought to be hypovolemic based on self‐reported “not drinking well” and wrinkled skin (due to old age) that was confused with dry skin. Later, she was thought to be euvolemic based on the absence of pedal edema and moist mucous membranes. While the above‐discussed Doppler waveform changes are reversible with decongestive therapy in most instances such as acute heart failure, that might not be the case in chronic congestive states such as pulmonary hypertension or severe tricuspid regurgitation, which makes the assessment of fluid status further complicated.13, 14, 15 This is the greatest confounding factor in interpreting POCUS findings in this case. Similarly, although the NT‐proBNP was high, it was only marginally elevated compared to baseline, that too in the setting of reduced renal clearance. CA 125 is another biomarker that has recently shown to outperform NT‐proBNP for the assessment of venous congestion.16 Interestingly, renal insufficiently is less likely to affect its levels unlike NT‐proBNP, although further studies are needed to establish its utility in various congestive states.17 Therefore, clinicians should cautiously integrate all the pieces of the hemodynamic puzzle to appropriately guide therapy.
CONFLICT OF INTEREST
The authors declare no conflict of interest.
AUTHOR CONTRIBUTIONS
SS: authored the initial draft and participated in patient care. AK: was the attending nephrologist on the case, performed and interpreted ultrasound scans, reviewed, and revised the manuscript for critical intellectual content.
INFORMED CONSENT
Informed consent has been obtained from the patient for the publication of this case report.
ACKNOWLEDGMENTS
Published with written consent of the patient.
Samant S, Koratala A. Point‐of‐care Doppler ultrasound in the management of hyponatremia: Another string to nephrologists' Bow. Clin Case Rep. 2021;9:e04687. 10.1002/ccr3.4687
Funding information
None
DATA AVAILABILITY STATEMENT
The data that support the findings of this study are available from the corresponding author, upon reasonable request.
REFERENCES
- 1.Stevenson LW, Perloff JK. The limited reliability of physical signs for estimating hemodynamics in chronic heart failure. JAMA. 1989;261(6):884‐888. [PubMed] [Google Scholar]
- 2.Testani JM, Brisco MA, Kociol RD, et al. Substantial Discrepancy Between Fluid and Weight Loss During Acute Decompensated Heart Failure Treatment. Am J Med. 2015;128(7):776‐83.e4. doi: 10.1016/j.amjmed.2014.12.020 [DOI] [PMC free article] [PubMed] [Google Scholar]
- 3.Koratala A, Kazory A. Natriuretic Peptides as Biomarkers for Congestive States: The Cardiorenal Divergence. Dis Markers. 2017;2017:1454986. doi: 10.1155/2017/1454986 [DOI] [PMC free article] [PubMed] [Google Scholar]
- 4.Chung HM, Kluge R, Schrier RW, Anderson RJ. Clinical assessment of extracellular fluid volume in hyponatremia. Am J Med. 1987;83(5):905‐908. doi: 10.1016/0002-9343(87)90649-8 [DOI] [PubMed] [Google Scholar]
- 5.Koratala A, Kazory A. Point of care ultrasonography for objective assessment of heart failure: integration of cardiac, vascular, and extravascular determinants of volume status. Cardiorenal Med. 2021;11(1):5‐17. doi: 10.1159/000510732 [DOI] [PubMed] [Google Scholar]
- 6.Rudski LG, Lai WW, Afilalo J, et al. Guidelines for the echocardiographic assessment of the right heart in adults: a report from the American Society of Echocardiography endorsed by the European Association of Echocardiography, a registered branch of the European Society of Cardiology, and the Canadian Society of Echocardiography. J Am Soc Echocardiograph. 2010;23(7):685‐713. doi: 10.1016/j.echo.2010.05.010 [DOI] [PubMed] [Google Scholar]
- 7.Koratala A. Utilizing point‐of‐care ultrasound in the cardiorenal clinic to enhance patient care. J Bras Nefrol. 2021;43(1):135‐136. doi: 10.1590/2175-8239-JBN-2020-0234 [DOI] [PMC free article] [PubMed] [Google Scholar]
- 8.Lautt WW, Greenway CV. Conceptual review of the hepatic vascular bed. Hepatology. 1987;7(5):952‐963. doi: 10.1002/hep.1840070527 [DOI] [PubMed] [Google Scholar]
- 9.Kennedy Hall M, Coffey EC, Herbst M, et al. The "5Es" of emergency physician‐performed focused cardiac ultrasound: a protocol for rapid identification of effusion, ejection, equality, exit, and entrance. Acad Emerg Med. 2015;22(5):583‐593. doi: 10.1111/acem.12652 [DOI] [PubMed] [Google Scholar]
- 10.Millington SJ. Ultrasound assessment of the inferior vena cava for fluid responsiveness: easy, fun, but unlikely to be helpful. Can J Anaesth. 2019;66(6):633‐638. doi: 10.1007/s12630-019-01357-0 [DOI] [PubMed] [Google Scholar]
- 11.Beaubien‐Souligny W, Rola P, Haycock K, et al. Quantifying systemic congestion with Point‐Of‐Care ultrasound: development of the venous excess ultrasound grading system. Ultrasound J. 2020;12(1):16. doi: 10.1186/s13089-020-00163-w [DOI] [PMC free article] [PubMed] [Google Scholar]
- 12.Koratala A, Sturgill D. Point‐of‐care venous Doppler ultrasound in the management of heart failure and hyponatremia. Clin Nephrol. 2021;96(1):63‐66. doi: 10.5414/CN110388 [DOI] [PubMed] [Google Scholar]
- 13.Argaiz ER, Rola P, Gamba G. Dynamic Changes in Portal Vein Flow during Decongestion in Patients with Heart Failure and Cardio‐Renal Syndrome: A POCUS Case Series. Cardiorenal Med. 2021;11(1):59‐66. doi: 10.1159/000511714 [DOI] [PubMed] [Google Scholar]
- 14.Singh S, Koratala A. Utility of Doppler ultrasound derived hepatic and portal venous waveforms in the management of heart failure exacerbation. Clin Case Rep. 2020;8(8):1489‐1493. doi: 10.1002/ccr3.2908 [DOI] [PMC free article] [PubMed] [Google Scholar]
- 15.Koratala A. Venous congestion assessment using point‐of‐care Doppler ultrasound: Welcome to the future of volume status assessment. Clin Case Rep. 2021;9(3):1805‐1807. doi: 10.1002/ccr3.3840 [DOI] [PMC free article] [PubMed] [Google Scholar]
- 16.Núñez‐Marín G, de la Espriella R, Santas E, et al. CA125 but not NT‐proBNP predicts the presence of a congestive intrarenal venous flow in patients with acute heart failure. Eur Heart J Acute Cardiovasc Care. 2021;10(5):475‐483. doi: 10.1093/ehjacc/zuab022 [DOI] [PMC free article] [PubMed] [Google Scholar]
- 17.Amiri FS. Serum tumor markers in chronic kidney disease: as clinical tool in diagnosis, treatment and prognosis of cancers. Ren Fail. 2016;38(4):530‐544. doi: 10.3109/0886022X.2016.1148523 [DOI] [PubMed] [Google Scholar]
Associated Data
This section collects any data citations, data availability statements, or supplementary materials included in this article.
Data Availability Statement
The data that support the findings of this study are available from the corresponding author, upon reasonable request.


