

Abstract
Background:
One mechanism that can explain the link between processed meat consumption and colorectal cancer (CRC) is the production of carcinogenic N-nitroso compounds (NOCs) in the gastrointestinal tract. Oral and gut microbes metabolize ingested proteins (a source of secondary and tertiary amines and amides) and can reduce nitrate to nitrite, generating potentially carcinogenic NOCs.
Objective:
We evaluated whether nitrate/nitrite in processed meat or water influences the fecal or salivary microbiota.
Design:
In this dietary intervention study, 63 volunteers consumed diets high in conventional processed meats for two weeks, switched to diets high in poultry for two weeks, and then consumed phytochemical-enriched conventional processed or low-nitrite processed meat diets for two weeks. During the intervention, they drank water with low nitrate concentrations and consumed a healthy diet with low antioxidants. Then the volunteers drank nitrate-enriched water for 1 week, in combination with one of the four different diets. We measured creatinine-adjusted urinary nitrate levels and characterized the oral and fecal microbiota using 16S rRNA amplicon sequencing.
Results:
Using linear mixed models, we found that, compared to baseline, urinary nitrate levels were reduced during the phytochemical-enriched low-nitrite meat diet (p-value=0.009) and modestly during the poultry diet (p-value=0.048). In contrast, urinary nitrate increased after 1-week of drinking nitrate-enriched water (p-value<10−5). Nitrate-enriched water, but not processed meats with or without phytochemicals, altered the saliva microbial population (p-value ≤0.001), and significantly increased abundance of 8 bacterial taxa, especially genus Neisseria and other nitrate-reducing taxa. Meats, phytochemicals and nitrate-enriched water had no significant effects on saliva alpha diversity or any diversity parameter measured for the fecal microbiota.
Conclusion:
These findings support the hypothesis that drinking high nitrate water increases oral nitrate-reducing bacteria, which likely results in increased NOC. However, meat nitrate/nitrite at the levels tested had no effect on either the gut or oral bacteria.
Keywords: processed meat, water nitrate, nitrite, oral and fecal microbiome, phytochemicals
Introduction
The World Cancer Research Fund [1, 2] reports convincing evidence that the consumption of red and particularly processed meat is associated with increased colorectal cancer (CRC) risk. Moreover, in 2015 the International Agency for Research on Cancer (IARC) classified processed meat as carcinogenic for humans (Group 1 carcinogen), based on sufficient evidence in humans that the consumption of processed meat causes CRC. [3] On the other hand, white meat and fish have been associated with reduced risk of mortality from cancer, heart disease, and other health outcomes. [4]
One mechanism that might explain the link between processed meat consumption and CRC is the production of carcinogenic N-nitroso compounds (NOCs) in the gastrointestinal tract. [5–8] Exposure to carcinogenic NOCs occurs via dietary intake of processed meat with pre-formed NOCs [9] or through the reaction of nitrosating agents formed from ingested nitrite and nitrate with amines and amides in meat proteins. Nitrate in drinking water also contributes to the formation of NOCs. Ingested nitrate is absorbed in the upper gastrointestinal tract, distributed via the blood circulation, and actively transported into saliva. Salivary levels may be up to 20-times higher than levels in plasma. [10–13] In the oral cavity, approximately 6–7% of nitrate is reduced to nitrite by nitrate-reducing activity of the oral microbiota. [12, 14] Nitrite is generated in the oral cavity and secreted nitrate is swallowed, thereby reentering the gastrointestinal tract. High consumption of red meat combined with drinking high-nitrate water is known to increase endogenous NOC formation in humans. [15–19] In 2006, the IARC concluded that “ingested nitrate or nitrite under conditions that result in endogenous nitrosation is probably carcinogenic to humans (2A).” [8]
New technologies have produced new processed meat products that contain low or no nitrite by introducing mixtures of biologically active compounds from herbs and natural plant extracts. These compounds include vitamin C, tocopherols, flavonoids, carotenoids, glycol alkaloids, and others that can be found in a wide range of vegetables and fruits. [20, 21] These compounds may also have anti-carcinogenic effects. [20] Many reduce the formation of NOCs in the human body when consumed simultaneously with meat products, and synergistic combinations may be more effective in promoting gut health than single compounds. [22, 23]
Because certain bacteria and other microbes can reduce ingested nitrate to nitrite, [8, 24, 25] the microbial population (microbiota) of the mouth and distal gut are central to the generation of NOCs. However, the relationship of the microbiota to intakes of NOC precursors including meats and nitrite and nitrate is poorly characterized. To address this knowledge gap, we characterized the oral and distal gut microbiota over the course of seven weeks among 63 volunteers sequentially assigned to first consume processed meat, then white meat as a washout period, then processed meat enriched with natural compounds, and then nitrate-enriched drinking water.
Subjects and methods
Recruitment of volunteers
Seventy-eight healthy volunteers were recruited using advertisements in local newspapers as well as other media. Volunteers met with the principal investigator (TMdK, KM), were provided an information brochure, and were given one week to decide whether to participate in the study. Volunteers were included in the study if they were between ages 18–70, in good health, with a body mass index (BMI) between 18–25 kg/m2. Exclusion criteria included high alcohol use during the six months before participation in this research (i.e., for males, more than 4 drinks on any single day or more than 14 drinks per week; for females, more than 3 drinks on any single day or more than 7 drinks per week), presence of any diseases related to the gastrointestinal tract, kidney, liver, heart or lungs, presence of symptoms related to diseases of the gastrointestinal tract (i.e., vomiting, diarrhoea or constipation, and altered stool, such as blood in stool), presence of diseases related to the endocrine or metabolic system, anaemia, HIV infection, or any type of hepatitis. Volunteers were also excluded if they used antibiotics or other prescription medication in the last 3 months, were current smokers, vegetarian, pregnant, or participating in other intervention studies during the intervention phase of this study. Participants of each sex were randomly assigned to one of the two experimental groups. Subjects were randomized based on the subject number given in sequence as determined by the date of signing the informed consent. The subjects were then divided based on study start rotating between group 1 and group 2. The participant flowchart is depicted in Supplementary Figure 1. Participants were blinded to which group they were assigned. The investigators conducting the intervention were not blinded; however the laboratory and statistical analyses were blinded.
The protocol of the study was evaluated and approved by the local Medical Ethics Review Committee of the Maastricht University Medical Centre (registration number: NL43956.068.13) and had Office of Human Subjects Research clearance from the National Institutes of Health (FWA number 00005152). The study is registered under ClinicalTrials.gov Protocol Record NCT04138654.
Study design and interventions
The dietary intervention study is outlined in Figure 1. For each study group, Group 1 (n=31) and Group 2 (n=32), there were 3 meat intervention phases lasting two weeks each and 1 nitrate-enriched water phase lasting 1 week. All volunteers underwent the first phase of meat intervention, which consisted of conventional processed meats (diet A) for 2 weeks and the second phase of meat intervention, which was a washout phase of poultry (i.e., chicken and turkey; diet B) for 2 weeks. For the third phase, Group 1 consumed conventional processed meat supplemented with natural phytochemical compounds (diet C) for 2 weeks, while Group 2 consumed low-nitrite processed meat supplemented with phytochemical compounds (diet D) for 2 weeks. During these 3 meat intervention phases, volunteers drank study-provided bottled water with low nitrate levels (1.9 mg/L nitrate). For the final nitrate-enriched water phase lasting 1 week, all volunteers drank nitrate-enriched water individually adjusted at the Acceptable Daily Intake level (3.7 mg/kg body weight), taking dietary nitrate intake into account. [26] During the nitrate-enriched water period,volunteers were randomly assigned conventional processed meat (diet A, n=15), poultry (diet B, n=16), conventional processed meats supplemented with natural phytochemical compounds (diet C, n=16), or low-nitrite processed meat supplemented with phytochemical compounds (diet D, n=16).
Figure 1:
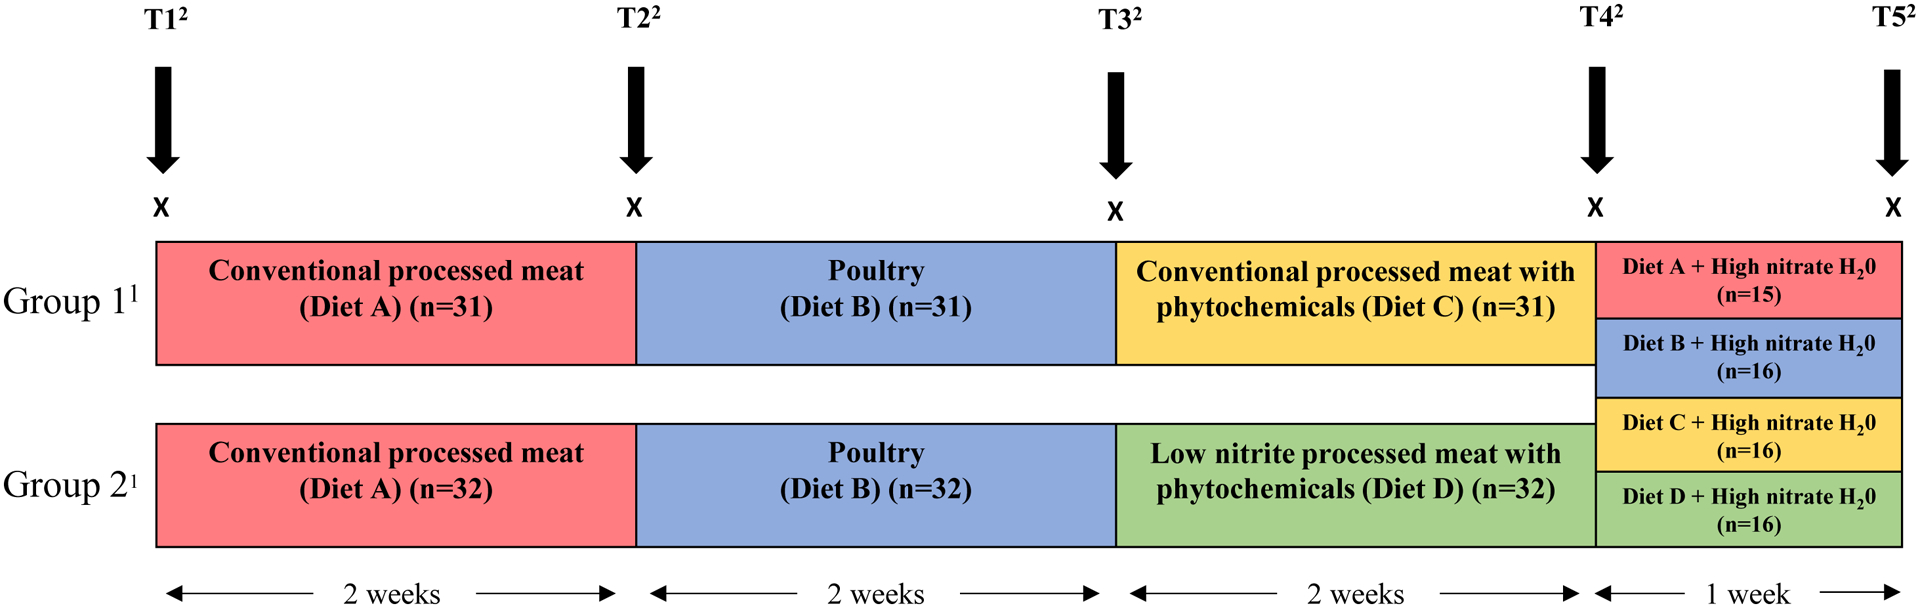
Study design and timeline of diet and nitrate water interventions (N=63). 1Group 1: Conventional processed meat with phytochemicals in the third dietary period (n=31); Group 2: Low nitrite processed meat with phytochemicals in the third dietary period (n=32). 2T1 = biological sample collected at baseline (N=62);T2 = biological sample collected from participants after two weeks of consuming conventional processed meats (Diet A, N=63); T3 = biological sample collected from participants after two weeks of consuming poultry (Diet B, N=63); T4 = biological sample collected from participants after two weeks of consuming either conventional processed meat with phytochemicals (Diet C, Group 1, n=31) or low nitrite processed meat with phytochemicals (Diet D, Group 2, n=32); T5 = biological sample collected from participants after one week of drinking water nitrate at acceptable daily intake (7mg/kg body weight) combined with one of the four prior diets.
The study intervention comprised a maximum of 300 grams of meat per day per 80kg body weight. [27, 28] This amount is within the range of daily meat consumption in the Netherlands (mean 150 grams per day in the Netherlands national food survey), and midway between the median daily intake and the 90th percentile in the Nederlandse Organisatie voor Toegepast Natuurwetenschappelijk Onderzoek (TNO; English: Netherlands Organization for Applied Scientific Research) food consumption survey from 1997–1998 for the age group of 20–55 years. Furthermore, this amount of meat was previously shown to induce significant effects on excreted levels of NOCs. [28, 29]
Individual food packages were compiled for each volunteer in consultation with a dietician. These food packages contained all daily nutritional requirements and could be consumed over the day. Antioxidants in fruits and vegetables were kept at a low, but healthy level. [28] The food package for the processed-meat phase contained a variety of commercially available cooked and dry-cured processed red meats containing conventional levels of nitrite. In phase 3, the meats for the phytochemical phase were enriched with proprietary natural compounds in combination with meat products like those in the first phase for Group 1 or with meat product with reduced levels of nitrite for Group 2. These natural-compound enriched meat products were tested to meet all quality standards for conventional meat products. The poultry washout phase packages contained unprocessed cooked chicken and turkey.
Specimen Collection
Urine, saliva, and feces were collected at five time points (T1-T5); at baseline (T1), at the end of each intervention phase, including conventional processed meat (Diet A; T2), poultry washout (Diet B); T3), conventional processed meat with phytochemicals (Diet C) or low nitrite processed meat with phytochemicals (Diet D; T4), and the high nitrate water plus Diet A, Diet B, Diet C, or Diet D (T5) (Figure 1). Urine was collected over 24 hours in a 2L bottle without preservative and kept at a cool, but not refrigerated, temperature for up to 1 day. Upon delivery to the study center, each bottle was weighed, mixed, and stored in 10 mL aliquots at −80°C. Feces were collected at home in a bag, from which approximately 1 gram was immediately scooped out by the participant and stored in a tube containing 1 mL of RNAlater to stabilize the genetic material. RNAlater-stabilized fecal specimens were stored in a cold spot until they were handed in to the study center and stored at −20°C. Saliva specimens were collected in the study center. Antiseptic mouthwashes were not used during the study as it may have an effect on oral bacteria. Volunteers were asked to collect this specimen in the morning before eating, drinking, or brushing their teeth by letting the saliva pool in the oral cavity and drooling into a vial. About 2–5 mL saliva was collected and promptly stored at −80°C.
Urine nitrate and creatinine measurement
Urine samples (0.25 mL) were analysed for nitrate using ion chromatography with tandem mass spectrometry (IC-MS/MS) by the Division of Laboratory Sciences at the National Center for Environmental Health, Centers for Disease Control and Prevention (CDC). [30] Urinary creatinine was measured using an automatic colormetric method on a Beckman Synchron AS/ASTRA clinical analyser (Beckman Instruments Inc., Brea, CA). [31] Nitrate concentrations were divided by creatinine concentrations to normalize analyte concentration and expressed as mg nitrate per g creatinine). Each batch of unknown samples contained at least two pools of known quality control samples and blanks to assess method accuracy, precision and contaminations. All batches met the CDC quality control standards. [32]
DNA extraction and sequencing
Saliva and fecal specimens were thawed at 4°C and kept on ice during plating. Both saliva and fecal specimens were sampled using a swab (Puritan Cotton Tipped Applicators – Puritan Medical Products), which was then used for the DNA extraction.
DNA extraction, polymerase chain reaction (PCR) amplification and amplicon preparation for sequencing were performed as described in the Earth Microbiome Project web page http://press.igsb.anl.gov/earthmicrobiome/protocols-and-standards/dna-extraction-protocol/ at the Knight Laboratory, University of California, San Diego. DNA was extracted using the MO-BIO PowerMag Soil DNA Isolation Kit with beadbeating. Polymerase chain reaction (PCR) amplification was performed using the universal bacterial primer set 515F/806R for the V4 region of the 16S rRNA gene. [33, 34] Negative controls included no-template controls for DNA extraction and PCR amplification. Finally, all barcoded amplicons were pooled in equal concentrations for sequencing on the Illumina MiSeq sequencing platform.
Bioinformatics
Reads were demultiplexed and quality filtered using QIIME 1.9.1. The DADA2 pipeline [35] was used to generate a sequence feature table and a phylogenetic tree based on paired-end sequences. Chimeric sequences were removed. Non-bacteria sequence features were filtered from the sequence feature table. The sequences were aligned with the SILVA v123 database to get taxonomy information. For fecal samples, 1969 sequence features were identified for 378 samples. For saliva samples, 1433 sequence features were identified for 360 samples. After a sequence variant table with taxonomy information was generated, a relative abundance table was created for each subject without rarefaction. For both fecal and saliva samples, richness and alpha diversity metrics (observed sequence variants, Shannon index, and Phylogenetic Diversity (PD) whole tree) were calculated based on rarefaction values from 2,000 to 10,000 reads. Beta diversity metrics (Bray Curtis, unweighted UniFrac, weighted UniFrac, and Jaccard distance) and principal coordinates analyses based on these metrics were generated based on rarefaction to 10,000 reads.
Statistics
We evaluated linear associations of each intervention phase with saliva and fecal microbial alpha diversity metrics (observed sequence variants, Shannon index, and PD whole tree), adjusting for sex, BMI (kg/m2, continuous), and age (years, continuous). We also estimated the associations of the covariates with observed sequence variants and Shannon index diversity. We evaluated the differences in microbiome beta diversity between different study time points (T1-T5) using a newly developed approach, the Generalized Linear Mixed Model - Microbiome Regression-based Kernel Association Test (GLMM-MiRKAT), [36] which explicitly takes into account samples from repeated measures from the same individual and captures within-individual correlations via a random effects model.
Individual taxon analysis was conducted at the class and the genus level. Taxa that were not detected in more than 70% of samples were removed from the analysis (results were similar when removing a lower percentage of taxa). We conducted additional analyses for the fecal microbiota assessing all taxa previously associated with CRC, including Fusobacterium, Porphyromonas, Parvimonas, Peptostreptococcus, Gemella, Prevotella, Solobacterium, Dialister, and Family Clostridiales [Wirbel, 2019 #49]. For each taxon, a paired Wilcoxon rank sum test was used to compare the relative abundance between different time points. Taxa were considered to be significantly differentially abundant at false discovery rate (FDR) < 0.05. For regression models involving the relative abundances of taxa, a log (base 10) transformation of the relative abundances was applied. To remove the zero counts, a pseudo-count of 1 was added to all the taxa. For a sensitivity analysis, we applied the analysis of composition of microbiomes (ANCOM) method, based on compositional log-ratios, for comparison.
We evaluated multivariable linear associations of each intervention phase with creatinine-adjusted urinary nitrate concentrations using a linear mixed model with subject-specific random effects to capture the within-subject correlation. We further used this approach to evaluate the association between microbiome beta diversity and creatinine-adjusted urine nitrate level. All analyses were conducted using R, version 3.6.0.
Results
Of the 78 participants recruited, 63 (81%) completed the study. Sixty participants had all five timepoints, one participant had four timepoints, one had three timepoints, and one had two timepoints. Most dropouts were due mostly to the common cold and not likely to be related to the intervention. Male and female participants were equally distributed between Group 1 (Diet C: conventional nitrite processed meat with phytochemicals) and Group 2 (Diet D: lower nitrite-processed meat with phytochemicals)(Table 1). Age, BMI, average pre-study meat consumption, and physical activity were not significantly different between the two groups (Table 1).
Table 1.
Study participant characteristics1 by dietary intervention group (N=63)
| Total (N=63) | Group 12 (n=31) | Group 23 (n=32) | |
|---|---|---|---|
| Male (%) | 46.0 | 41.9 | 50.0 |
| Age (years) | 25.4 ± 8.5 | 25.9 ± 9.3 | 24.6 ± 7.6 |
| Body mass index (kg/m2) | 22.3 ± 2.1 | 22.0 ± 2.1 | 22.6 ± 2.1 |
| Meat consumption before intervention (g/day) | 254 ± 38.0 | 248 ± 38 | 259 ± 37 |
| Physical activity (hours/week) | 6.5 ± 3.8 | 7.1 ± 4.2 | 5.9 ± 3.3 |
All values are mean ± standard deviation or percentages
Group 1 diets included the conventional processed meat with phytochemicals intervention
Group 2 diets included the low nitrite processed meat with phytochemicals intervention
Saliva microbiome with each intervention
After taking out the quality control samples and samples with poor amplification we had microbiome profiling of the 309 saliva specimens (six samples missing spanning three participants, otherwise 5 per participant) revealed taxa in 16 phyla, 31 classes, and 196 genera. As shown in Table 2, compared to baseline values of observed sequence variants and Shannon index, nitrate-enriched water significantly reduced saliva richness (β=−3.90; P=0.028), whereas Shannon index was marginally increased with conventional processed meat (β=0.10; P=0.068) and particularly with phytochemical-enriched conventional processed meat (β=0.14; P=0.037). Observed sequence variants and Shannon index had discrepant associations with age, sex, and two of the intervention periods. No consistent, significant associations were found with PD whole tree indices (data not presented).
Table 2.
Beta coefficients and 95% confidence intervals for associations of dietary interventions and participant chracteristics with saliva microbiota alpha diversity metrics (N=63)
| Observed sequence variants | Shannon index | |||
|---|---|---|---|---|
| Intervention period vs. baseline | β (95% CI)1 | P-value | β (95% CI)1 | P-value |
| Conventional processed meat | 3.62 (−0.43, 7.67) | 0.079 | 0.10 (−0.01, 0.20) | 0.068 |
| Poultry | 0.61 (−3.43, 4.64) | 0.767 | 0.03 (−0.08, 0.13) | 0.586 |
| Conventional processed meat + phytochemicals | 2.35 (−2.65, 7.35) | 0.355 | 0.14 (0.01, 0.27) | 0.037 |
| Low nitrite processed meat + phytochemicals | 0.21 (−4.78, 5.19) | 0.935 | 0.01 (−0.12, 0.14) | 0.842 |
| High nitrate water | −3.90 (−7.38, −0.43) | 0.028 | 0.02 (−0.07, 0.11) | 0.603 |
| Participant characteristics | ||||
| Sex | −0.91 (−9.95, 8.14) | 0.842 | 0.21 (0.02, 0.41) | 0.031 |
| Body mass index (kg/m2) | −0.39 (−2.59, 1.82) | 0.725 | −0.02 (−0.07, 0.03) | 0.418 |
| Age (years) | 0.72 (0.21, 1.24) | 0.007 | 0.01 (−0.003, 0.02) | 0.165 |
Estimated using a linear mixed model with subject specific random effect adjusted for age (years, continuous), sex, and body mass index (kg/m2, continuous)
GLMM-MiRKAT [37] was used to investigate associations of saliva microbiome beta diversity with the intervention, adjusted for age, BMI and sex. A significant shift in saliva microbial community composition was observed between the conclusion of the nitrate-enriched water phase (T5) and all the previous time points (T1-T4) (omnibus p< 0.05, Table 3 and Figure 2). For example, comparing the nitrate-enriched water phase (T5) to baseline (T1), we observed a significant shift in saliva microbial community using Bray-Curtis (p-value<0.001), weighted UniFrac (p-value<0.01), unweighted UniFrac (p-value<0.001), and Jaccard distances (p-value<0.001), (omnibus p-value<0.001 for all four distances). Compared to T1, there was a significant shift in beta diversity at T2 (omnibus p-value=0.02; Table 3) and T3 (omnibus p-value=0.01). There was no significant change between other time points.
Table 3.
Pairwise comparisons of saliva and fecal microbial community beta diversities (Bray-Curtis, unweighted Unifrac, weighted Unifrac and Jaccard distances)2 (N=63)
| Saliva microbiome | Fecal microbiome | |||||||||
|---|---|---|---|---|---|---|---|---|---|---|
| Pairwise Comparisons1 | Bray-Curtis | Unweighted UniFrac | Weighted Unifrac | Jaccard distances | Omnibus test | Bray-Curtis | Unweighted UniFrac | Weighted Unifrac | Jaccard distances | Omnibus test |
| T2 vs. T1 | 0.005 | 0.734 | 0.115 | 0.135 | 0.017 | 0.588 | 0.264 | 0.574 | 0.142 | 0.347 |
| T3 vs. T1 | 0.016 | 0.286 | 0.014 | 0.002 | 0.007 | 0.411 | 0.661 | 0.513 | 0.501 | 0.777 |
| T3 vs. T2 | 0.806 | 0.935 | 0.594 | 0.702 | 0.927 | 0.164 | 0.044 | 0.230 | 0.039 | 0.119 |
| T4 vs. T1 | 0.123 | 0.990 | 0.271 | 0.076 | 0.227 | 0.831 | 0.826 | 0.704 | 0.308 | 0.665 |
| T4 vs. T2 | 0.801 | 0.748 | 0.896 | 0.190 | 0.477 | 0.863 | 0.154 | 0.806 | 0.522 | 0.377 |
| T4 vs. T3 | 0.557 | 0.586 | 0.656 | 0.930 | 0.910 | 0.843 | 0.731 | 0.344 | 0.848 | 0.700 |
| T5 vs. T1 | <0.001 | 0.008 | <0.001 | <0.001 | <0.001 | 0.508 | 0.491 | 0.285 | 0.048 | 0.136 |
| T5 vs. T2 | 0.002 | 0.225 | 0.008 | 0.228 | 0.006 | 0.099 | 0.240 | 0.057 | 0.105 | 0.180 |
| T5 vs. T3 | 0.005 | 0.084 | 0.033 | 0.121 | 0.018 | 0.693 | 0.902 | 0.453 | 0.263 | 0.586 |
| T5 vs. T4 | 0.001 | 0.042 | 0.022 | 0.016 | 0.002 | 0.180 | 0.580 | 0.045 | 0.098 | 0.145 |
Pairwise comparisons of interventions (T1=baseline; T2=end of Diet A phase, conventional processed meat for Groups 1 and 2; T3=end of Diet B phase, poultry wash out for Groups 1 and 2; T4=end of Diets C or D phase, conventional processed meats with phytochemicals or low nitrite processed meat with phytochemicals, respectively; T5=end of high nitrate-enriched water + either Diet A, B, C, or D phase
P-values of pairwise comparisons estimated using a Generalized Linear Mixed Model - Microbiome Regression-based Kernel Association Test (GLMM-MiRKAT) adjusted for age (years, continuous), sex, and body mass index (kg/m2, continuous). All statistical tests were two-sided.
Figure 2.

Plots of the first and second principal coordinates (PCO1, PCO2) of A) Bray Curtis, B) U.UniFrac (unweighted Unifrac), C) W.Unifrac (weighted Unifrac), and D) Jaccard distance estimates of microbiome beta diversity (community composition) in saliva at T1 (baseline, open circles) and end of the last intervention (high nitrate water, black solid triangles) (N=63). P-values, for difference in beta diversity (composition) from baseline to end of interventions, are from GLMM-MiRKAT models adjusted for sex, body mass index (kg/m2, continuous), and age (years, continuous). P-values were considered significant at <0.05.
Nine of 12 taxa in saliva changed significantly (FDR < 0.05) from T1 to T5, as shown in Figure 3. Relative abundance of three Betaproteobacteria genera increased, especially taxa in the genus Neisseria (+45%) as well as Kingella (+23% and Lautropia (+19%). Five other taxa increased by 16% or more, and four taxa decreased by 8–12%. Using multivariate ANCOM to account for the compositional nature of the relative abundance data, we found similar statistically significant increases in Neisseria, Capnocytophaga, Alloprevotella, and Haemophilus and decreases in Streptococcus from T1 to T5 (Supplementary Figure 2, available online). Comparisons in the taxa between different intervention periods are shown in Supplementary Table 1, available online.
Figure 3.

Bar plot of the 12 genera with significantly (defined by false discovery rate (FDR) < 0.1) changed relative abundance (RA) from baseline to end of the trial (T1 to T5, respectively). The y-axis is calculated as the average of the . Positive values indicate an increase in relative abundance at T5, (i.e., at the end of the nitrate-enriched water period), compared to T1(baseline) (N=63). Eight taxa increased in relative abundance, especially in the Betaproteobacteria Neisseria genus; four taxa decreased in relative abundance. Taxa were considered to be significantly differentially abundant at false discovery rate (FDR) < 0.05
Fecal microbiome with each intervention
After taking out the quality control samples and samples with poor amplification we had microbiome profiling of the 309 fecal specimens (5 per participant) revealed taxa in 14 phyla, 30 classes, and 114 genera. There were no significant differences in fecal microbiome alpha diversity with any of the interventions. Moreover, unlike alterations in the saliva microbiome composition with nitrate-enriched water, no comparable alterations in composition (beta diversity) with the dietary or nitrate interventions were found in the fecal microbiome (Table 3). Furthermore, there were no changes in taxa abundance across time-point comparisons (Supplementary Table 2, available online).
Urine nitrate with each intervention
A multivariable linear mixed model was used to test for effects of the interventions on creatinine-adjusted urine nitrate levels compared to T1. As shown in Table 4 (and graphically in Supplementary Figure 3, available online), creatinine-adjusted urine nitrate levels were markedly increased with the nitrate-enriched water (β=603.74, p-value<0.001). Compared to baseline, creatinine-adjusted urine nitrate levels were substantially reduced by low-nitrite, phytochemical-enriched processed meat (β= −216.82, p-value=0.01), modestly reduced by the poultry diet (β=−132.83, p-value =0.05), but not significantly reduced by conventional processed meat or by conventional meat with phytochemical enrichment. Sex, age, and BMI were not significantly associated with creatine-adjusted urine nitrate levels.
Table 4.
Beta coefficients and 95% confidence intervals for effects of each intervention phase on creatinine-adjusted urine nitrate levels (N=63)
| Creatinine-adjusted urine nitrate levels | ||
|---|---|---|
| Intervention period vs. baseline | β (95% CI)1 | P-value |
| Conventional processed meat | −81.66 (−212.74, 49.41) | 0.22 |
| Poultry | −132.83 (−264.74, −0.93) | 0.05 |
| Conventional processed meat + phytochemicals | −94.56 (−255.18, 66.05) | 0.25 |
| Low nitrite processed meat + phytochemicals | −216.82 (−378.27, −55.36) | 0.01 |
| High nitrate water | 603.74 (490.11, 717.36) | <0.01 |
| Participants Charactertistic | ||
| Sex | −36.09 (−218.85, 146.68) | 0.69 |
| Body mass index (kg/m2) | −43.78 (−88.59, 1.03) | 0.06 |
| Age (years) | −1.77 (−12.29, 8.76) | 0.74 |
Estimated using a linear mixed model with subject specific random effect adjusted for age (years, continuous), sex, and body mass index (kg/m2, continuous)
Urine nitrate levels with microbiome composition and taxonomy
GLMM-MiRKAT [37] was used to evaluate associations of creatinine-adjusted urinary nitrate concentrations with beta diversity of the salivary and fecal microbiome. Adjusted for intervention period, sex, BMI, and age, salivary microbiome composition was significantly associated with creatinine-adjusted urine nitrate level [weighted UniFrac (p-value = 0.001), Bray-Curtis distances (p-value = 0.004)]. However, using unweighted UniFrac distance and Jaccard, the association was not significant (p-value = 0.37 and p-value = 0.05, respectively), suggesting that highly abundant taxa were probably driving the association. The omnibus test considering all the three distances showed a significant association (p-value< 0.001). There was no significant association between the fecal microbiome and creatinine-adjusted urine nitrate levels using any of the distance metrics.
Linear mixed models were implemented to evaluate associations of urine nitrate levels with individual taxa (after log transformation), adjusted for intervention period, sex, BMI, and age (Supplementary Table 3, available online). Urinary nitrate levels were significantly associated with four saliva genera. Of the significant taxa, there was a positive association with three genera, including two from the class Betaproteobacteria (Neisseria, FDR=0.007; and Comamonas, FDR= 0.03), and one from class Flavobacteria (Capnocytophaga, FDR= 0.005). Veillonella (FDR=0.005) was negatively associated with creatinine-adjusted urine nitrate levels. After FDR correction, none of the fecal microbiome taxa (genus or class level) were significantly associated with urine nitrate level (data not shown), including those previously associated with CRC.
Discussion
In this 7-week dietary intervention trial we found that drinking nitrate-enriched water resulted in significantly increased nitrate levels in urine. Compared to baseline, urine nitrate levels decreased after switching to a low nitrate diet that included low nitrate water, especially after consuming phytochemical-enriched low nitrite processed meat for 2 weeks. Of most interest, drinking nitrate-enriched water significantly altered the microbial population of the saliva, with 45% increased relative abundance of the gram-negative diplococcus, Neisseria (subphylum Betaproteobacteria). Neisseria mucosa, a highly prevalent species in the human mouth, effectively reduces nitrate to nitrite. [38] This increase was not observed with any of the processed meat periods. Growth of these organisms with supplemental nitrate is expected, as nitrate-reducing bacteria depend upon nitrate as an essential source of nitrogen for growth, metabolic energy, and redox balancing. [39]
The role of the oral microbiome in the nitrate-nitrite-nitric oxide pathway is an important focus of research because ingested nitrite reacts in the acidic stomach to form nitrosating agents and nitric oxide (NO). NO reduces hypertension, whereas, nitrosating agents can react with dietary or pharmaceutical sources of amines and amides to form carcinogenic NOC. Consensus is lacking on the risks and benefits of drinking water and dietary sources of nitrate and nitrite for human health. [16, 40] However, relatively small differences may have effects at the population level especially when nitrate is consumed through drinking water without concomitant intake of antioxidants that inhibit endogenous nitrosation. [8, 16] Willis et al. evaluated the oral microbiome of 1500 adolescents and teachers in large areas of Spain, observing that relative abundances of many oral bacteria correlated significantly with metrics of locally consumed tap water. [41] When our 63 participants were switched to high nitrate water, there was a notable shift in oral microbial community.
More than a dozen common, nitrate-reducing oral microbes have been reported. [42, 43] Nitrate reduction is a conventional biochemical assay used to distinguish the pathogens N. meningitides and N. gonorrhoeae (https://www.cdc.gov/std/gonorrhea/lab/biochemical.htm). For example, Vanhatalo and colleagues [44] tested the effect of 10 days of oral nitrate versus placebo on the oral microbiome in normo-tensive young adults and septuagenarians. Oral nitrate did not affect blood pressure in the young adults, but modestly decreased it in the septuagenarians. Without adjusting for multiple comparisons, they found that nitrate supplementation for 10 days increased the relative abundance of Neisseria by 3.5-fold. Nitrate supplementation also increased Rothia 1.3-fold and decreased Prevotella (0.60-fold) and Veillonella (0.65-fold). Our results corroborate theirs with respect to both increased Neisseria and decreased Veillonella. Vanhatalo, et al postulated that Veillonella’s ability to reduce nitrate but its paradoxical decrease with nitrate supplementation might be attributable to markedly increased pH with their supplement, beetroot juice. [44] Further, a previous study conducted in the American Gut Project, found that relative abundance of nitrate-reducing Streptoccoccus was associated with migraines, a nitrate-induced condition. No other taxa they identified in the study of migraines were statistically significantly different by the timepoints in our study. [45]
The strengths of this study were the carefully controlled diets based on postulated, biologically and potentially clinically important effects of processed meat on nitrate, nitrite, and resulting NOC levels. We had sufficient sample size, retention over the 7 weeks, and adherence to the diets to detect the postulated increase in urine nitrate levels with the water nitrate intervention. Although not noted by Vanhatalo et al.,[44] we observed that nitrate-enriched water significantly reduced saliva richness (probably reflecting markedly increased abundance of Neisseria discussed above). We also found that Shannon index was marginally increased with conventional processed meat and particularly with phytochemical-enriched conventional processed meat. The diets and nitrate-enriched water had no demonstrable effect on the fecal microbiome. Importantly, for longitudinal comparisons of beta diversity, we developed and herein applied a new approach called GLMM-MiRKAT [36, 37] to account for repeated, within-subject measures, thereby avoiding seriously inflated type I error that can occur due to within-subject correlation.
Limitations were that the sample size may have been insufficient or that a two-week intervention period may have been too brief to detect small effects on the microbiota. This limitation is particularly relevant to the distal gut, as our study’s diets and nitrate-enriched water had no demonstrable effect on the fecal microbiome. In previous reports, fecal microbiota community composition differed with long-term carbohydrate-predominant versus animal fat/protein-predominant diet. [46] However, as in our study, these fecal microbiota community groups were not altered with processed meat or white meat interventions. Of note, we only changed the type of meat (rather than the amount) and kept other foods and protein content constant. It is plausible that more drastic changes in the diet may be necessary to induce changes in the fecal microbiome. For example, in the study by David et al, in which they used a crossover feeding study design to compare fecal microbial changes during a soley animal-based vs. a solely vegetarian-based diet, they observed strong differences in multiple taxa in the fecal microbiome. [47]
This study provides basic insights on the effects of diet, especially drinking water, on the microbiota and the nitrate-nitrite-nitric oxide pathway. However, much more research in this domain, including the consequent effects on health, is clearly needed. Careful attention and adherence to best practices will be critically required for all studies of dietary effects on the microbiome and health. [48]
Supplementary Material
Supplementary Figure 1. Participants were recruited, selected, and divided into intervention groups as depicted.
Supplementary Figure 2. Saliva genus with significantly changed relative abundance from T1 to T5. Estimated using the analysis of composition of microbiomes (ANCOM) method to account for the compositional nature of the relative abundance data (N=63). Taxa were considered significantly differentially abundant at false discovery rate (FDR) < 0.05.
Supplementary Figure 3. Differences in mean and standard errors, estimated using linear mixed models, of creatine-adjusted urine nitrate levels at each time point (T2-T5) compared to baseline (T1), adjusted for sex, body mass index (kilograms/meter2, continuous), and age (years, continuous). P-values <0.05 were considered significant. All statistical tests were two-sided.
Highlights.
Evaluated if meat nitrate/nitrite or water nitrate influence gut or oral microbiota
Volunteers ate and drank varying levels of nitrate/nitrite in meat and water
Meat nitrate/nitrite had no effect on either the gut or oral bacteria
High Nitrate water increased oral genus Neisseria and other nitrate-reducing taxa
High nitrate water raises oral nitrate-reducing bacteria increasing carcinogenic NOCs
Acknowledgment:
The authors gratefully acknowledge the work of the consortium members involved in the study. The authors also acknowledge the work of Drs. Maria Morel-Espinosa and Benjamin Blount in the Division of Laboratory Sciences at the National Center for Environmental Health, Centers for Disease Control and Prevention for the urinary nitrate analyses.
Sources of Support:
This work was supported by the Intramural Research Program of the National Cancer Institute at the National Institutes of Health. This research is based on data and samples of the PHYTOME project, financed under the 7th Framework programme of the European Union (EU-FP7 grant agreement no. 315683), investigating the replacement of nitrite in processed meat products by natural compounds.
Abbreviations:
- BC
Bray Curtis
- CRC
colorectal cancer
- CI
Confidence interval
- FDR
false discovery rate
- IARC
International Agency for Research on Cancer
- IC-MS/MS
ion chromatography with tandem mass spectrometry
- kg/m2
kilograms/meter2
- NO
nitric oxide
- NOC
N-nitroso compounds
- OTU
Operational Taxonomic Unit
- PD
Phylogenetic diversity
- PCO
principal coordinate
- PCR
polymerase chain reaction
Footnotes
Conflicts of interest: The authors have no conflicts of interest to declare.
Data availability: Please visit the following link: https://www.ncbi.nlm.nih.gov/bioproject/PRJNA625963/
ClinicalTrials.gov Identifier: NCT04138654
References
- 1.Food, Nutrition, Physical Activity, and the Prevention of Cancer: a Global Perspective 2007. 2007, World Cancer Research Fund / American Institute for Cancer Research: Washington, DC. [Google Scholar]
- 2.Continuous Update Project Expert Report 2018, in Diet, Nutrition, physical activity and colorectal cancer. 2018, World Cancer Research Fund/American Institute for Cancer Research. [Google Scholar]
- 3.Bouvard V, et al. , Carcinogenicity of consumption of red and processed meat. Lancet Oncol, 2015. 16(16): p. 1599–600. [DOI] [PubMed] [Google Scholar]
- 4.Etemadi A, et al. , Mortality from different causes associated with meat, heme iron, nitrates, and nitrites in the NIH-AARP Diet and Health Study: population based cohort study. BMJ, 2017. 357: p. j1957. [DOI] [PMC free article] [PubMed] [Google Scholar]
- 5.Bingham SA, et al. , Does increased endogenous formation of N-nitroso compounds in the human colon explain the association between red meat and colon cancer? Carcinogenesis, 1996. 17(3): p. 515–23. [DOI] [PubMed] [Google Scholar]
- 6.Cross AJ and Sinha R, Meat-related mutagens/carcinogens in the etiology of colorectal cancer. Environ Mol Mutagen, 2004. 44(1): p. 44–55. [DOI] [PubMed] [Google Scholar]
- 7.Wakabayashi K, et al. , Food-derived mutagens and carcinogens. Cancer Res, 1992. 52(7 Suppl): p. 2092s–2098s. [PubMed] [Google Scholar]
- 8.Ingested Nitrates and Nitrites, and Cyanobacterial Peptide Toxins, in IARC Monograph Working Group on the Evaluation of the Carcinogenic Risk to Humans. 2010, Internation Agency for Research on Cancer, World Health Organization: Lyon, France. [Google Scholar]
- 9.Ozel MZ, et al. , Determination of volatile nitrosamines in various meat products using comprehensive gas chromatography-nitrogen chemiluminescence detection. Food Chem Toxicol, 2010. 48(11): p. 3268–73. [DOI] [PubMed] [Google Scholar]
- 10.Leach SA, Thompson M, and Hill M, Bacterially catalysed N-nitrosation reactions and their relative importance in the human stomach. Carcinogenesis, 1987. 8(12): p. 1907–12. [DOI] [PubMed] [Google Scholar]
- 11.Tricker AR, Kalble T, and Preussmann R, Increased urinary nitrosamine excretion in patients with urinary diversions. Carcinogenesis, 1989. 10(12): p. 2379–82. [DOI] [PubMed] [Google Scholar]
- 12.Spiegelhalder B, Eisenbrand G, and Preussmann R, Influence of dietary nitrate on nitrite content of human saliva: possible relevance to in vivo formation of N-nitroso compounds. Food Cosmet Toxicol, 1976. 14(6): p. 545–8. [DOI] [PubMed] [Google Scholar]
- 13.Lv J, et al. , Effects of intensive blood pressure lowering on cardiovascular and renal outcomes: a systematic review and meta-analysis. PLoS Med, 2012. 9(8): p. e1001293. [DOI] [PMC free article] [PubMed] [Google Scholar]
- 14.Eisenbrand G, Spiegelhalder B, and Preussmann R, Nitrate and nitrite in saliva. Oncology, 1980. 37(4): p. 227–31. [DOI] [PubMed] [Google Scholar]
- 15.Ward MH, et al. , Adenocarcinoma of the stomach and esophagus and drinking water and dietary sources of nitrate and nitrite. Int J Occup Environ Health, 2008. 14(3): p. 193–7. [DOI] [PMC free article] [PubMed] [Google Scholar]
- 16.Ward MH, et al. , Drinking Water Nitrate and Human Health: An Updated Review. Int J Environ Res Public Health, 2018. 15(7). [DOI] [PMC free article] [PubMed] [Google Scholar]
- 17.Rowland IR, et al. , Endogenous N-nitrosation in man assessed by measurement of apparent total N-nitroso compounds in faeces. Carcinogenesis, 1991. 12(8): p. 1395–401. [DOI] [PubMed] [Google Scholar]
- 18.Vermeer IT, et al. , Volatile N-nitrosamine formation after intake of nitrate at the ADI level in combination with an amine-rich diet. Environ Health Perspect, 1998. 106(8): p. 459–63. [DOI] [PMC free article] [PubMed] [Google Scholar]
- 19.Kobayashi J, Effect of diet and gut environment on the gastrointestinal formation of N-nitroso compounds: A review. Nitric Oxide, 2018. 73: p. 66–73. [DOI] [PubMed] [Google Scholar]
- 20.Lee SY MB, Pollard S, Youdim KA, Pannala AS, Kuhnle GG, Debnam ES, Rice-Evans C, Spencer JP, The reaction of flavanols with nitrous acid protects against N-nitrosamine formation and leads to the formation of nitroso derivatives which inhibit cancer cell growth. Free Radic Biol Med, 200640(2): p. 323–34. [DOI] [PubMed] [Google Scholar]
- 21.Pollard SE KG, Vauzour D, Vafeiadou K, Tzounis X, Whiteman M, Rice-Evans C, Spencer JP, The reaction of flavonoid metabolites with peroxynitrite. Biochem Biophys Res Commun, 2006350(4): p. 960–8. [DOI] [PubMed] [Google Scholar]
- 22.de Kok TM, van Breda SG, and Manson MM, Mechanisms of combined action of different chemopreventive dietary compounds: a review. Eur J Nutr 2008. 47: p. Suppl 2:51–59. [DOI] [PubMed] [Google Scholar]
- 23.van Breda SG and de Kok TM, Smart Combinations of Bioactive Compounds in Fruits and Vegetables May Guide New Strategies for Personalized Prevention of Chronic Diseases. Mol Nutr Food Res 2017. [DOI] [PubMed] [Google Scholar]
- 24.Qu XM, et al. , From Nitrate to Nitric Oxide: The Role of Salivary Glands and Oral Bacteria. J Dent Res, 2016. 95(13): p. 1452–1456. [DOI] [PubMed] [Google Scholar]
- 25.Hezel MP and Weitzberg E, The oral microbiome and nitric oxide homoeostasis. Oral Dis, 2015. 21(1): p. 7–16. [DOI] [PubMed] [Google Scholar]
- 26.EFSA Panel on Food Additives and Nutrient Sources added to Food (ANS), et al. , Scientific Opinion on the re-evaluation of sodium nitrate (E 251) and potassium nitrate (E 252) as food additives. EFSA Journal, 2017. 15(6): p. 4787. [DOI] [PMC free article] [PubMed] [Google Scholar]
- 27.Hebels DG, et al. , Red meat intake-induced increases in fecal water genotoxicity correlate with pro-carcinogenic gene expression changes in the human colon. Food Chem Toxicol, 2012. 50(2): p. 95–103. [DOI] [PubMed] [Google Scholar]
- 28.Hughes R, et al. , Dose-dependent effect of dietary meat on endogenous colonic N-nitrosation. Carcinogenesis, 2001. 22(1): p. 199–202. [DOI] [PubMed] [Google Scholar]
- 29.Lunn JC, et al. , The effect of haem in red and processed meat on the endogenous formation of N-nitroso compounds in the upper gastrointestinal tract. Carcinogenesis, 2007. 28(3): p. 685–90. [DOI] [PubMed] [Google Scholar]
- 30.Valentin-Blasini L, Blount BC, and Delinsky A, Quantification of iodide and sodium-iodide symporter inhibitors in human urine using ion chromatography tandem mass spectrometry. J Chromatogr A, 2007. 1155(1): p. 40–6. [DOI] [PubMed] [Google Scholar]
- 31.Barr DB, et al. , Urinary creatinine concentrations in the U.S. population: implications for urinary biologic monitoring measurements. Environ Health Perspect, 2005. 113(2): p. 192–200. [DOI] [PMC free article] [PubMed] [Google Scholar]
- 32.Caudill SP, Schleicher RL, and Pirkle JL, Multi-rule quality control for the age-related eye disease study. Stat Med, 2008. 27(20): p. 4094–106. [DOI] [PubMed] [Google Scholar]
- 33.Caporaso JG, et al. , Ultra-high-throughput microbial community analysis on the Illumina HiSeq and MiSeq platforms. ISME J, 2012. 6(8): p. 1621–4. [DOI] [PMC free article] [PubMed] [Google Scholar]
- 34.Walters W, et al. , Improved Bacterial 16S rRNA Gene (V4 and V4–5) and Fungal Internal Transcribed Spacer Marker Gene Primers for Microbial Community Surveys. mSystems, 2016. 1(1). [DOI] [PMC free article] [PubMed] [Google Scholar]
- 35.Callahan BJ, et al. , DADA2: High-resolution sample inference from Illumina amplicon data. Nat Methods, 2016. 13(7): p. 581–3. [DOI] [PMC free article] [PubMed] [Google Scholar]
- 36.Koh H, et al. , A Distance-Based Kernel Association Test Based on the Generalized Linear Mixed Model for Correlated Microbiome Studies. Front Genet, 2019. 10: p. 458. [DOI] [PMC free article] [PubMed] [Google Scholar]
- 37.Zhan X, et al. , A small-sample kernel association test for correlated data with application to microbiome association studies. Genet Epidemiol, 2018. 42(8): p. 772–782. [DOI] [PubMed] [Google Scholar]
- 38.Barth KR, Isabella VM, and Clark VL, Biochemical and genomic analysis of the denitrification pathway within the genus Neisseria. Microbiology, 2009. 155(Pt 12): p. 4093–103. [DOI] [PMC free article] [PubMed] [Google Scholar]
- 39.Moreno-Vivian C, et al. , Prokaryotic nitrate reduction: molecular properties and functional distinction among bacterial nitrate reductases. J Bacteriol, 1999. 181(21): p. 6573–84. [DOI] [PMC free article] [PubMed] [Google Scholar]
- 40.Habermeyer M, et al. , Nitrate and nitrite in the diet: how to assess their benefit and risk for human health. Mol Nutr Food Res, 2015. 59(1): p. 106–28. [DOI] [PubMed] [Google Scholar]
- 41.Willis JR, et al. , Citizen science charts two major “stomatotypes” in the oral microbiome of adolescents and reveals links with habits and drinking water composition. Microbiome, 2018. 6(1): p. 218. [DOI] [PMC free article] [PubMed] [Google Scholar]
- 42.Bryan NS, Tribble G, and Angelov N, Oral Microbiome and Nitric Oxide: the Missing Link in the Management of Blood Pressure. Curr Hypertens Rep, 2017. 19(4): p. 33. [DOI] [PubMed] [Google Scholar]
- 43.Hyde ER, et al. , Metagenomic analysis of nitrate-reducing bacteria in the oral cavity: implications for nitric oxide homeostasis. PLoS One, 2014. 9(3): p. e88645. [DOI] [PMC free article] [PubMed] [Google Scholar]
- 44.Vanhatalo A, et al. , Nitrate-responsive oral microbiome modulates nitric oxide homeostasis and blood pressure in humans. Free Radic Biol Med, 2018. 124: p. 21–30. [DOI] [PMC free article] [PubMed] [Google Scholar]
- 45.Gonzalez A, et al. , Migraines are correlated with higher levels of nitrate-, nitrite-, and nitric oxide-reducing oral microbes in the American Gut Project Cohort. MSystems, 2016. 1(5): p. e00105–16. [DOI] [PMC free article] [PubMed] [Google Scholar]
- 46.Wu GD, et al. , Linking long-term dietary patterns with gut microbial enterotypes. Science, 2011. 334(6052): p. 105–8. [DOI] [PMC free article] [PubMed] [Google Scholar]
- 47.David LA, et al. , Diet rapidly and reproducibly alters the human gut microbiome. Nature, 2014. 505(7484): p. 559–63. [DOI] [PMC free article] [PubMed] [Google Scholar]
- 48.Klurfeld DM, et al. , Considerations for best practices in studies of fiber or other dietary components and the intestinal microbiome. Am J Physiol Endocrinol Metab, 2018. 315(6): p. E1087–E1097. [DOI] [PMC free article] [PubMed] [Google Scholar]
- 49.Wirbel J, et al. , Meta-analysis of fecal metagenomes reveals global microbial signatures that are specific for colorectal cancer. Nat Med, 2019. 25(4): p. 679–89. [DOI] [PMC free article] [PubMed] [Google Scholar]
Associated Data
This section collects any data citations, data availability statements, or supplementary materials included in this article.
Supplementary Materials
Supplementary Figure 1. Participants were recruited, selected, and divided into intervention groups as depicted.
Supplementary Figure 2. Saliva genus with significantly changed relative abundance from T1 to T5. Estimated using the analysis of composition of microbiomes (ANCOM) method to account for the compositional nature of the relative abundance data (N=63). Taxa were considered significantly differentially abundant at false discovery rate (FDR) < 0.05.
Supplementary Figure 3. Differences in mean and standard errors, estimated using linear mixed models, of creatine-adjusted urine nitrate levels at each time point (T2-T5) compared to baseline (T1), adjusted for sex, body mass index (kilograms/meter2, continuous), and age (years, continuous). P-values <0.05 were considered significant. All statistical tests were two-sided.