

Abstract
We report a methodology to calculate the free energy of a shape transformation in a lipid membrane directly from a molecular dynamics simulation. The bilayer need not be homogeneous or symmetric and can be atomically detailed or coarse grained. The method is based on a collective variable that quantifies the similarity between the membrane and a set of predefined density distributions. Enhanced sampling of this “Multi-Map” variable re-shapes the bilayer and permits the derivation of the corresponding potential of mean force. Calculated energies thus reflect the dynamic interplay of atoms and molecules, rather than postulated effects. Evaluation of deformations of different shape, amplitude, and range demonstrates that the macroscopic bending modulus assumed by the Helfrich–Canham model is increasingly unsuitable below the 100-Å scale. In this range of major biological significance, direct free-energy calculations reveal a much greater plasticity. We also quantify the stiffening effect of cholesterol on bilayers of different composition and compare with experiments. Lastly, we illustrate how this approach facilitates analysis of other solvent reorganization processes, such as hydrophobic hydration.
Keywords: Molecular dynamics simulation, Free energy, Enhanced sampling, Density distributions, Lipid Membranes, Hydrophobic hydration, Solvent Mixing
INTRODUCTION
There has been great interest among theoretical membrane biophysicists in formulating accurate physical models to describe the structure and energetics of thermally or mechanically induced deformations in lipid bilayers (1–6). Existing approaches differ in the level of detail used to represent the membrane structure, ranging from the atomistic detail of molecular dynamics (MD) simulations to the ‘continuum’ representations in macroscopic theories. When evaluating the energetics of membrane deformations, however, all theoretical models currently in use are variations and extensions of the classic Helfrich-Canham functional (7, 8). According to this model, for a symmetric bilayer that preserves its topology over time, the free-energy F(S) of the curved surface S describing the bilayer mid-plane is given by:
| (1) |
where and are the local values of the membrane curvature along two local axes of the bilayer, is the infinitesimal surface area element along the surface and is the bending modulus. In principle, this formulation of the energetics of membrane perturbations appears to permit a straightforward evaluation of different theoretical models against experimental data through a single, intensive property, . In practice, however, this evaluation is less than straightforward (9). One reason is that measurements of diverge significantly between different experimental approaches (10), with the largest discrepancies observed between methods that induce deformations and those that measure spontaneous thermal fluctuations. Nonetheless, the most important difficulty when comparing measurements with simulation data is that lipid bilayers appear to deviate significantly from the ideal elasticity assumed by the Helfrich-Canham theory for deformations of length scale below 100 Å (11), which currently also happens to be the most amenable for detailed computational analyses.
It is also in this length-scale that many important processes in membrane biology occur, most notably the regulation of membrane protein structure and function by lipids. Thus, it has been of interest to extend the standard Helfrich-Canham model by quantifying other hypothetical contributions to F(S) (12). Among the approaches based on MD simulations, one of the most successful predicts the combined effect of thermal undulations and thickness fluctuations at multiple length scales using an empirical energy function trained against simulation data for large bilayers (~500 Å) (12). A more recent methodology analyzes instead the tilt fluctuation spectra of lipid molecules (4); when compared with vesicle flicker measurements, this route results in close agreement between computed and experimental data (6), even from bilayers smaller than 100 Å where the standard Helfrich-Canham model does not apply. This approach, however, appears to pre-suppose a homogenous bilayer, so that bending and tilting modes can be modeled through the same constant (4). A similar approach, also based on small-scale MD simulations, considers instead the spectrum of lipid splay, and yields fair estimates of the bending modulus for high- lipid mixtures (5); the premise in this case is that each lipid species contributes additively to the mechanical properties of a bilayer, which is not guaranteed (13). Note that a common denominator of the methodologies just outlined is that they seek to infer the energetics of membrane perturbations from inspection of unperturbed states: this approximation seems very plausible for small-amplitude deformations, but it is arguably less so for large-scale membrane remodeling.
Here, we seek to define an alternative route to evaluate the energetics of lipid bilayer deformations that is independent of the Helfrich-Canham model or other pre-conceived theoretical framework; we also ask that the method be applicable to heterogenous membranes and perturbations of any shape and scale. More specifically, we seek to use MD simulations not only to study the structure of the membrane but also to directly compute the potential-of-mean-force (PMF) associated with a given perturbation of interest, much in the same way one would approach other inherently statistical-mechanical processes, such as molecular recognition or conformational change.
The calculation of the PMF for a collective change in a non-stoichiometric molecular aggregate is not trivial, however. As is often the case, the difficulty lies in formulating a suitable reaction coordinate (referred to hereafter as collective variable), and not so much in the choice of enhanced-sampling method. Existing approaches have mostly focused on solvent reorganization processes, and used ‘molecule count’ functions as one-dimensional collective variables with which to control the spatial distribution of e.g. water (14–16); these functions can be analytical (15, 16) or discretized on a grid (14). In practice, however, these approaches are limited to cases that can be examined through simple geometries (e.g. a cylinder for a pore); the need to formulate and hard-code geometry-specific count functions in the simulation algorithm is also a drawback. In a related method, intended for membranes, the structure of a bilayer is mapped onto a grid, and a highly-dimensional collective variable is defined by the lipid density at each and all of the grid elements (17, 18); this approach permits great flexibility and precision in the definition of bilayer shape, but in the context of free-energy calculations, the very high dimensionality of the collective variable makes it computationally very challenging for many cases of interest. The methodology presented here builds upon these earlier efforts and aims to circumvent their key limitations. In the proposed approach, a set of 3D density fields describing the transformation of interest are designed a priori, and mapped onto a grid; during the simulation, a collective variable quantifies the similarity between the instantaneous membrane configuration and each of the target density fields. Biased-sampling of this variable, which we refer to as Multi-Map, therefore induces the membrane to alter its shape reversibly in the manner prescribed by the target set, and the corresponding potential-of mean-force is derived a posteriori from analysis of the trajectory data. This approach thus permits analysis of complex variations in shape or density, not only in lipid membranes but also other molecular aggregates and liquid systems; by avoiding the computational overhead of molecule counting, it affords improved performance and size scalability; and importantly, the Multi-Map variable permits analysis of the PMF in a low-dimensional space (one in most cases), making it compatible with a broad range of enhanced-sampling techniques.
THEORY AND METHODS
Definition of the MultiMap collective variable
Let us define the Cartesian coordinates of a representative set of N atoms in the system of interest as X = (x1, x2, … xN), with x = (x, y, z). Let us also define two scalar functions of the Cartesian coordinates, and , each representing an idealized density distribution of this collection of atoms (mapped onto a discretized grid) at an end-point of a given transformation of the system; and a series of K intermediates of this change in density distribution, , such that and . The Multi-Map collective variable introduced here is defined as:
| (2) |
That is, quantifies the degree of similarity of a given configuration X to each of the k-th density maps , and the value of the Multi-Map variable identifies the map with the highest similarity. It follows from Eq. 2 that an external potential U(ξ) and the corresponding generalized force (propagated to atomic forces via the chain rule), can be used to bias the sampling of ξ so as to induce the transformation of our system of atoms from to . This formulation also permits derivation of the potential of mean force associated with this transformation, as prescribed by the specific enhanced-sampling methodology employed (e.g. umbrella sampling, Metadynamics, etc.).
It is worth noting that the set of target functions need not be density distributions. For example, may be defined as functions that quantify the total occupancy of sub-volumes of the system; in this case the Multi-Map variable would describe relative variations in the number of atoms across those sub-volumes. (As will be shown, this definition is well suited to examine the energetics of solvent density fluctuations). Regardless of the specific functional definition of , a grid-based numerical implementation is greatly advantageous. Not only does this choice make differentiable and hence suitable for MD simulations; it also enables analysis of irregular geometries and large molecular systems.
Application of the Multi-Map variable to lipid bilayer deformations
At equilibrium, a membrane bilayer fluctuates around the ideal planar geometry, and the vertical position of the membrane’s mid-plane, z(x, y), tends to a constant when averaged over many configurations. Most models of membrane mechanics try to estimate the free-energy change when the membrane bilayer shifts to an ensemble where z(x, y) fluctuates instead around a non-trivial deformation profile . To simplify comparisons with the Helfrich-Canham theory, we begin by studying idealized transformations whereby a phospholipid bilayer, represented by the phosphate groups in either leaflet, adopts sinusoidal shapes of increasing amplitude; that is, we assume to be a cosine function (Fig. 1). In this transformation, therefore, each bilayer leaflet adopts a series of states described by:
| (3) |
where Ak is the amplitude of each deformed state k, is the average coordinate of the leaflet, and Lx is the bilayer dimension along the x-axis (for simplicity, the membrane was unperturbed along the y-axis). To induce and characterize this transformation through the Multi-Map variable (Eq. 2), we devise a set of 3D density distributions that reflect the desired perturbation in shape of each bilayer leaflet:
| (4) |
Figure 1. Illustration of the Multi-Map collective variable ξ.
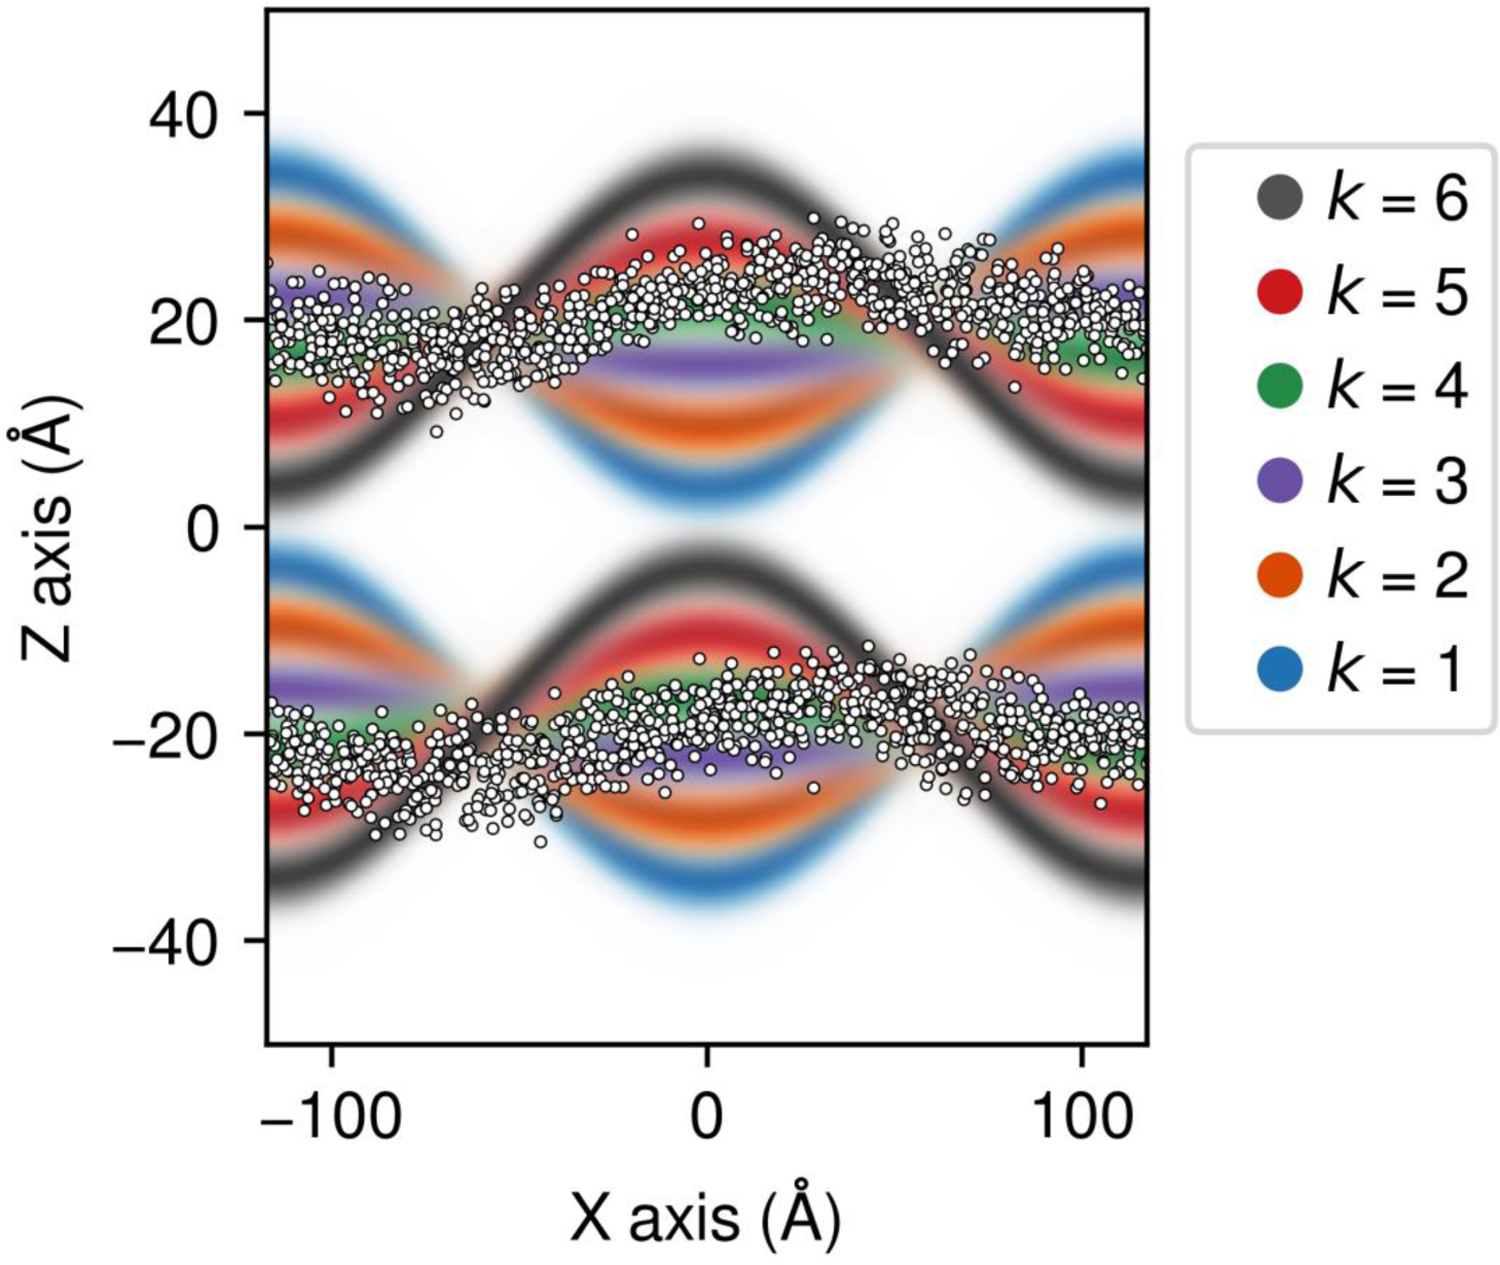
A set of 3D density maps , each representing a deformed state of a lipid bilayer, are shown with different colors as cross-sections along the perpendicular to the bilayer plane. Higher color intensities indicate higher local values of each density map. A simulation snapshot is superposed showing the positions of the phosphate groups (white spheres); the simulation was extracted from an umbrella-sampling simulation whereby the Multi-Map variable is ξ ≈ 4.
Note that each of the density distributions takes its maximum value on a surface shaped as , and decays smoothly orthogonally to this surface (see Fig. 1). This Gaussian profile owes to the fact that any membrane, perturbed or not, will show thermal fluctuations of individual lipids orthogonally to the mid-plane; suppressing these spontaneous protrusions with an overly deterministic definition of would misrepresent the entropy of any given membrane state and likely lead to errors in calculated PMFs. Thus, the parameter σ ought to reflect the natural fluctuations of individual lipid molecules; for most phospholipid bilayers, σ ≈ 2 Å.
As mentioned, the grid-based implementation of allows to be any function of (x, y). However, for the Multi-Map variable to be a continuous function of the atomic coordinates, any two consecutive maps and must overlap to some degree. The implication is that for any given membrane configuration, more than one of the target maps will produce non-zero values of and hence contribute to the instantaneous value of (Eq. 2). The structural interpretation of the range of values of might thus be not perfectly intuitive in some cases. To address this issue, one may simply re-project on a more intuitive structural descriptor calculated from the trajectory data.
A straightforward projection consists, first, in evaluating the average shape of the membrane mid-plane that results from enhanced-sampling at a given value of , denoted by . (In an umbrella-sampling scheme, one would calculate for all configurations sampled in each ‘window’, approximating as a constant.) Then, the average profile is projected onto the idealized target, , to quantify the similarity of these two distributions. For a sinusoidal deformation such as that defined in Eq. 3, this projection is the amplitude A of the displacement along the (1, 0) Fourier mode:
| (5) |
where is the mean of along the xy plane. (This expression is very similar to the collective variable used by den Otter and Briels (1), but is computed here for an average profile instead of a single membrane configuration.) Eq. 5 can be generalized to any idealized deformation as:
| (6) |
where and are the mean and variance of along the xy plane.
The amplitude A provides a well-defined physical descriptor, complementary to the more abstract variable . As will be shown below, for the shapes considered in this study A and are linearly correlated, and hence the projection onto A of the PMF computed along involves simply a scaling factor (in units of length). In more complex cases, projecting the PMF may require reweighting of the trajectory data (19).
The projection of in terms of the amplitude A also permits comparison of free-energies profiles calculated directly from MD simulations with elastic-energy profiles computed with the Helfrich-Canham model (Eq. 1). (For simplicity, hereafter we substitute by .) To do so, we approximate the local curvature of the membrane by the second-derivatives of , as is customary. The Helfrich-Canham free-energy function thus becomes:
| (7) |
where is used here to simplify the following discussion. For a set of membrane deformations of identical shapes but different amplitudes, such as those considered in this study, both second derivatives are proportional to A, and therefore the Helfrich-Canham energy is a quadratic function of the amplitude. For example, for a sinusoidal deformation :
| (8) |
Lastly, because A and are often linearly correlated, PMF(ξ) is also a quadratic function of ξ when characterizing ‘macroscopic’ deformations. As is discussed below, we find that this quadratic relationship also holds for ‘microscopic’ deformations, with the bending modulus replaced by a parameter whose value is not constant but varies with the lateral range of the perturbation.
Application of the Multi-Map variable to solvent fluctuations
As mentioned, the Multi-Map variable may be also used to examine the energetics of solvent reorganization processes. One way to do so is to define the set of density maps in Eq. 2 as functions that quantify the occupancy of different sub-volumes of the system by different solvent types. As noted, these volumes need not be of regular geometries, owing to the grid-based implementation of the Multi-Map variable, but in order to quantitatively compare the performance of our approach with existing methods, we consider a simple example: the energetics of wetting and de-wetting of a hydrophobic carbon nanotube. That is, as in the previous section we aim to calculate , but must now quantify the number of water molecules inside a tubular geometry. This calculation may be carried using a single density map. Following Zhou et al, we use the following switching function (16)grid lifts these restrictions by using maps :
| (9) |
where is the distance from the nanotube axis, R is the nanotube radius, and Z its height. and define two intervals within which and its derivatives smoothly tail off to zero, ensuring that the collective variable is continuous and thus suitable for MD simulations. Specifically, the polynomial switching functions and are (16):grid lifts these restrictions by using maps
| (10) |
| (11) |
As with the lipid bilayers, it follows from Eq. 9–11 that biased sampling of through an external potential U(ξ) will reversibly alter the water occupancy of the nanotube between any two given states and permit the derivation of the corresponding potential-of-mean-force profile.
Implementation and availability of the Multi-Map collective variable
The Multi-Map collective variable described here has been implemented in and will be freely available through the NAMD simulation engine (20). It entails the combined use of upgraded versions of the GridForces feature (21) and the Colvars module (22). GridForces is a small library of functions that enable the addition of an external potential u(x) to the standard energy function; u(x) is assumed to be invariant and defined on a 3D grid in absolute Cartesian space, and during run-time atomic potentials and forces are derived through interpolation (21). GridForces has been used in diverse applications; the MDFF protocol (23, 24) for structure modeling through restraints based on electron-density maps is one example. To our knowledge, however, this approach had not been used for thermodynamic sampling or free-energy calculations before. The modifications introduced enable us to use multiple GridForces potentials concurrently, each mapping one of the target density distributions , and to compute in Eq. 2 for each map and atomic configuration; in parallel, the Colvars module (22) is used to calculate and bias the sampling of the Multi-Map collective-variable through one of the available enhanced-sampling techniques.
Simulation specifications: lipid bilayers
Coarse-grained (CG) bilayers were modeled with the MARTINI force field (25) and simulated at 300 K and 1 atm using NAMD (20) with a time-step of 25 fs and a 12-Å non-bonded cut-off. Atomistic bilayers were simulated with the CHARMM force field for lipids (26) and the TIP3P force field for water (27), with a time step of 2 fs and a 12-Å short-range cut-off; Particle-Mesh Ewald (PME) was used to compute long-range electrostatic interactions, using a 0.9 Å grid-point spacing (28). Both the atomistic and CG bilayers were simulated at 300 K and 1 atm with semi-anisotropic pressure coupling (29, 30), which were applied to the Pzz and (Pxx+Pyy)/2 pressure components separately.
Initial coordinates for the 100-lipid and 200-lipid CG bilayers were generated as crystalline-gels and equilibrated for 100 ns each to reach a liquid-disordered configuration. Initial coordinates for the 800-, 1800- and 5000-lipid bilayers were obtained by replicating the 200-lipid bilayer followed by a 50-ns equilibration. Coordinates for the atomically-detailed bilayers were obtained from a previous study (31).
All potential-of-mean-force calculations were based on the umbrella-sampling method (19). The Multi-Map variable for sinusoidal deformations (Eq. 2–4) was defined with six maps with amplitudes Ak = –10, –6, –2, +2, +6, +10 Å for k = 1, … 6, respectively. The half-width of the Gaussian profile of each of these density maps [eq. (4)] was set to σ = 2 Å. The umbrella-sampling calculations sampled in a range between 3.5 and 4.75, using a series of 31 windows spaced by 0.042. The starting configurations for each of these windows were extracted from a trajectory that sampled the target range with a moving harmonic restraint on of force constant 1,280 kcal/mol and speed 0.0025 ns−1. Each configuration was then simulated independently for approximately (CG models) or 60 ns (atomistic models) with a static harmonic restraint of the same force constant. The corresponding profiles were obtained by analyzing the resulting simulation data with WHAM (32).
Simulation specifications: carbon nanotube
A tool written by Johnson and Kohlmeyer for VMD (33) was used to create a C280 nanotube of radius R = 5.3 Å and length Z = 22 Å. The nanotube was immersed in a bath of TIP3P molecules (27) and enclosed in a periodic simulation box of 35×35×46 Å3. Nanotube carbon atoms were represented with the CGENFF force field (34). The position and orientation of the nanotube was maintained through harmonic position restraints of force constant of 5 kcal/mol/Å2 applied to all carbon atoms. The potential-of-mean-force for the hydration/dehydration of the nanotube was calculated with umbrella sampling (19), using 100 windows along the collective variable , spaced by 0.5. Each window simulated independently for approximately 40 ns, and used a harmonic restraint on of force constant 2 kcal/mol. The was reconstructed using the WHAM method (32). For comparison, a Metadynamics (35) simulation was also carried to compute this , using the same collective variable but defined analytically (16). This calculation used Gaussian functions of half-width as hills along the collective variable; the hill weight was gradually decreased from 0.05 to 0.001 kcal/mol over the length of simulation, which was 260 ns.
RESULTS AND DISCUSSION
Free-energy of membrane deformation: direct PMF versus Helfrich-Canham model
As mentioned, membrane deformations of scale in the order of 100 Å or less deviate significantly from the ideal elasticity assumed by the Helfrich-Canham model (12, 36). One way to reveal this deviation is through analysis of the simulated thermal fluctuations of a sufficiently large membrane. As shown in Fig. 2, the calculated undulation spectrum of a symmetric bilayer of 5,000 POPC lipids, represented with a coarse-grained (CG) forcefield, fits the Helfrich-Canham theory only at low wave numbers q. These lowest-q components remain under-sampled even after of simulation time, consistent with their very long oscillation periods. Nonetheless, a fit to the theory yields a kc value of 18 kcal/mol (12×10−20 J), which compares well with experiment and existing estimates based on all-atom simulations, i.e. 19 kcal/mol (13×10−20 J) (6). In contrast, shorter-range undulations, i.e. q > 0.05 Å−1, are very well sampled but are not described correctly by the Helfrich-Canham model (Fig. 2). As noted, it is in this 100-Å length scale that a broad range of processes of lipid regulation of membrane protein structure and function occur. It is therefore in this length scale where a direct derivation of the free-energy of membrane deformation would be uniquely informative, both from a fundamental and biological standpoints.
Figure 2. Undulation spectrum of a symmetric bilayer of 5,000 POPC lipids as a function of the wave number q.
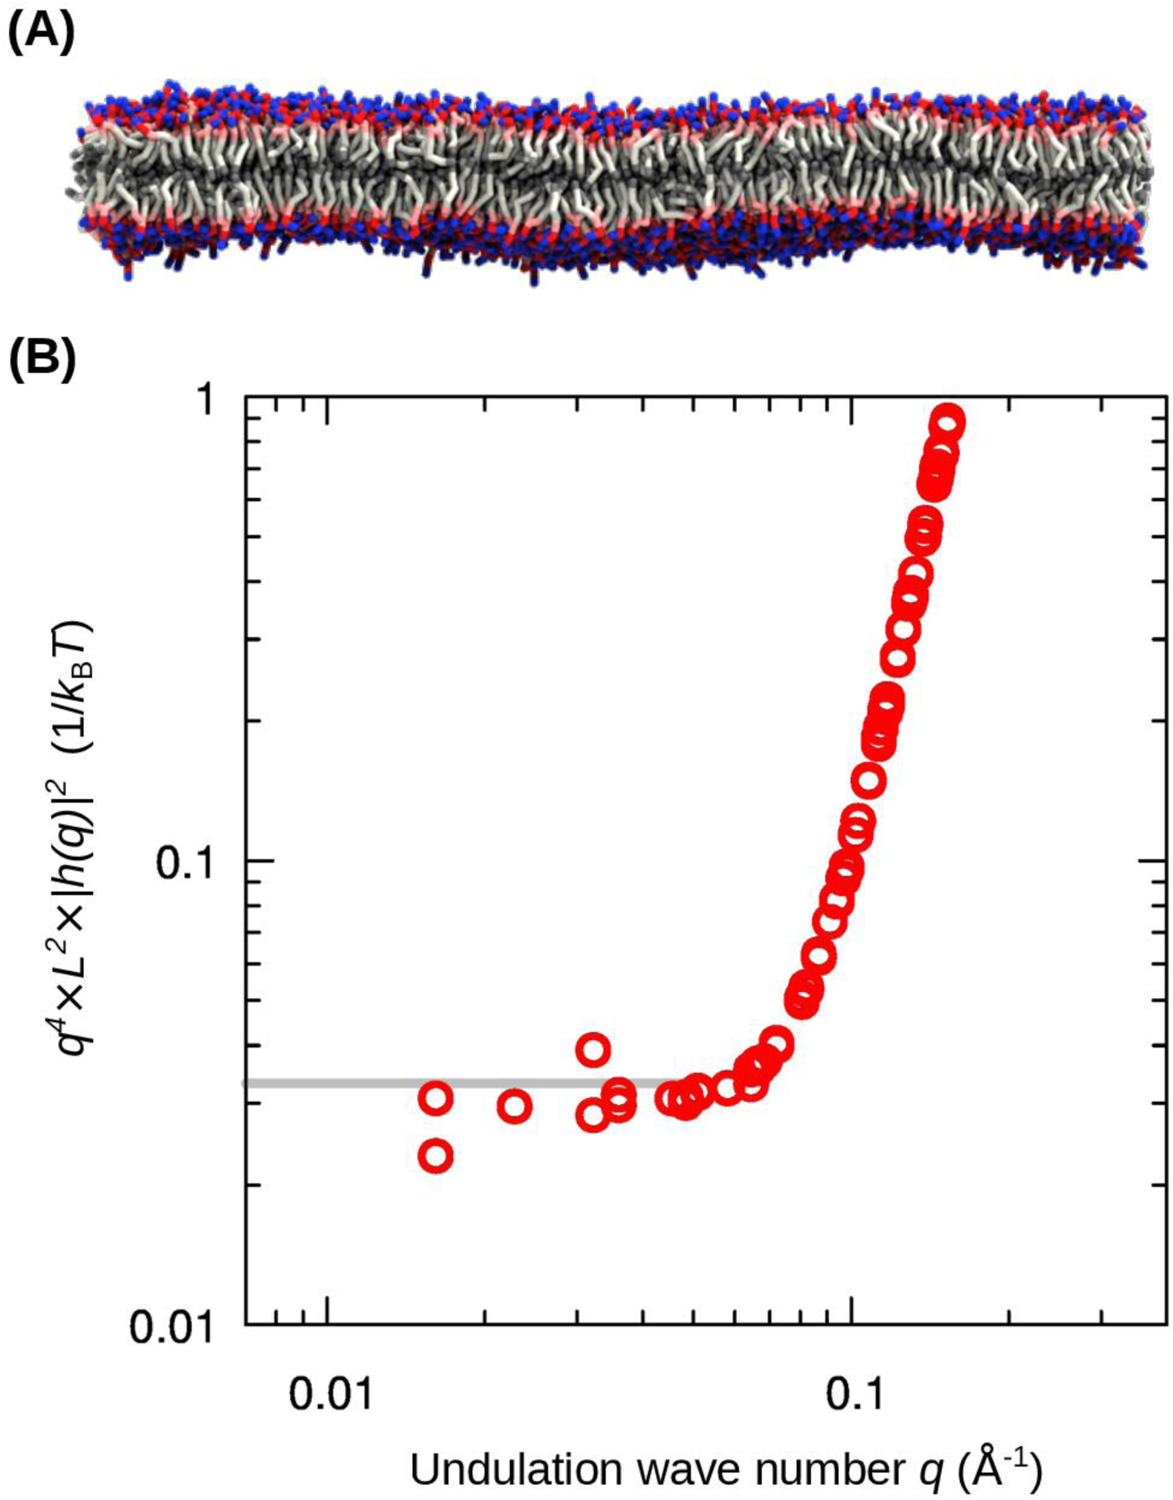
(A) Snapshot of the lipid bilayer, represented with CG resolution (the solvent is omitted for clarity). The bilayer was simulated for . (B) The product of q4, the oscillation intensity |h(q)|2, and the bilayer area L2 is plotted against q to highlight the divergence from ideal elasticity at q > 0.05 Å−1 (i.e. wave length of about 100 Å or less). The gray line indicates the prediction by the Helfrich-Canham model for a value of the bending modulus of .
To evaluate the proposed method, we set out to quantify the potentials-of-mean-force (PMFs) for a series of sinusoidal membrane deformations of symmetric bilayers. We deliberately chose simple systems and perturbations thereof to be able to directly compare our results with predictions based on the Helfrich-Canham model. Specifically, we considered 4 bilayers of 100, 200, 800 and 1800 POPC lipid molecules (CG), so as to examine deformations that vary not only in amplitude, perpendicularly to the membrane plane, but also in their lateral range, along one of the membrane-parallel axes.
The PMFs computed with the Multi-Map method were found to be approximately quadratic with the amplitude A of the perturbation (Fig. 3A, B). Qualitatively, this result is consistent with the Helfrich-Canham model (Eq. 8). The coefficient of this quadratic relationship, however, differs markedly from the abovementioned ‘macroscopic’ value of kc. That is, in order for these PMFs to fit the Helfrich-Canham energy, the bending modulus must vary with the deformation wave vector, q, rather than being a constant. Specifically, as the lateral range of the deformation is reduced, the ‘microscopic’ estimates of the bending modulus are 74%, 77%, 52% and 30% of the ‘macroscopic’ estimate, for the 1800, 800, 200, and 100-lipid bilayers, respectively (Fig. 3C). The range in values of q where the discrepancy emerges is also in agreement with the undulation spectrum of the unbiased 5000-lipid bilayer (Fig. 2).
Figure 3. Potentials of mean force for sinusoidal deformations of symmetric POPC bilayers.

(A) PMFs calculated with the Multi-Map collective variable and projected onto the Fourier amplitude A(1,0) (circles) are compared with predictions based on the Helfrich-Canham elastic model using a bending modulus (dashed lines). In all cases, the period of the sinusoidal deformations is equal to the bilayer lateral width L. Data is shown for bilayers of 100 lipids (purple, L = 56 Å), 200 lipids (red, L = 78 Å), 400 lipids (green, L = 156 Å), and 1800 lipids (blue, L = 234 Å). (B) Difference between each of the PMFs in (A) and its best-fit Helfrich-Canham-like quadratic curve with an adjustable bending modulus . Small differences (less than 0.5 kcal/mol) demonstrate that the Multi-Map PMFs are approximately quadratic with curvature. (C) Best-fit values of the adjustable parameter for each of the bilayers in (A). This ‘microscopic’ bending modulus is plotted as a function of the corresponding wave number q. The grey area represents the 95% confidence band from the linear regression in (B); the solid line is the bending modulus estimated from large-bilayer simulations; the dashed lines indicate two experimental measurements.(42, 45) (D) Free-energy per unit area as a function of the root-mean-squared curvature , deduced from the PMF calculations in panel (A); this analysis confirms the PMFs are approximately quadratic with curvature, but the apparent bending modulus differs from the macroscopic value of (black line).
Fig. 4 depicts final snapshots for each of the bilayers considered after umbrella-sampling simulations at ; average membrane profiles are also shown in each case. The Multi-Map variable is deliberately designed to have a minimal impact on the natural thermal fluctuations of the membrane, so as to more accurately capture the energetics of bilayer shape transformations. Because these fluctuations are inexpensive energetically but can take a long time to average out (particularly the low-frequency modes), the mean profile calculated for a given sampling window might not always match perfectly the idealized shapes used to define . Similarly, individual snapshots will typically show lipid protrusions, like those observed in unbiased simulations (Fig. 4). Suppression of these thermal fluctuation modes, through a much more deterministic biasing scheme, is in our view unrealistic – as these modes will spontaneously occur also when a bilayer is deformed, say, by an integral membrane protein. Accordingly, we observe that the statistical convergence of PMF(ξ) requires considerably shorter sampling times than that needed to fully average out all thermal fluctuations in the membrane. Indeed, the PMFs in Fig. 3A are nearly identical if computed with a fraction of the total simulation time (not shown).
Figure 4. Thermal fluctuations of individual lipids in bilayer simulations under a harmonic-restraint on the Multi-Map variable ξ.

Top and middle rows show the final snapshots of the upper and lower leaflet for the window centered at (deformation amplitude A(1,0) = 2 Å) of the umbrella-sampling simulations described in Fig. 3. Despite the harmonic restraint on , individual lipids undergo spontaneous fluctuations akin to those observed in an unperturbed bilayer: lipid head groups (spheres) are colored based on their vertical displacement from the average position of the leaflet, z0. The bottom row shows the mean deformation profiles computed from the whole simulation window and averaged over both leaflets. The color scale ranges from –10 Å to 10 Å, dashed contour lines are every 1 Å and the solid line corresponds to .
It is also worth noting that the free-energy curves in Fig. 3A are re-projections of PMFs originally calculated in the space of ξ (Eq. 5). As explained in Theory and Methods, this re-projection is carried a posteriori, based on the trajectory data, and although it is not essential, it is intended to give a dimensionality (Å) to the PMF curve. As demonstrated in Fig. 5, the relationship between A(1,0) and for the deformations discussed in Fig. 3 is linear, and therefore this reprojection is straightforward. The specific scaling factors are the slopes of the linear regressions of A(1,0) and , namely 4.0, 4.04, 4.44 and 4.80 Å for the 100-, 200-, 800- and 1800-lipid bilayer, respectively (Fig. 5). If A and ξ had not been linearly correlated, regression with higher-order curves or reweighting could have been used.
Figure 5. Conversion from the Multi-Map variable ξ (dimensionless) to the deformation amplitude.

A. The figure compares the mean of the Multi-Map variable and the mean of the corresponding Fourier amplitude , computed following Eq. 5 for the umbrella-sampling windows on used to the derive the PMFs shown in Fig. 3; each point is the average for one window. The regression lines approximating the relationship between and A(1,0) were used to express as a function of A(1,0) in Fig. 3A.
In conclusion, we have shown that the application of the Multi-Map method not only induces the membrane to change its morphology as intended, but also permits derivation of well-defined PMF profiles. Comparison of these PMFs with calculations based on the standard Helfrich-Canham energy function shows good quantitative agreement, but only for large bilayers. In the sub-100 Å range, however, the Helfrich-Canham function systematically overestimates the stiffness of the membrane; even for moderate amplitudes, this error can be in the order of 10 kcal/mol. We would argue, therefore, that direct derivations of the PMF are key to understanding the bilayer energetics in this important regime. The method presented here permits a quantification of this ‘microscopic’ PMF without requiring a calibration based on simulation data for large bilayer systems. To the contrary, we posit that direct PMF calculations could to be used to calibrate more mesoscopic approaches, such as those based on continuum-mechanics theory.
Quantifying the role of cholesterol in localized membrane deformations
It is increasingly recognized that the biophysical properties of the membrane, whether in physiological or in vitro conditions, influence the structure and function of many membrane-associated proteins (37–40). One reason is that the molecular mechanisms of membrane proteins often entail transient or persistent deformations in the surrounding membrane; thus, alteration of the elastic properties or natural curvature of these membranes, through variations in their lipid composition, is one way to regulate protein activity. To attain a detailed understanding of the relationship between molecular composition and biophysical properties is thus an area of active research in membrane biophysics. The methodology presented here is uniquely designed to advance this understanding, in that it permits a direct characterization of non-homogenous membranes, with no assumptions in regard to the contribution from each component.
To illustrate this capability, we sought to quantify the known stiffening effect of cholesterol, which is known to vary with lipid composition (41), and to make a quantitative comparison of our results with macroscopic experiments. Specifically, we used the Multi-Map variable to compute the free-energy cost of sinusoidal deformations of three 200-lipid bilayers of POPC, DMPC, or DOPC, each including 30% cholesterol and represented in atomistic detail. Analogous calculations were carried for pure bilayers without cholesterol.
The results of this analysis are summarized in Fig. 6 and Table 1. Consistent with the results discussed in the previous section, we found the calculated PMFs to be approximately quadratic functions of the amplitude of the induced deformation. As noted above, however, the ‘microscopic’ or ‘apparent’ bending moduli deduced from these PMFs are systematically smaller than the values determined experimentally, because the range of the perturbation evaluated is below the 100 Å limit where macroscopic theory does not apply. Therefore, to quantitatively evaluate how this effect compares with experiment, we calculated the relative change in the apparent bending modulus upon addition of cholesterol, , and compared it with the same ratio deduced from macroscopic measurements (Table 1).
Figure 6. Direct calculation of the stiffening effect of cholesterol on lipid bilayers.

Shown are PMFs of sinusoidal deformations of 200-lipid bilayers, represented at atomistic resolution, for POPC (A), DOPC (B) and DMPC (C). For each lipid type, the PMF with a pure-lipid composition is shown in purple and the 30% cholesterol in red. Snapshots at the end of the umbrella-sampling simulation, for the window with the largest deformation, are shown on the right; the bilayers containing cholesterol (pink) are shown atop the pure bilayers. Because pure and cholesterol-mixed bilayers have different areas, the free energy is given per unit of area.
Table 1. Cholesterol stiffening effect is transferable across length scales.
Shown are the estimated bending moduli kc (in kcal/mol) of pure and mixed membranes measured or estimated at “macroscopic” length scales (small wave number q), compared to those computed in this work at microscopic length scales (high q) by fitting quadratic functions against the PMFs shown in Fig. 7.
Computed and experimental values of this ratio are in good agreement for POPC (42) and DMPC (41) (2- and 3.5-fold compared to 2.2 and 4.7-fold, respectively). For DOPC, the calculated PMFs show that the effect of cholesterol is smaller than for POPC or DMPC, but the result (1.4-fold) is at odds with published experimental data reportedly showing no effect (41, 43). We should note, however, that unpublished measurements using multiple complementary techniques consistently show cholesterol does have a stiffening effect on DOPC (Rana Ashkar, personal communication). The reasons for the divergence between these experiments is unclear. In any case, we posit that the model-free methodology introduced here may now be applied more systematically to clarify this and similar questions.
Evaluation of complex membrane deformations
As mentioned above, the Multi-Map method is designed to facilitate the evaluation of membrane perturbations of arbitrary shape, not only sinusoidal. To illustrate this capability, we calculated the PMF for a transformation constructed by the set of functions:
| (12) |
where , and φ = tan−1(y/x). As shown in Fig. 7A, the functions represent a perturbation with two elevations and two depressions, both of variable amplitude, and both vanishing at the boundaries of the simulation system. Using Eq. 4, we generated a set of 3D density maps with values of –9, –3, +3, +9, +15, +21 Å for k = 1, … 6, respectively. The resulting Multi-Map variable ξ (Eq. 2) was then used to perturb a 1800-lipid bilayer and compute the associated PMF. The calculation consisted of 25 umbrella-sampling windows, spanning ξ values ranging from 2.5 to 3.3. Each simulation was approximately long.
Figure 7. PMF for a non-sinusoidal membrane deformation.
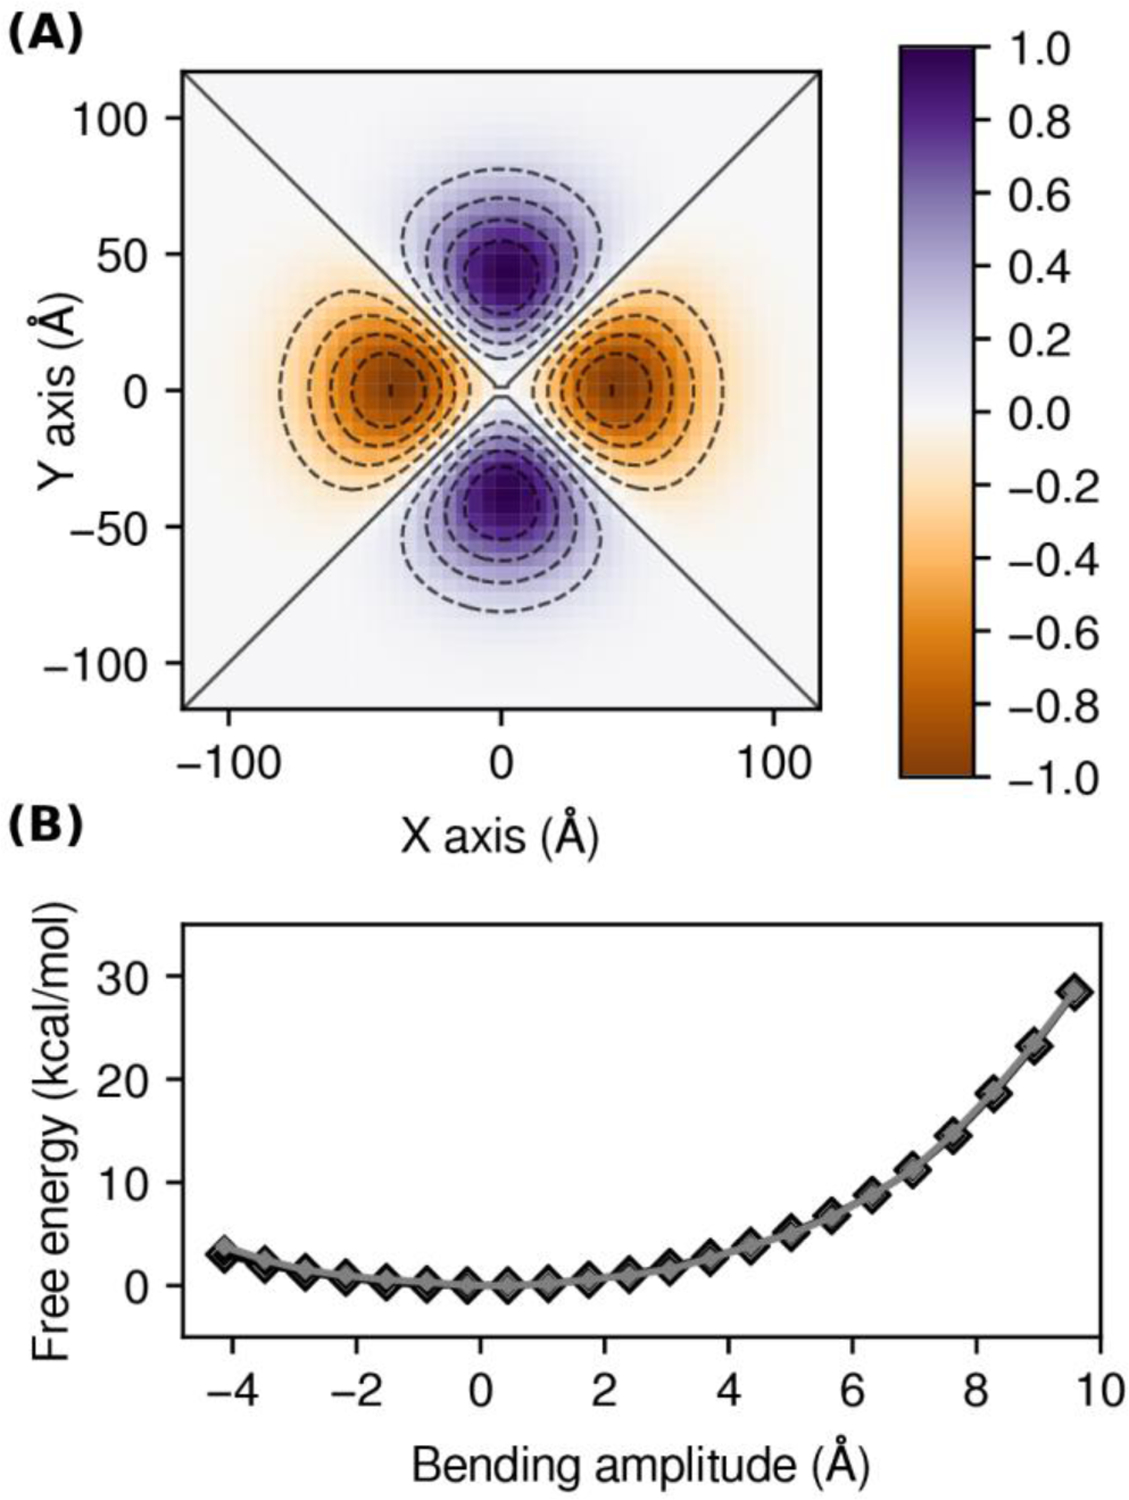
(A) Idealized deformation profile defined in Eq. 12; the value of is chosen so that maxima and minima are at ±1 Å; dashed contour lines are drawn every 0.2 Å and the contour lines are drawn as solid. (B) PMF resulting from the deformation shown in (A), as a function of the bending amplitude (Eq. 6), calculated with the Multi-Map method and umbrella-sampling simulations, for an 1800-lipid POPC bilayer (CG resolution). Shown are the PMFs calculated after of sampling time per window (small grey diamonds) and after per window (large black diamonds).
The result of this calculation is shown in Fig. 7B and Fig. 8. It is worth noting that the energetic cost of the perturbation increases rapidly with its amplitude, as the bilayer is forced to curve drastically in a relatively confined space, not unlike the effect of a hypothetical membrane protein. This penalty would be considerably greater, however, if the macroscopic bending modulus was used to estimate the membrane energy (Fig. 3D). As was noted for the sinusoidal deformations, inspection of the mean membrane profile for each of the umbrella-sampling windows shows that the Multi-Map method does induce the membrane perturbation that is intended (Fig. 8); even though the thermal fluctuations of the membrane (which are unperturbed by the Multi-Map bias) are not totally averaged out after of simulation time, the calculated PMF converges after of sampling time per window (Fig. 7B).
Figure 8. Membrane deformation profiles for a non-sinusoidal perturbation of increasing amplitude.

Each panel shows the mean deformation profile , for both bilayer leaflets, computed for each of the umbrella-sampling windows used to derive the PMF in Fig. 7B. The target value of the Multi-Map variable in each window, ξ0, is indicated alongside the mean amplitude A, calculated with Eq. 6 (i.e. the dot-product between and ). The color scale for is as in Fig. 4 (ranging from –10 Å to 10 Å); dashed contours are every 2 Å and the solid line corresponds to .
Free-energy of hydrophobic cavity wetting and de-wetting
To illustrate how the proposed method may be used to simulate solvent fluctuations and examine their energetics, we considered a hydrophobic single-walled carbon nanotube, and evaluated the potential of mean force as a function of the number of water molecules therein (Fig. 9). Admittedly, this problem does not take full advantage of the proposed Multi-Map variable, in that it uses a single density map; however, it is sufficiently straightforward to be amenable to both conventional and existing enhanced-sampling simulations (14–16, 44), which we will use to compare our results.
Figure 9. Free-energy of wetting / de-wetting of a C280 nanotube, as a function of the number of water molecules therein.

Shown are PMFs derived from Boltzmann inversion of unbiased probability distributions calculated from MD trajectories (black); using an analytically computed density-function as collective variable, and Metadynamics (red); and using the grid-based method proposed here (green). The nanotube and water molecules therein are graphically displayed alongside the volume mapping the water-number density in our calculations (light blue, contoured at 50% of the maximum).
Specifically, we considered a 280-carbon nanotube, and calculated the PMF with our method as well as with two other approaches. In one case we carried a total of 20-μs of unbiased MD simulations and derived the PMF from Boltzmann inversion of the resulting probability distribution (for the number of water molecules inside the nanotube). In the other, we followed the approach described in Zhou et al. (16), whereby an analytical ‘water-number’ function, specifically defined for a cylindrical geometry, is used as the biased collective variable that is reversibly sampled, using Metadynamics (35).
As shown in Fig. 9, the three PMFs demonstrate, as expected, that there exists a dynamic equilibrium between hydrated and dehydrated states of the nanotube. The former is more populated, by approximately 10-fold, and both states are separated by a modest energy barrier. Importantly, the three PMFs appear indistinguishable within the sampling error. This comparison thus confirms our approach produces the appropriate statistical ensembles and the corresponding free energies. Needless to say, free-energy differences are rarely amenable to conventional simulations; enhanced-sampling methods are required for most problems of interest. The advantage of our approach, compared with existing enhanced-sampling methods, is that it does not require that analytical molecule-count functions be predefined for simple geometries and hard-coded into the simulation algorithm (15, 16), nor is its size-scalability limited by the computational overhead of double convolution loops (14, 15).
CONCLUSIONS
We have introduced a practical and efficient method to evaluate the free energy cost or gain associated with a shape transformation in a dynamic aggregate of biomolecules, such as lipid bilayers. Through this approach, potentials-of-mean-force can be derived directly from a molecular dynamics simulation. The methodology is designed to facilitate analysis of membranes of any morphology and composition, without pre-conceived assumptions other than those inherent to the molecular dynamics method. Importantly, this technique is purposely designed to be a free-energy calculation method – not merely a means to impose a given morphology. We posit that this approach will foster a range of advancements in fundamental and applied membrane biophysics research. On a fundamental level, we have illustrated how the method can be used to evaluate deformations beyond the limits of the Helfrich-Canham model, and thus serve as a means to calibrate semi-empirical models of membrane energetics. A range of other questions, such as how lipid composition impacts rigidity and spontaneous curvature, will be similarly amenable. We also anticipate that the Multi-Map collective variable will facilitate the characterization of the interplay between membrane morphology and membrane protein structure and mechanisms, and that it will enable quantitative studies of solvent fluctuations in multicomponent systems and irregular geometries.
ACKNOWLEDGMENTS
We are grateful to Grace Brannigan, and James Phillips for useful discussions; to Michael Grabe for detailed feedback on this manuscript; and to Alan Grossfield for his WHAM code. This work was funded by the Division of Intramural Research of the National Heart, Lung and Blood Institute (NHLBI). Computational resources were provided in part by Biowulf, the HPC facility of the National Institutes of Health (NIH).
REFERENCES
- 1.den Otter WK, Briels WJ. The bending rigidity of an amphiphilic bilayer from equilibrium and nonequilibrium molecular dynamics. J Chem Phys. 2003;118(10):4712–20. [Google Scholar]
- 2.Kawamoto S, Nakamura T, Nielsen SO, Shinoda W. A guiding potential method for evaluating the bending rigidity of tensionless lipid membranes from molecular simulation. J Chem Phys. 2013;139(3):034108. Epub 2013/07/26. doi: 10.1063/1.4811677. [DOI] [PubMed] [Google Scholar]
- 3.Hu MY, de Jong DH, Marrink SJ, Deserno M. Gaussian curvature elasticity determined from global shape transformations and local stress distributions: a comparative study using the MARTINI model. Faraday Discuss. 2013;161:365–82. doi: 10.1039/c2fd20087b. [DOI] [PubMed] [Google Scholar]
- 4.Watson MC, Brandt EG, Welch PM, Brown FLH. Determining biomembrane bending rigidities from simulations of modest size. Phys Rev Lett. 2012;109(2). [DOI] [PubMed] [Google Scholar]
- 5.Khelashvili G, Kollmitzer B, Heftberger P, Pabst G, Harries D. Calculating the bending modulus for multicomponent lipid membranes in different thermodynamic phases. J Chem Theory Comput. 2013;9(9):3866–71. doi: 10.1021/ct400492e. [DOI] [PMC free article] [PubMed] [Google Scholar]
- 6.Venable RM, Brown FLH, Pastor RW. Mechanical properties of lipid bilayers from molecular dynamics simulation. Chem Phys Lipids. 2015;192:60–74. doi: 10.1016/j.chemphyslip.2015.07.014. [DOI] [PMC free article] [PubMed] [Google Scholar]
- 7.Canham PB. Minimum energy of bending as a possible explanation of biconcave shape of human red blood cell. J Theor Biol. 1970;26(1):61–&. doi: Doi 10.1016/S0022-5193(70)80032-7. [DOI] [PubMed] [Google Scholar]
- 8.Helfrich W. Elastic properties of lipid bilayers - theory and possible experiments. Z Naturforsch C. 1973;28(11–1):693–703. [DOI] [PubMed] [Google Scholar]
- 9.Bochicchio D, Monticelli L. The membrane bending modulus in experiments and simulations: a puzzling picture. Adv Biomembr Lipid. 2016;23:117–43. doi: 10.1016/bs.abl.2016.01.003. [DOI] [Google Scholar]
- 10.Nagle JF, Jablin MS, Tristram-Nagle S, Akabori K. What are the true values of the bending modulus of simple lipid bilayers? Chem Phys Lipids. 2015;185:3–10. doi: 10.1016/j.chemphyslip.2014.04.003. [DOI] [PMC free article] [PubMed] [Google Scholar]
- 11.Goetz R, Gompper G, Lipowsky R. Mobility and Elasticity of Self-Assembled Membranes. Physical Review Letters. 1999;82(1):221–4. doi: 10.1103/PhysRevLett.82.221. [DOI] [Google Scholar]
- 12.Brannigan G, Brown FL. A consistent model for thermal fluctuations and protein-induced deformations in lipid bilayers. Biophys J. 2006;90(5):1501–20. Epub 2005/12/06. doi: 10.1529/biophysj.105.075838. [DOI] [PMC free article] [PubMed] [Google Scholar]
- 13.Sodt AJ, Venable RM, Lyman E, Pastor RW. Non-additive compositional curvature energetics of lipid bilayers. Phys Rev Lett. 2016;117(13). [DOI] [PMC free article] [PubMed] [Google Scholar]
- 14.Patel AJ, Varilly P, Chandler D. Fluctuations of water near extended hydrophobic and hydrophilic surfaces. The journal of physical chemistry B. 2010;114(4):1632–7. doi: 10.1021/jp909048f. [DOI] [PMC free article] [PubMed] [Google Scholar]
- 15.Mirjalili V, Feig M. Density-biased sampling: a robust computational method for studying pore formation in membranes. J Chem Theory Comput. 2015;11(1):343–50. doi: 10.1021/ct5009153. [DOI] [PMC free article] [PubMed] [Google Scholar]
- 16.Zhou WC, Marinelli F, Nief C, Faraldo-Gomez JD. Atomistic simulations indicate the c-subunit ring of the F1Fo ATP synthase is not the mitochondrial permeability transition pore. Elife. 2017;6. [DOI] [PMC free article] [PubMed] [Google Scholar]
- 17.Smirnova YG, Muller M. Calculation of membrane bending rigidity using field-theoretic umbrella sampling. J Chem Phys. 2015;143(24). [DOI] [PubMed] [Google Scholar]
- 18.Smirnova YG, Risselada HJ, Muller M. Thermodynamically reversible paths of the first fusion intermediate reveal an important role for membrane anchors of fusion proteins. P Natl Acad Sci USA. 2019;116(7):2571–6. doi: 10.1073/pnas.1818200116. [DOI] [PMC free article] [PubMed] [Google Scholar]
- 19.Torrie GM, Valleau JP. Non-physical sampling distributions in Monte-Carlo free-energy estimation - umbrella sampling. J Comput Phys. 1977;23(2):187–99. [Google Scholar]
- 20.Phillips JC, Braun R, Wang W, Gumbart J, Tajkhorshid E, Villa E, Chipot C, Skeel RD, Kale L, Schulten K. Scalable molecular dynamics with NAMD. J Comput Chem. 2005;26(16):1781–802. [DOI] [PMC free article] [PubMed] [Google Scholar]
- 21.Wells DB, Abramkina V, Aksimentiev A. Exploring transmembrane transport through alpha-hemolysin with grid-steered molecular dynamics. J Chem Phys. 2007;127(12):125101. doi: 10.1063/1.2770738. [DOI] [PMC free article] [PubMed] [Google Scholar]
- 22.Fiorin G, Klein ML, Henin J. Using collective variables to drive molecular dynamics simulations. Mol Phys. 2013;111(22–23):3345–62. doi: 10.1080/00268976.2013.813594. [DOI] [Google Scholar]
- 23.Trabuco LG, Villa E, Mitra K, Frank J, Schulten K. Flexible fitting of atomic structures into electron microscopy maps using molecular dynamics. Structure. 2008;16(5):673–83. doi: 10.1016/j.str.2008.03.005. [DOI] [PMC free article] [PubMed] [Google Scholar]
- 24.Singharoy A, Teo I, McGreevy R, Stone JE, Zhao J, Schulten K. Molecular dynamics-based refinement and validation for sub-5 A cryo-electron microscopy maps. Elife. 2016;5:16105. doi: 10.7554/eLife.16105. [DOI] [PMC free article] [PubMed] [Google Scholar]
- 25.Marrink SJ, Risselada HJ, Yefimov S, Tieleman DP, de Vries AH. The MARTINI force field: coarse-grained model for biomolecular simulations. The journal of physical chemistry B. 2007;111(27):7812–24. doi: Doi 10.1021/Jp071097f. [DOI] [PubMed] [Google Scholar]
- 26.Klauda JB, Venable RM, Freites JA, O’Connor JW, Tobias DJ, Mondragon-Ramirez C, Vorobyov I, MacKerell AD, Pastor RW. Update of the CHARMM all-atom additive force field for lipids: validation on six lipid types. The journal of physical chemistry B. 2010;114(23):7830–43. doi: Doi 10.1021/Jp101759q. [DOI] [PMC free article] [PubMed] [Google Scholar]
- 27.Jorgensen WL, Chandrasekhar J, Madura JD, Impey RW, Klein ML. Comparison of simple potential functions for simulating liquid water. J Chem Phys. 1983;79(2):926–35. doi: 10.1063/1.445869. [DOI] [Google Scholar]
- 28.Darden T, York D, Pedersen L. Particle Mesh Ewald - an N Log(N) method for Ewald sums in large systems. J Chem Phys. 1993;98(12):10089–92. [Google Scholar]
- 29.Martyna GJ, Tobias DJ, Klein ML. Constant pressure molecular dynamics algorithms. J Chem Phys. 1994;101(5):4177–89. [Google Scholar]
- 30.Feller SE, Zhang Y, Pastor RW, Brooks BR. Constant pressure molecular dynamics simulation: the Langevin piston method. J Chem Phys. 1995;103(11):4613–21. [Google Scholar]
- 31.MacDermaid CM, Kashyap HK, DeVane RH, Shinoda W, Klauda JB, Klein ML, Fiorin G. Molecular dynamics simulations of cholesterol-rich membranes using a coarse-grained force field for cyclic alkanes. J Chem Phys. 2015;143(24):243144. Epub 2016/01/03. doi: 10.1063/1.4937153. [DOI] [PubMed] [Google Scholar]
- 32.Kumar S, Bouzida D, Swendsen RH, Kollman PA, Rosenberg JM. The Weighted Histogram Analysis Method for free-energy calculations on biomolecules .1. The method. J Comput Chem. 1992;13(8):1011–21. doi: DOI 10.1002/jcc.540130812. [DOI] [Google Scholar]
- 33.Humphrey W, Dalke A, Schulten K. VMD - Visual Molecular Dynamics. J Mol Graph. 1996;14:33–8. [DOI] [PubMed] [Google Scholar]
- 34.Vanommeslaeghe K, Hatcher E, Acharya C, Kundu S, Zhong S, Shim J, Darian E, Guvench O, Lopes P, Vorobyov I, MacKerell AD. CHARMM General Force Field: a force field for drug-like molecules compatible with the CHARMM all-atom additive biological force fields. J Comput Chem. 2010;31(4):671–90. doi: Doi 10.1002/Jcc.21367. [DOI] [PMC free article] [PubMed] [Google Scholar]
- 35.Laio A, Parrinello M. Escaping free-energy minima. P Natl Acad Sci USA. 2002;99(20):12562–6. doi: 10.1073/pnas.202427399. [DOI] [PMC free article] [PubMed] [Google Scholar]
- 36.Brandt EG, Braun AR, Sachs JN, Nagle JF, Edholm O. Interpretation of fluctuation spectra in lipid bilayer simulations. Biophys J. 2011;100(9):2104–11. doi: 10.1016/j.bpj.2011.03.010. [DOI] [PMC free article] [PubMed] [Google Scholar]
- 37.Kapoor R, Peyear TA, Koeppe RE 2nd, Andersen OS. Antidepressants are modifiers of lipid bilayer properties. The Journal of general physiology. 2019;151(3):342–56. Epub 2019/02/24. doi: 10.1085/jgp.201812263. [DOI] [PMC free article] [PubMed] [Google Scholar]
- 38.daCosta CJ, Dey L, Therien JP, Baenziger JE. A distinct mechanism for activating uncoupled nicotinic acetylcholine receptors. Nature chemical biology. 2013;9(11):701–7. Epub 2013/09/10. doi: 10.1038/nchembio.1338. [DOI] [PubMed] [Google Scholar]
- 39.Romero LO, Massey AE, Mata-Daboin AD, Sierra-Valdez FJ, Chauhan SC, Cordero-Morales JF, Vasquez V. Dietary fatty acids fine-tune Piezo1 mechanical response. Nature communications. 2019;10(1):1200. Epub 2019/03/15. doi: 10.1038/s41467-019-09055-7. [DOI] [PMC free article] [PubMed] [Google Scholar]
- 40.Caires R, Sierra-Valdez FJ, Millet JRM, Herwig JD, Roan E, Vasquez V, Cordero-Morales JF. Omega-3 fatty acids modulate TRPV4 function through plasma membrane remodeling. Cell reports. 2017;21(1):246–58. Epub 2017/10/06. doi: 10.1016/j.celrep.2017.09.029. [DOI] [PMC free article] [PubMed] [Google Scholar]
- 41.Pan JJ, Mills TT, Tristram-Nagle S, Nagle JF. Cholesterol perturbs lipid bilayers nonuniversally. Phys Rev Lett. 2008;100(19). [DOI] [PMC free article] [PubMed] [Google Scholar]
- 42.Henriksen J, Rowat AC, Brief E, Hsueh YW, Thewalt JL, Zuckermann MJ, Ipsen JH. Universal behavior of membranes with sterols. Biophys J. 2006;90(5):1639–49. doi: 10.1529/biophysj.105.067652. [DOI] [PMC free article] [PubMed] [Google Scholar]
- 43.Sorre B, Callan-Jones A, Manneville J-B, Nassoy P, Joanny J-F, Prost J, Goud B, Bassereau P. Curvature-driven lipid sorting needs proximity to a demixing point and is aided by proteins. Proceedings of the National Academy of Sciences. 2009;106(14):5622–6. [DOI] [PMC free article] [PubMed] [Google Scholar]
- 44.Hummer G, Rasaiah JC, Noworyta JP. Water conduction through the hydrophobic channel of a carbon nanotube. Nature. 2001;414(6860):188–90. doi: Doi 10.1038/35102535. [DOI] [PubMed] [Google Scholar]
- 45.Kucerka N, Tristram-Nagle S, Nagle JF. Structure of fully hydrated fluid phase lipid bilayers with monounsaturated chains. J Membr Biol. 2005;208(3):193–202. Epub 2006/04/11. doi: 10.1007/s00232-005-7006-8. [DOI] [PubMed] [Google Scholar]