

Abstract
RNA binding proteins (RBPs) are key arbiters of post-transcriptional regulation and are found to be found dysregulated in hematological malignancies. Here, we identify the RBP RBMX and its retrogene RBMXL1 to be required for murine and human myeloid leukemogenesis. RBMX/L1 are overexpressed in acute myeloid leukemia (AML) primary patients compared to healthy individuals, and RBMX/L1 loss delayed leukemia development. RBMX/L1 loss lead to significant changes in chromatin accessibility, as well as chromosomal breaks and gaps. We found that RBMX/L1 directly bind to mRNAs, affect transcription of multiple loci, including CBX5 (HP1α), and control the nascent transcription of the CBX5 locus. Forced CBX5 expression rescued the RBMX/L1 depletion effects on cell growth and apoptosis. Overall, we determine that RBMX/L1 control leukemia cell survival by regulating chromatin state through their downstream target CBX5. These findings identify a mechanism for RBPs directly promoting transcription and suggest RBMX/L1, as well as CBX5, as potential therapeutic targets in myeloid malignancies.
Main
Acute myeloid leukemia (AML) is an aggressive hematological malignancy characterized by uncontrolled expansion of poorly differentiated myeloid cells. Despite our increasing knowledge of the molecular basis underlying this disease, the five-year overall survival in adult AML is less than 20% and has only improved marginally in the last 30 years1, highlighting the need for better treatment strategies. Recently, RNA binding proteins (RBPs) have emerged as critical players in cancers, including hematological malignancies. Mutations and aberrant expression of RBPs have been found to contribute to leukemia development2. For example, elevated expression of the RBP MSI2 predicts poor prognosis and drives aggressive myeloid leukemia3–8. Despite their importance and therapeutic potential, only a small fraction of RNA regulators have been investigated in leukemia.
It is well established that RBPs bind to nascent RNA and regulate the intracellular fate of individual transcripts through a variety of post-transcriptional processes, including alternative splicing, nucleocytoplasmic transport, translation, and degradation. Interestingly, recent studies revealed that these RBP functions extend to transcription factors, such as RBM259, enzymes involved in DNA repair, including Ku80/XRCC510,11, and chromatin dynamic regulators, exemplified by PRC212. Many of these canonical and non-canonical RBPs are associated with chromatin and directly regulate transcription in leukemia cells9. Therefore, RBP functions in cancer go beyond the traditional framework of post-transcriptional regulation and remain largely unknown.
In order to discover RBP regulatory pathways in leukemia, we previously performed an in vivo pooled shRNA screen for 127 MSI2’s protein interactors and associated genes13. In this screen, the RBP RBMX (RNA binding motif protein, X-linked; also known as hnRNPG) was among the top hits, with four independent targeting shRNAs selectively depleted in the bone marrow (BM) of murine MLL-AF9 driven leukemia (Extended data Fig. 1a). RBMX contains one RNA-recognition motif (RRM), is ubiquitously expressed, and belongs to a gene family consisting of several RBMX-like retrogenes14. Among these, RBMXL1 is the only retrogene predicted to encode a functional protein, sharing 95% homology with RBMX at the protein level14,15. RBMX has previously been implicated in regulating alternative splicing, chromatid cohesion, and genome instability16–24. Several studies suggested that RBMX acts as a tumor suppressor in multiple solid cancers, including lung, endometrial, breast, and oral tumors18,25–30. Yet, its role in blood cancer remains unknown. In this study, we reveal that RBMX and RBMXL1 (RBMX/L1) are oncogenic regulators of human and mouse leukemia. We determine that RBMX/L1 control leukemia cell survival by regulating the chromatin state through their downstream target CBX5 (also known as HP1α [heterochromatin protein 1 alpha]).
Results
Rbmx is required for murine leukemia maintenance
To further evaluate the effects of RBMX depletion in leukemia initially observed with our in vivo shRNA screen, we performed shRNA knockdown of RBMX in murine MLL-AF9 leukemia cells. We found a reduction in myeloid colony formation and a significant increase in colony myeloid differentiation (Fig. 1a–c and Extended data Fig. 1b,c). RBMX depletion also led to increased apoptosis, indicating the requirement of RBMX for leukemia cell survival (Fig. 1d and Extended data Fig. 1d). Notably, while RBMX knockdown substantially reduced colony formation in MLL-AF9 leukemia cells, it did not affect the colony forming ability of normal hematopoietic stem and progenitor c-Kit+ BM cells (Fig. 1e and Extended data Fig. 1e–f). These results suggest a differential effect of RBMX loss in leukemia versus normal hematopoietic cells. RBMX requirement was not restricted to MLL-AF9 leukemia, as we observed similar effects on colony reduction of AML1-ETO9a leukemia cells upon RBMX knockdown with one shRNA, correlating with the extent of knockdown (Extended data Fig. 1g,h). Overall, our data supports that RBMX maintains leukemia cell survival in vitro.
Figure 1. RBMX is required for murine leukemia maintenance in vitro and in vivo.
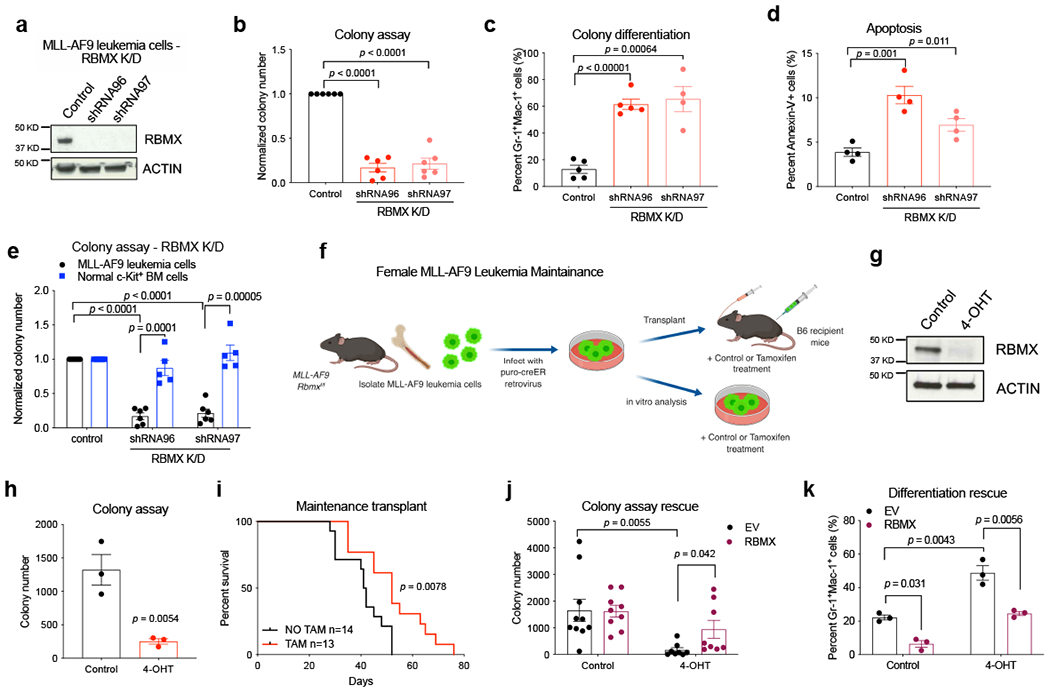
(a) Immunoblot showing knockdown of RBMX in mouse MLL-AF9 bone marrow (BM) leukemia cells. The experiment was performed 3 times with similar results.
(b) Colony formation assay in RBMX-knockdown mouse MLL-AF9 leukemia cells. Number of colonies was normalized to that of control MLL-AF9 leukemia cells. n = 6 independent experiments.
(c) Quantitative FACS analysis summary of myeloid differentiation markers in control and RBMX-knockdown MLL-AF9 leukemia cells. Control and shRNA96: n = 5 independent experiments, shRNA97: n = 4 independent experiments.
(d) Quantitative summary of FACS analysis of apoptotic (Annexin V+) cells in control and RBMX-knockdown MLL-AF9 leukemia cells 5 days post transduction. n = 4 independent experiments.
(e) Colony formation assay in normal c-Kit BM cells, n = 5 independent experiments, and MLL-AF9 leukemia cells, n = 6 independent experiments.
(f) Experimental scheme for investigating the role of RBMX in leukemia maintenance in vitro and in vivo by generating inducible MLL-AF9 Rbmxf/f Cre-ER cells.
(g) Immunoblot showing depletion of RBMX after 24 hours of 200nM 4-OHT (TAM) treatment. The experiment was performed 3 times with similar results.
(h) Colony formation assay in MLL-AF9 Rbmxf/f Cre-ER cells treated with 4-OHT. n = 3 independent experiments.
(i) Kaplan-Meier analysis of leukemia maintenance survival of mice injected with MLL-AF9 Rbmxf/f Cre-ER cells with or without TAM treatment. NO TAM: n = 14 mice, TAM: n = 13 mice; two-sided Mantel-Cox test.
(j) Colony formation assay in control and MLL-AF9 Rbmxf/f Cre-ER cells depleted of endogenous RBMX and overexpressing ectopic human RBMX-FLAG. EV control: n = 10, RBMX control: n = 9, EV 4-OHT: n = 7, RBMX 4-OHT: n = 8, independent experiments.
(k) Quantitative summary of FACS analysis of Gr-1+Mac-1+ cells in control and MLL-AF9 Rbmxf/f Cre-ER cells depleted of endogenous RBMX and overexpressing ectopic human RBMX-FLAG. n = 3 independent experiments.
Data presented in b, c, d, h, j, and k as mean +/− s.e.m. p value determined by two-tailed Student’s t test for all experiments in this figure, unless stated otherwise.
We next wanted to assess the functional requirement of RBMX in leukemia initiation and maintenance in vivo. To this end, we utilized the previously developed Rbmx conditional knockout mice containing two LoxP sites flanking exon 4 of Rbmx (female Rbmxf/f or male Rbmxf) (Extended data Fig. 1i). We crossed these mice with mice carrying an Mx1-Cre locus in order to generate the female RbmxΔ/Δ or male RbmxΔ genotypes within the hematopoietic compartment upon treatment with polyinositol-polycytosine (pIpC). We confirmed Rbmx deletion in RbmxΔ/Δ and RbmxΔ BM cells three weeks post pIpC treatment by genotyping PCR and qRT-PCR (Extended data Fig. 1j,k). Importantly, since Rbmx is located on the X chromosome, we decided to gender stratify our studies.
In order to evaluate if RBMX is essential for MLL-AF9-mediated leukemogenesis, we transformed female RBMX wildtype (Rbmxf/f) and primary knockout (RbmxΔ/Δ) hematopoietic stem and progenitor cells (HSPCs) with the MLL-AF9 fusion oncogene and transplanted them into lethally irradiated mice (Extended data Fig. 1l). MLL-AF9 transformed cells from Rbmx knockout donor mice showed no delay in leukemia development nor any difference in disease burden compared to cells from wildtype donors (Extended data Fig. 1m,n). Similarly, deletion of Rbmx in male animals did not result in a delay in leukemia development (Extended data Fig. 1o,p).
We next evaluated the role of RBMX in leukemia maintenance in vitro and in vivo by transducing MLL-AF9 Rbmxf/f cells with a retrovirus expressing puromycin tamoxifen-controlled Cre recombinase (Cre-ER) (Fig. 1f). Acute reduction of RBMX protein in these established leukemia cells was verified 24 hours after 4-hydroxytamoxifen (4-OHT) treatment, which resulted in significantly reduced colony formation (Fig. 1g,h). Furthermore, leukemic Rbmxf/f Cre-ER mice treated with tamoxifen demonstrated significantly delayed leukemogenesis in vivo (Fig. 1i). The effects of acute deletion of RBMX could be rescued with forced ectopic RBMX expression (Fig. 1j, k and Extended data Fig. 1q,r). Together, these results suggest that RBMX is required for leukemia maintenance but dispensable for the disease initiation.
Retrogene Rbmxl1 compensates for Rbmx loss
To determine if RBMX depletion was maintained in the initiation and maintenance experiments, we sorted leukemia cells from the moribund animals and performed immunoblot analysis. We observed an equivalent RBMX protein abundance in mice transplanted with Rbmx deleted leukemia cells as with wildtype control cells (Fig. 2a,b). Since RBMX and its retrogene RBMXL1 share 95% protein homology and are indistinguishable by commercial RBMX antibodies by immunoblotting, we hypothesized that the RBMX protein depletion could be masked by Rbmxl1 expression. In order to distinguish between Rbmx and Rbmxl1 expression in the BM of the recipient mice, we performed qRT-PCR and found complete deletion of Rbmx and detectable Rbmxl1 expression in the Rbmx deleted leukemia cells compared to the control cells (Fig. 2c–e). These results imply that the detected protein in the immunoblot analysis of Rbmx deleted leukemia cells is RBMXL1 and not RBMX.
Figure 2. Retrogene Rbmxl1 is functionally redundant with Rbmx in leukemia maintenance in vitro and in vivo.

(a) Immunoblot analysis with RBMX/L1 protein abundance in leukemic BM cells isolated from Rbmxf/f mice and RBMXL1 from RbmxΔ/Δ mice that succumbed to leukemia in Extended data Fig. 1n and p. The experiment was performed once.
(b) Immunoblot analysis with RBMX/L1 in leukemic BM cells isolated from mice untreated with TAM and RBMXL1 from mice treated with TAM that succumbed to disease in Fig. 1h. The experiment was performed once.
(c-e) qRT-PCR showing efficient Rbmx deletion and detectable Rbmxl1 expression in leukemic BM cells isolated from (c) female mice (Extended data Fig. 1n), (d) male mice that succumbed to disease in leukemia initiation experiment (Extended data Fig. 1p), and (e) mice that succumbed to disease in leukemia maintenance experiment (Fig. 1h). Rbmxf/f: n = 8, RbmxΔ/Δ: n = 8, Rbmxf: n = 6, RbmxΔ: n = 6, NO TAM: n = 10, TAM: n = 7 mice.
(f) Experimental scheme for RBMXL1 depletion using Rbmxl1-specific shRNAs in leukemic RbmxΔ/Δ cells.
(g) Immunoblot analysis showing knockdown of RBMXL1 in leukemic RbmxΔ/Δ cells 4 days post transduction. The experiment was performed 3 times with similar results.
(h) qRT-PCR showing depletion of Rbmxl1 in leukemic RbmxΔ/Δ cells 4 days post transduction. Control and shRNA932: n = 3, shRNA587: n = 4 independent experiments.
(i) Colony formation assay in RBMXL1 depleted and control leukemic RbmxΔ/Δ cells. Number of colonies was normalized to that of the control. n = 3 independent experiments.
(j) Quantitative summary of FACS analysis showing myeloid differentiation (Gr-1 and Mac-1) in leukemic RbmxΔ/Δ colonies upon RBMXL1 depletion. Control: n = 5, shRNA587, shRNA932: n = 4 independent experiments.
(k) Quantitative summary of FACS analysis of apoptotic cells in control and RBMX-knockdown leukemic RbmxΔ/Δ cells 5 days post transduction. n = 3 independent experiments.
(l) Kaplan-Meier survival analysis of mice injected with control or RBMXL1-knockdown leukemic RbmxΔ/Δ cells. Control: n = 13, shRNA587: n = 10, shRNA932: n = 10 mice; two-sided Mantel-Cox test.
Data presented in c-e and h-k as mean +/− s.e.m. p value determined by two-tailed Student’s t test for all experiments in this figure, unless stated otherwise.
Notably, we also detected RBMXL1 protein in RbmxΔ/Δ and RbmxΔ BM cells three weeks post pIpC treatment (Extended data Fig. 2a). However, we did not detect RBMXL1 protein signal in murine MLL-AF9 leukemia cells four days after RBMX depletion (Fig. 1a) and in leukemic Rbmxf/f Cre-ER cells 24 hours after 4-OHT treatment (Fig. 1f). We performed qRT-PCR in these cells and found that while Rbmx mRNA was depleted, Rbmxl1 expression was detected in the RBMX depleted cells at an equivalent level as in the control cells (Extended data Fig. 2b,c). These data suggest that RBMXL1 protein abundance increases after a longer period of time of RBMX loss (in RbmxΔ/Δ and RbmxΔ BM cells three weeks post pIpC treatment and in the MLL-AF9 leukemia transplant setting) and not upon acute RBMX depletion. Taken together, these data indicate that RBMXL1 can compensate for RBMX loss and that both RBMX and RBMXL1 could contribute to leukemia development and maintenance.
To test the functional redundancy of RBMXL1, we depleted RBMXL1 in Rbmx deficient leukemia cells (Fig. 2f). This resulted in a significant reduction in colony formation, increased colony myeloid differentiation, and induction of apoptosis in cells deficient for both RBMXL1 and RBMX compared to those only depleted of RBMX (Fig. 2g–k and Extended data Fig. 2d–f). Correspondingly, RBMXL1 depletion in Rbmx deficient leukemia cells resulted in significantly delayed leukemogenesis in vivo without reduced disease burden (Fig. 2l and Extended data Fig. 2g). The mice that succumbed to leukemia had various levels of RBMXL1 depletion, suggesting that some leukemia cells may select against total RBMXL1 loss (Extended data Fig. 2h). Overall, these data indicate that RBMXL1 compensates for Rbmx deletion in vitro and in vivo and may explain why we observed no significant delay in leukemia initiation solely upon Rbmx deletion.
RBMX and RBMXL1 promotes human leukemogenesis
To understand the role of RBMX and RBMXL1 in normal human hematopoietic and leukemia cells, we first surveyed multiple published cancer expression datasets. We found that RBMX mRNA was expressed the highest in AML compared to other types of cancer (Fig. 3a). While RBMX expression was elevated in patients with AML subtypes of different chromosomal translocations compared to normal HSPCs (Fig. 3b), RBMX expression was significantly higher in AML subtypes positive for NPM1 mutation and FLT3-ITD mutation compared to those without these mutations (Extended data Fig. 3a). In AML, the leukemic stem cell population (LSC+) expressed significantly higher RBMX levels compared to the non-LSC population (LSC−) (Extended data Fig. 3b)31. Our database survey also found that RBMX may play a role in CML progression and maintenance, as RBMX expression is increased in CML chronic phase compared to accelerated phase. RBMX expression was further increased in blast crisis (Fig. 3c)32. To further determine the abundance of RBMX/L1 in myeloid leukemia, we examined RBMX and RBMXL1 mRNA and protein levels across multiple human myeloid leukemia cell lines, including AML and CML, in comparison to normal HSPCs derived from cord blood (CB-CD34+). RBMX/L1 mRNA and protein were more abundant in myeloid leukemia cell lines (Fig. 3d and Extended data Fig. 3c,d). Importantly, we observed higher RBMX/L1 expression in 7 out of 13 AML primary patient samples compared to normal CB-CD34+ HSPCs, normal peripheral blood (PB), BM, and aged-BM (Fig. 3e and Supplementary Table 1).
Figure 3. RBMX and RBMXL1 are overexpressed in myeloid leukemia.

(a)RBMX mRNA expression in AML compared to other cancers, on the basis of data from The Cancer Genome Atlas (TCGA) database. Data are presented as mean log2 expression with range. AML, pink dots. Ordinary one-way ANOVA test with multiple comparisons.
(b) Graph shows that RBMX is elevated in samples from patients with AML as compared to normal HSPCs. AML: n = 48, AML t(15;17): n = 54, AML inv(16)/t(16;16): n = 47, AML t(8;21): n = 60, AML t(11q23)/MLL: n = 43 patients. HSC: n = 6, GMP: n = 7, MEP: n = 4 healthy individuals (Bloodspot data of RBMX probe 1556336_at from the U133 Plus 2.0 array). Data as mean +/− s.e.m, two-tailed Student’s t test.
(c)RBMX mRNA expression in different phases of chronic myeloid leukemia (CML), on the basis of data from ONCOMINE database (Radich dataset). CP: n = 42, AP: n = 15, BC: n = 36 CML patients. Data are presented in arbitrary unit, mean +/− s.e.m, two-tailed Student’s t test.
(d) Immunoblot and band densitometry showing RBMX and RBMXL1 protein abundance in multiple human myeloid cells lines compared to normal HSPCs. The experiment was performed twice with similar results.
(e) Two immunoblots (from two separate runs) measuring RBMX/L1 protein abundance in healthy CB-CD34+ cells, primary AML patient samples, healthy peripheral blood (PB), healthy BM cells, and aged (>60 years old) BM (Aged-BM). CB-CD34+ (1), (2), and (3) samples were pooled from 10, 4, and 5 individuals, respectively. PB, BM, and Aged-BM sample were each pooled from 3 individuals. Each AML patient sample represents one individual. Band densitometry presented below each blot, with blast percentage indicated above each bar.
To define the role of RBMX and related genes in human AML cells, we surveyed the previously published genome-wide CRISPR-based screen data of 14 AML cell lines for RBMX, RBMXL1, its other retrogenes (RBMXL2 and RBMXL3), and its paralog RBMY1A133. We found RBMX to be among the most depleted genes in the genome (Extended data Fig. 3e,f). To expand on this study, we depleted both RBMX and RBMXL1 in three human AML cell lines (MOLM13, THP-1, and Kasumi-1) and two CML blast crisis cell lines (KCL-22 and K562) using two independent shRNAs that targeted both transcripts. Depletion of both proteins in these cell lines reduced proliferation, increased myeloid differentiation, and significantly induced apoptosis (Fig. 4a–p and Extended data Fig. 4a–d).
Figure 4. RBMX and RBMXL1 promote human leukemogenesis.

(a-e) Immunoblot showing RBMX and RBMXL1 knockdown in MOLM13, THP-1, Kasumi-1, KCL-22, and K562 cells. The experiment was performed 3 times for each cell line with similar results.
(f-j) Proliferation assay upon RBMX/L1 depletion in indicated cell line. MOLM13 Control and shRNA2: n = 5, shRNA1: n = 4; THP-1: n = 4; Kasumi-1: n = 4; KCL-22: n = 7; and K562: n = 3 independent experiments.
(k-o) Quantitative FACS summary of differentiation markers upon RBMX/L1 depletion in indicated cell line. MOLM13 Control and shRNA2: n = 6, shRNA1: n = 4; THP-1: n = 6; Kasumi-1: n = 4; KCL-22: n = 5; and K562: n = 4 independent experiments.
(p) Quantitative FACS summary of apoptotic cell death in indicated RBMX/L1-depleted cell line. MOLM13 Control: n = 5, shRNA1: n = 3, shRNA2: n = 4; THP-1: n = 6; Kasumi-1: n = 4; KCL-22 Control and shRNA1: n = 6, shRNA2: n = 5; and K562 Control: n = 4; shRNA1 and shRNA2: n = 3 independent experiments.
(q) Kaplan-Meier analysis of NSG mice injected with MOLM13 cells transduced with RBMX/L1-specific shRNAs or control. Control: n = 8, shRNA1: n = 9, shRNA2: n = 10 mice; two-sided Mantel-Cox test.
(r-s) Kaplan-Meier analysis in NSG mice injected with patient-derived xenograft (PDX) cells (patient AML-1 and patient AML-13 from Fig. 3e) transduced with RBMX/L1-specific shRNAs or control. PDX AML-1 Control: n = 3, shRNA1: n = 3, shRNA2: n = 3 mice. PDX AML-13 Control: n = 5, shRNA1: n = 4, shRNA2: n = 3 mice; two-sided Mantel-Cox test.
(t) RBMX/L1 depletion resulted in decreased engraftment potential of PDX AML-11 (Fig. 3e). Quantitative FACS summary of indicated human CD45 marker and GFP (marker of shRNA expression vector). Control: n = 6, shRNA1: n = 4, shRNA2: n = 5 mice.
Data presented in f-p and t as mean +/− s.e.m. p value determined by two-tailed Student’s t test for all experiments in this figure, unless stated otherwise.
To confirm that the effect of shRNA-mediated knockdown was on-target, we expressed a shRNA-resistant form of RBMX in leukemia cells. This reintroduction of RBMX was sufficient to significantly rescue both the proliferation and apoptotic phenotypes resulting from endogenous RBMX/L1 depletion (Extended data Fig. 4e–g). As further evidence, we used an independent approach to deplete RBMX/L1 in MOLM13 cells by generating CRISPR-Cas9-mediated mutation of RBMX/L1 using two independent single guide RNAs (sgRNAs). Consistent with the shRNA knockdown of RBMX/L1 experiments, sgRNA-mediated RBMX/L1 knockdown led to reduced cell proliferation, increased differentiation, and induction of apoptosis (Extended data Fig. 4h–k). Overall, data from the genome-wide CRISPR-based screen as well as our data from the shRNA depletion and CRISPR-Cas9 deletion experiments suggest the requirement of RBMX/L1 for leukemia cell survival among a diverse set of oncogenic drivers.
To determine whether RBMX/L1 are required for human leukemogenesis in vivo, we transplanted RBMX/L1 depleted MOLM13 cells into immunodeficient recipient NSG mice. While all mice transplanted with scramble-shRNA leukemic cells (Control) succumbed to the disease with a median latency of 51.5 days, only 3 out of 20 mice transplanted with RBMX/L1-shRNA leukemic cells developed leukemia (Fig. 4q). We next knocked down RBMX/L1 expression in patient-derived xenografts (PDX) derived from three AML patients (AML-1, AML-11, and AML-13, Fig. 3e) with high RBMX/L1 expression. We verified RBMX/L1 depletion in the transduced PDX cells before transplanting into recipient NSG mice (Extended data Fig. 4l–n). Depletion of RBMX/L1 resulted in significantly delayed leukemogenesis of PDX AML-1 cells, inhibited the ability to develop leukemia of PDX AML-13 cells, and prevented engraftment potential of PDX AML-11 cells (Fig. 4r–t and Extended data Fig. 4o). We found that RBMX/L1 expression was maintained when the recipient mice died of leukemia, indicating that there was an outgrowth of primary leukemia cells with RBMX/L1 expression (Extended data Fig. 4p).
Since RBMX loss in murine leukemia cells compared to normal c-Kit+ hematopoietic cells led to a differential effect, we next wanted to understand if there is also a differential requirement for RBMX/L1 function in human leukemia cells compared to normal HSPCs. We depleted RBMX/L1 in CB-CD34+ HSPCs and found a reduction in colony-forming units (CFUs) in all lineages and an increase in myeloid differentiation but no change in apoptosis (Fig. 5a–d and Extended data Fig. 4q). RBMX overexpression in CB-CD34+ HSPCs led to reduced differentiation, as demonstrated by decreased CFU-GM and CFU-E colony numbers and decreased myeloid differentiation markers (Fig. 5e–h and Extended data Fig. 4r–s). Notably, RBMX overexpression did not affect HSPC cell proliferation (Fig. 5i). These data suggest that high levels of RBMX suppress HSPC differentiation potential, supporting the role of RBMX in the leukemia cell differentiation state. While RBMX overexpression did not affect cell growth in HSPCs, we speculate that its elevated levels in pre-leukemic cells might cooperate with other dysregulated factors to promote cell proliferation. Taken together, our results demonstrate that human leukemia cells are dependent on RBMX/L1 for their survival and suggest a specific requirement for both proteins in myeloid leukemia cells compared to normal HSPCs.
Figure 5. RBMX and RBMXL1 differentially regulate human HSPCs.

(a) Immunoblot showing RBMX/L1 knockdown in CB-CD34+ cells. The experiment was performed 3 times with similar results.
(b) Colony formation for cells from a. n = 3 independent experiments.
(c) Quantitative FACS summary of CD33 and CD11b for cells from a after 2 days in myeloid differentiating media. n = 4, independent experiments.
(d) Quantitative FACS analysis for apoptosis in CB-CD34+ cells. n = 6 independent experiments for day 4; n = 3 independent experiments for day 5.
(e) Immunoblot showing CB-CD34+ cells overexpressing RBMX (RBMX-R2) compared to control (EV). The experiment was performed 3 times with similar results.
(f) Colony formation assay for cells in e. n = 3 independent experiments.
(g-h) Quantitative FACS analysis summary showing CD33+ CD11b+ population, n = 6 independent experiments, and CD34+ CD38− population, n = 6 independent experiments, for cells from e at day 7 in myeloid differentiation promoting media.
(i) Proliferation assay for cells from e. n = 3 independent experiments.
Data presented in b-d and f-h as mean +/− s.e.m. p value determined by two-tailed Student’s t test for all experiments in this figure, unless stated otherwise.
RBMX/L1 loss results in dysregulated chromatin compaction
We next investigated the mechanism(s) underlying RBMX/L1’s function in leukemia. Since RBMX was identified through our initial MSI2-interactome screen, we first examined its relationship to the MSI2 program. We observed that MSI2’s canonical targets HOXA9 and MYC were unaffected upon RBMX/L1 depletion (Extended data Fig. 5a)7. Since previous studies identified RBMX roles in chromosome biology and other nuclear processes16–22, we next evaluated whether RBMX/L1 are more highly expressed in the chromatin fraction compared to the cytoplasmic fraction of AML cells. We performed cellular fractionation in MOLM13 cells and observed that RBMX/L1 are predominantly present in the chromatin-bound fraction (Fig. 6a). As MSI2 primarily functions as a cytoplasmic translational regulator6,7, these data further suggest that MSI2 and RBMX are functioning independently in leukemia cells.
Figure 6. RBMX and RBMXL1 regulate the chromatin state in leukemia cells.

(a) Immunoblot analysis showing that RBMX and RBMXL1 are predominantly localized in the chromatin-bound fraction. The experiment was performed once. GAPDH: cytoplasmic fraction loading control. Histone H3: chromatin-bound fraction loading control.
(b) Complex karyotyping of cells depleted of RBMX/L1 and control 3 days post transduction. The experiment was performed 5 times with similar results, 450 images collected.
(c) Quantitative summary of complex karyotyping of b. Control and shRNA1: n = 5, shRNA2: n = 3 independent experiments. Data as mean +/− s.e.m, two-tailed Student’s t test.
(d) ATAC-sequencing identified major changes in chromatin state in RBMX/L1-knockdown cells compared to control 3 days after transduction. Significant changes (peaks) determined by two-tailed Student’s t test, q-value < 0.05. n = 3 independent experiments.
(e) Heatmap of all pericentric and telomeric heterochromatin peaks from the ATAC-sequencing in d. n = 3 independent experiments.
(f) Representative tracks of the ATAC-sequencing in d with increased and decreased compaction at pericentric heterochromatin.
Loss of RBMX has previously been reported to cause premature chromatid separation and chromosome segregation defects in HeLa cells16,34. In order to evaluate the impact of RBMX/L1 loss on chromosome structure in AML cells, we performed complex chromosomal karyotyping three days after RBMX/L1 depletion. Instead of chromosomal segregation defects, our karyotyping analysis revealed a significant increase in irregular chromatin compaction and metaphases with breaks and gaps in RBMX/L1 deficient cells (Fig. 6b,c). To more precisely map how RBMX/L1 alters chromatin state, we performed an assay for transposase-accessible chromatin (ATAC) sequencing in MOLM13 cells three days after RBMX/L1 knockdown. Loss of RBMX/L1 led to a significant genome-wide reorganization of chromatin compaction, with 2,633 regions gaining accessibility and 2,052 regions losing accessibility (Fig. 6d, Extended data Fig. 5b, and Supplementary Table 2).
Since heterochromatin plays a pivotal role in genome packaging and highly-ordered chromatin structures, we looked further into chromatin accessibility in pericentric and telomeric heterochromatin. Consistent with the genome-wide results, we found significant redistribution of heterochromatin compaction (503 regions gaining accessibility and 381 regions losing accessibility; Fig. 6e,f and Extended data Fig. 5c). Most changes in chromatin compaction occurred at the promoter, distal intergenic, and intronic regions (Extended data Fig. 5d,e). Functional enrichment analysis found that genes with increased accessibility showed the most significant enrichment for chromatin binding, suggesting that additional chromatin functions are dependent on RBMX/L1 (Supplementary Table 3,4). Overall, our ATAC-seq and karyotyping data suggest that RBMX/L1 loss alters chromatin compaction and structure in AML cells.
RBMX/L1 directly bind to CBX5 (HP1α) transcripts
To understand how the aberration in chromatin compaction could result from RBMX/L1 depletion, we performed RNA-sequencing on MOLM13 cells two days after RBMX/L1 knockdown, a timepoint prior to our observed chromatin compaction changes. We found 70 genes significantly downregulated (log2 [fold change] < 1, FDR < 0.02) and 29 significantly upregulated (log2 [fold change] > 1, FDR < 0.02; Extended data Fig. 5f and Supplementary Table 5,6). In contrast to previous studies, we observed that the gene expression changes were not due to splicing defects (Extended data Fig. 5g and Supplementary Table 7–11)17–22. To determine if these differentially expressed genes were the result of direct RBMX/L1 binding, we overlapped RBMX/L1 PAR-CLIP data22 with our RNA-sequencing data (Supplementary Table 12–14). Our analysis revealed that RBMX/L1 directly binds and affects the mRNA levels of 11 genes (Fig. 7a and Extended data Fig. 5h). We performed RNA-IP on MOLM13 cells expressing RBMX-Flag and validated that RBMX binds to 10 out of these 11 genes (Extended data Fig. 5i). To assess the clinical relevance of RBMX/L1 in leukemia, we examined the overall survival of AML patients in the TCGA database, stratified by RBMX direct down-regulated targets that were validated by PAR-CLIP, RNA-IP, and RNA-sequencing (CBX5, CBS, DACH1, SEPT11, UNG, XBP1, PABPC4, and SLC38A1). Our analysis determined that the RBMX/L1 direct pathway signature predicts significantly worse outcomes in AML (Extended data Fig. 5j). Previous studies have linked mutations and aberrant expression of most of these RBMX/L1 direct targets to leukemia35–46. Since DACH1, CBX5, CBS, and SEPT11 were found to be functionally important in AML and/or associated with chromatin, we validated these targets to have reduced protein abundance upon RBMX/L1 depletion in MOLM13 cells (Extended data Fig. 6a).
Figure 7. RBMX/L1 directly bind to CBX5 transcripts.

(a) Venn diagram showing overlap between genes differentially expressed after RBMX/L1 depletion (RNA-seq) and genes bound by RBMX/L1 (PAR-CLIP)22.
(b) RNA-sequencing and PAR-CLIP profiles of CBX5 transcript; arrows mark two significant RBMX enrichment sites at the start of intron 1 and in the 3’UTR.
(c) Downregulated steady state CBX5 mRNA expression upon RBMX/L1 depletion in cells 2 days post transduction. n = 3 independent experiments.
(d) Experimental scheme depicting nascent mRNA capture protocol.
(e) Downregulated nascent CBX5 mRNA expression upon RBMX/L1 depletion in cells 2 days post transduction. Control and shRNA1: n = 6, shRNA2: n = 5 independent experiments.
(f) Representative smFISH images of cells 2 days after RBMX/L1 depletion. Pre-mature and mature full-length CBX5 mRNA/cell measured by CBX5–3UTR probes and nascent transcript abundance measured by CBX5-Intron1 probes. The experiment was performed twice with similar results.
(g-h) Quantitative summary of smFISH number of CBX5-3UTR foci per cell and number of CBX5-Intron1 foci per cell. Control: n = 433, shRNA1: n = 271, shRNA2: n = 362 cells.
(i) Diagram of full-length RBMX and RBMX mutants used in luciferase reporter assay.
(j) Diagram of vector used in luciferase reporter assay.
(k) Luciferase reporter assay, using the original intron 1 or the mutated CBX5 intron 1, with different RBMX mutants. EV CBX5 and RBMX CBX5: n = 15, ΔSRR EV ΔCBX5: n = 6, RBMX ΔCBX5: n = 5, ΔRRM CBX5: n = 7, ΔRRM ΔCBX5: n = 3, ΔSRR CBX5: n = 7, ΔSRR ΔCBX5: n = 3, ΔTRR CBX5 n = 6, ΔTRR ΔCBX5 n = 7, ΔRBD CBX5 and ΔRBD ΔCBX5: n = 6, RGG mutant CBX5 and RGG mutant ΔCBX5: n = 7 independent experiments.
Data presented in c, e, g-h, and k as mean +/− s.e.m. p value determined by wo-tailed Student’s t test, unless stated otherwise.
To understand the basis for how RBMX/L1 loss results in substantial changes to the organization and integrity of chromatin, including pericentric and telomeric heterochromatin, we examined the direct targets that were validated by immunoblot analysis. Of these genes, CBX5, also called HP1–, is known to be a structural component of heterochromatin and regulator of chromatin compaction (Supplementary Table 15) CBX5 binds H3K9me3 histone marks to promote heterochromatin formation, which is pivotal for chromatin compaction and chromatin segregation47–50. Furthermore, CBX5 has been implicated in myeloid leukemia with increased expression in high (c-Kithigh) versus low (c-Kitlow) leukemia stem cell populations. Additionally, CBX5 depletion reduced murine MLL-AF9 myeloid leukemia cell colony formation35. RBMX/L1 PAR-CLIP analysis identified RBMX/L1 binding to two CBX5 transcript regions: CBX5 3’UTR and the beginning of CBX5 intron 1 (Fig. 7b). Moreover, we confirmed that RBMX/L1 depletion reduced CBX5 mRNA and protein abundance in both human and mouse AML cells (Fig. 7c and Extended data Fig. 6a–e). Taken together, these data suggest that RBMX/L1 could promote proper chromatin compaction through its direct regulation of CBX5.
CBX5 is a functional target of RBMX/L1 in leukemia cells
As RBPs are known to control post-transcriptional regulation, we then investigated the possible mechanisms for how RBMX/L1 affect CBX5 transcript abundance. Consistent with our finding that global splicing was not altered, we found that the RNA levels of all CBX5 exons and exon-exon junctions were reduced to a similar extent, indicating that CBX5 mRNA expression downregulation could not be explained by alternative splicing (Extended data Fig. 6f). Another post-transcriptional regulatory mechanism is mRNA stability control, but CBX5 mRNA levels in RBMX/L1-depleted cells had equivalent half-lives as the control cells (Extended data Fig. 6g). As our findings established that RBMX/L1 did not regulate CBX5 post-transcriptionally, we next determined if RBMX/L1 altered the transcriptional activity of CBX5. RBMX/L1 loss resulted in reduced nascent transcription of the CBX5 locus, as measured by the Click-iT EU nascent RNA capturing method (Fig. 7d,e). Interestingly, this decreased transcription effect was also observed with at least six of the other RBMX/L1 direct target genes (Extended data Fig. 6h). Taken together, these data suggest that RBMX/L1 directly control the transcription of their direct targets, including the CBX5 locus.
Given the effect of RBMX/L1 on CBX5 nascent transcription, we then performed single molecule RNA fluorescence in situ hybridization (smFISH) to understand how RBMX/L1 depletion influenced transcription kinetics at the CBX5 locus51. We employed this technique as smFISH captures the population heterogeneity of mRNA expression at single molecule sensitivity and facilitates the direct observation of the transcriptional activity through the visualization of active transcription sites52,53. Using this technique, we detected CBX5 with an average of 15 mRNAs/cell. RBMX/L1 depletion led to statistically significant reduction in CBX5 mRNA/cell (Fig. 6f,g). We also analyzed the number of copies and signal intensity of the first CBX5 intron, the putative binding site for RBMX/L1, as a readout of transcriptional burst size at active transcription sites53–56. RBMX/L1 depletion led to a significant decrease in the copy number and signal intensity compared to control (Fig. 7h and Extended data Fig. 6i). Altogether, these data suggest that RBMX/L1 have a direct effect on the transcription rates of CBX5.
To understand the functional interaction of RBMX/L1 with CBX5 transcripts, we utilized a luciferase reporter assay. We hypothesized that the reduced nascent transcription of CBX5 was likely due to binding of RBMX/L1 to intron 1 of CBX5 and not to the 3’UTR, as we observed an effect on CBX5 transcription but no defect in CBX5 mRNA stability upon RBMX/L1 depletion. Thus, we performed a luciferase reporter assay using the intron 1 region identified in the PAR-CLIP data. RBMX overexpression increased luciferase signal, and this increased signal was dependent on RBMX/L1 binding, as deletion of the intron 1 binding sites abrogated this effect (Fig. 7i–k). Notably, nascent RNA capture analysis of the luciferase reporter demonstrated a significant increase in absolute number of CBX5-Intron 1 and Renilla luciferase (Rluc) transcripts upon RBMX overexpression, indicating that our assay recapitulated the regulation of endogenous CBX5 (Extended data Fig. 6j).
To determine the RBMX domain responsible for this binding, we tested a series of RBMX mutants. RBMX is composed of an N-terminal RRM, followed by a low complexity region of ~300 amino acids. Low complexity regions are known to facilitate phase-separation, an extreme form of local high-concentration hubs that are important for various RBP molecular functions57–62. RBMX’s low complexity region consists of a serine and arginine-rich region (SRR) followed by a tyrosine-rich region (TRR). The TRR contains a highly conserved C-terminal RNA binding domain (RBD) of 58 amino acids, which includes three RGG repeats16,63. In contrast to the deletion of the RRM, deletion of the low complexity region resulted in decreased luciferase activity, indicating it was required for regulating CBX5 expression (Fig. 7i–k).
We next hypothesized that if CBX5 is a functional downstream target of RBMX/L1, then CBX5 depletion should phenocopy RBMX/L1 loss in leukemia cells. Upon CBX5 depletion, we detected a reduction in cell proliferation and induction of apoptosis in MOLM13 cells, similar to the phenotypes observed upon loss of RBMX/L1 (Fig. 8a–c and Extended data Fig. 6k). In contrast to RBMX/L1 loss, we observed no effect on myeloid differentiation upon CBX5 depletion (Fig. 8d). Consistent with this observation, forced expression of CBX5 was sufficient to reverse the effects on proliferation and apoptosis but not myeloid differentiation after RBMX/L1 depletion (Fig. 8e–i and Extended data Fig. 6l–m).
Figure 8. RBMX/L1 acts through direct regulation of CBX5 transcription.

(a) Immunoblot showing CBX5 depletion in MOLM13 cells. The experiment was performed 3 times with similar results.
(b) Proliferation assay of cells from a. n = 4 independent experiments.
(c) Quantitative apoptosis analysis summary of cells from a. n = 4 independent experiments.
(d) Quantitative FACS summary of CD11b and CD33 of cells from a. n = 4 independent experiments.
(e) Immunoblots of RBMX/L1, endogenous CBX5, and CBX5-Flag in RBMX/L1 depleted MOLM13 cells expressing CBX5-Flag. The experiment was performed 5 times with similar results.
(f) Proliferation assay of cells from e. n = 5 independent experiments.
(g) Quantitative apoptosis analysis summary of cells from e. n = 4 independent experiments.
(h-i) Quantitative FACS summary of CD11b (h) and CD33 (i) of cells from e. n = 5 independent experiments.
(j)CBX5 mRNA levels in high versus low RBMX expressing AML patients (OHSU dataset, Nature 2018) (high RBMX defined as a value > mean + 1 s.d. and low RBMX as a value < mean – 1 s.d.). High group: n = 82 patients, low group: n = 74 patients.
(k) Immunoblot analysis and band densitometry of CBX5 in AML patient samples compared to CB-CD34+ cells, normal PB, BM, and aged BM. Same immunoblot as Fig. 3e left panel. The experiment was performed once.
(l) Correlation of RBMX/L1 protein and CBX5 protein abundance quantified in Fig. 3e (right blot) and Fig. 8l. Simple linear regression, R square indicated. p value (F test) indicating the slope significantly different than zero.
(m-n) Immunoblot analysis and band densitometry of RBMX/L1 and CBX5 upon RBMX/L1 depletion in PDX AML-1 (m) (same immunoblot as Extended data Fig. 4l) and PDX AML-11 (n) (same immunoblot as Extended data Fig. 4n). Each immunoblot was performed once.
(o) Model for the RBMX/L1 requirement in AML. RBMX/L1 binds to CBX5 RNA and regulates the transcriptional activity of the CBX5 locus, which then maintains proper chromatin compaction in leukemia cells.
Data presented in b-d and f-j as mean +/− s.e.m. p value determined by two-tailed Student’s t test, unless stated otherwise.
To determine if there is a relationship between RBMX and CBX5 in human leukemia, we examined a published patient database64. Consistent with our studies, increased RBMX expression corresponds with elevated CBX5 mRNA expression in AML patients (Fig. 8j). Notably, we found CBX5 protein abundance to positively correlate with RBMX/L1 protein abundance in AML patients (Fig. 3e and Fig. 8k–h). Furthermore, CBX5 protein was reduced in both PDX AML-1 and AML-11 cells depleted for RBMX/L1 (Fig. 8m,n). Altogether, these data indicate that RBMX/L1 maintain the chromatin state that is essential for the survival of AML cells through their transcriptional regulation of CBX5 (Fig. 8o).
Discussion
The RNA binding protein RBMX has been implicated as a tumor suppressor in multiple types of solid cancers18,25–30. However, its function as an oncogene or its role in blood cancer has not yet been studied. Here, we uncover that RBMX and its retrogene RBMXL1 are regulators of leukemia survival. Using genetic approaches, we demonstrated that RBMX is required for maintaining leukemia in vitro and in vivo. Furthermore, we showed that the RBMX retrogene RBMXL1 exhibits a compensatory role in leukemogenesis.
RBMX and RBMXL1 abundance is increased in human AML cell lines and in patients compared to normal HSPCs. We found that RBMX/L1 are required for human AML leukemogenesis. Moreover, our data demonstrated a differential requirement for RBMX/L1 in leukemia cells compared to normal human blood cells. Our study suggests that these proteins could be biomarkers, as well as potential therapeutic targets in AML. Importantly, the identification of dysregulated RBPs in hematological malignancies has led to the rapid development of potential therapeutic strategies to specifically target several RBPs. For example, sulfonamides were determined to selectively degrade RBM3965–67, the small molecule Ro-08-2750 was recently characterized as a MSI RNA competitive inhibitor68, and chemically stable analogs of the bacterially derived products pladienolides and herboxidienes were developed to target the splicing factor SF3B69–72.
Mechanistically, RBMX has been shown to localize within heterochromatin regions and influence chromosome segregation by recruiting sister chromatid cohesion. Furthermore, RBMX was shown to play roles in alternative splicing in multiple cell contexts16–22,34. Here, we found that RBMX/L1 regulate chromatin compaction and chromosome integrity in AML cells through controlling the key heterochromatin component CBX5. We demonstrated that RBMX/L1 directly bind to CBX5’s intronic regulatory element and promote the transcriptional activity of the CBX5 locus at single molecule resolution. This action was mediated though the low complexity region of RBMX, which raises the possibility that RBMX forms phase transitions to maintain transcriptional regulation at specific loci. Since CBX5 overexpression rescued the defects of cell growth and apoptosis but not differentiation after RBMX/L1 loss, we speculate that other RBMX/L1 direct targets may be responsible for this RBMX/L1 function in myeloid leukemia. Overall, we find that RBMX/L1 control myeloid leukemogenesis in part through regulation of the chromatin state. RBMX/L1 and their regulation of CBX5 provide a model for how chromatin-associated RBPs regulate transcription.
Methods
Mice
Rbmxf sperm (strain C57BL/6NTac-Rbmx<tm2a(KOMP)Wtsi>/WtsiH) was purchased through EMMA (European Mutant Mouse Archive), which contained floxed LoxP sites flanking exon 4. The Memorial Sloan Kettering Cancer Center (MSKCC) Mouse Genetics Core performed in vitro fertilization using the Rbmxf sperm and implanted the embryos into FLP female mice. Rbmxf and Rbmxf/f mice were then crossed with Mx1-Cre mice to generate Rbmxf and Rbmxf/f Mx1-Cre- and Rbmxf and Rbmxf/f Mx1-Cre+ mice. For transplantation experiments, female C57BL/6 CD45.1 or CD45.2 mice, aged 6- to 8-week-old and purchased from Taconic Biosciences and Jackson Laboratories, respectively, were used as recipients. All animal studies were performed on animal protocols, #11-10-025, approved by the Institutional Animal Care and Use Committee (IACUC) at MSKCC.
Cell lines
MOLM13, KCL-22, Kasumi-1, K562, THP-1, U937, TF-1, NB4, HL-60, KG-1, Nomo-1, and 293T cell lines, purchased from ATCC and DSMZ (Supplementary Table 16), were authenticated by Genetica DNA Lab - Cell Line Testing (www.celllineauthentication.com). Cells were routinely tested and confirmed negative for mycoplasma in house by using a Mycoplasma Test from Lonza Biosciences (#LT07-218).
Viral transduction of hematopoietic and leukemic cells
All transduction of hematopoietic and leukemic primary cells and cell lines with lentiviruses or retroviruses in this study was performed by spinfection at 1400 RPM for 1 hour in media containing 10 μg/ml polybrene, unless stated otherwise.
Generation of MLL-AF9 leukemic cells
MLL-AF9 leukemic cells were generated as previously described73. Briefly, LSK cells were sorted, using antibodies listed in Supplementary Table 17, from the BM of 6 to 8-week-old Rbmxf/f or RbmxΔ/Δ mice and cultured overnight in Stemspan SFEM medium (Stem Cell Technologies) with 10 ng/ml IL-3, 10 ng/ml IL-6, 50 ng/ml SCF, 10 ng/ml TPO, and 20 ng/ml FLT-3 ligand). Cells were transduced with MLL-AF9 expressing retroviruses and expanded in M3434 methylcellulose medium (Stem Cell Technologies) for 7 days. Cells were then sorted for GFP positivity. 20,000 GFP+ cells and 250,000 BM support cells were injected into lethally irradiated 6-week-old C57BL/6 mice.
Generation of MLL-AF9 Rbmxf/f Cre-ER cells
This procedure was performed as previously described73. Briefly, mouse leukemic BM cells from Rbmxf/f mice were grown in RPMI medium containing 10% FBS, 10 ng/ml IL-3, 10 ng/ml SCF, 10 ng/ml IL-6, and 10 ng/ml GM-SCF. Cells were transduced with MSCV-Cre-ER-puromycin retroviruses twice and selected with 3 μg/ml puromycin.
Tamoxifen-mediated deletion of Rbmxf/f Cre-ER cells
For deletion of Rbmx, cells were treated with 0 nM or 200 nM of 4-OHT Tamoxifen (Sigma-Aldrich). After 24- or 48-hours cells were plated for colony-forming unit assays.
Leukemic transplants
Leukemic transplantation experiments were performed as previously described73, specifically as noted in that paper “For primary transplant of transformed MLL-AF9 LSK cells in leukemia initiation experiments, 200,000 GFP+ leukemic cells were injected retro-orbitally with 250,000 BM support cells into 6-week-old C57BL/6 mice, which were lethally irradiated with 900 rads. In secondary transplants, 250,000 BM leukemic cells were transplanted into C57BL/6 mice sublethally irradiated with 450 rads. MLL-AF9 leukemia maintenance experiments were performed by injecting MLL-AF9 [Rbmxf/f puro-Cre-ER] into sublethally irradiated mice and treating the mice with 160 mg/kg Tamoxifen or corn oil 3 days post-transplant.”
shRNA-mediated depletion of murine MLL-AF9 leukemia cells
Murine MLL-AF9 cells were transduced with lentivirus expressing either shRNA targeting luciferase (control shRNA) or shRNAs targeting Rbmx (shRNA96 and shRNA97, sequences in Supplementary Table 18). 2 days after transduction, cells were treated with 2 μg/ml puromycin for 2 days and then plated for colony-forming unit assays.
shRNA-mediated depletion of Rbmx deficient leukemia cells
RbmxΔ/Δ MLL-AF9 transformed cells were transduced with lentivirus expressing either shRNA targeting luciferase (control shRNA) or shRNAs targeting Rbmxl1 (shRNA587 and shRNA932, sequences in Supplementary Table 18). 2 days after transduction, cells were treated with 3 μg/ml puromycin for 2 days and then plated for colony-forming unit assays. For overexpression experiments, cells were spinfected with MSCV-IRES-GFP (Addgene #20672) retrovirus expressing either empty vector as control or Flag-RBMX. RBMX was cloned into MSCV-IRES-GFP vector from Origene hnRNPG (RBMX) (NM_002139) Human Tagged ORF Clone. 2 days after transduction, cells expressing RBMX were sorted for GFP positivity.
Purification, culture, and shRNA mediated depletion of cord blood-derived HSPC-CD34+ cells
Purification of human CD34+ HSPCs was performed as previously described74. CD34+ cells were transduced with lentivirus expressing either control scramble shRNA (Addgene #1864) or shRNAs targeting RBMX and RBMXL1 (shRNA1 and shRNA2). To differentiate HSPCs into myeloid lineage cells, cells were cultured under myeloid-promoting media containing the following cytokines: 100 ng/ml SCF, 10 ng/ml FLT-3 ligand, 20 ng/ml IL-3, 20 ng/ml IL-6, 20 ng/ml GM-CSF, and 20 ng/ml G-CSF (Peprotech, NJ).
shRNA-mediated depletion and proliferation assay of human leukemia cells
Leukemia cells were cultured in RPMI media (Cellgro) supplemented with 10% FBS, glutamine, and 1% penicillin/streptomycin at 37°C and 5% CO2. MOLM13, KCL-22, Kasumi-1, K562, and THP-1 cells were transduced with lentivirus expressing either control scramble shRNA (Addgene #1864) or shRNAs targeting RBMX and RBMXL1 (shRNA1 and shRNA2). 1- or 2-days after transduction, depending on the cell line, cells were treated with 3 μg/ml puromycin for 2 days after puromycin selection. For proliferation assays, cells were then plated at 250,000 cells/ml and counted every 24 hours at the indicated timepoints using a hemocytometer. MOLM13 cells were transduced with lentivirus expressing either control scramble shRNA (Addgene #1864) or shRNAs targeting CBX5 (shRNA368 and shRNA704). 2-days after transduction, cells were treated with 3 μg/ml puromycin for 2 days and then plated at 250,000 cells/ml. For overexpression experiments, KCL-22 cells were transduced with MSCV-IRES-GFP (Addgene #20672) retrovirus expressing either empty vector as control or Flag-RBMX. RBMX was cloned into MSCV-IRES-GFP vector from Origene hnRNPG (RBMX) (NM_002139) Human Tagged ORF Clone.
CRISPR-mediated deletion and proliferation assay of human leukemia cells
Cas9 expressing MOLM13 cell line (obtained from the Daniel Bachovchin Laboratory at MSKCC) were transduced with lentivirus pLKO5.sgRNA.EFS.GFP expressing either control GFP empty vector or sgRNAs targeting RBMX and RBMXL1 (sg-1 and sg-2, sequence in Supplementary Table 18). GFP+ sorted cells were plated for proliferation assay as described above. GFP+ cells were gated by flow cytometry to assess apoptosis and differentiation as described for shRNA transduced cells.
Patient samples
BM and PB samples from patients with AML were used in this study. Informed consent was obtained from patients according to protocols approved by the MSK IRB and in accordance with the Declaration of Helsinki. This research was approved by MSKCC Institutional Review Board (protocol #18-272). Diagnosis and disease status were confirmed and assigned according to World Health Organization (WHO) classification criteria. Patient characteristics are summarized in Supplementary Table 1 and Nature research reporting summary linked to this article.
Generation of patient-derived xenograft (PDX)
Primary cells from AML patients (AML-1, AML-11 and AML-13) were thawed from cryopreserved vials and immediately injected into immunodeficient NSG mice. Engraftment of human leukemia cells, as measured by human CD45 surface marker, was checked after approximately 1 month. The mice were sacrificed when they showed signs of illness. BM and spleen cells were collected and used for RBMX/L1 knockdown and transplantation.
In vivo transplantation of human leukemia cell line and PDX leukemia cells
1-day after transduction with scramble shRNA, shRNA1, or shRNA2 expressing lentiviruses, MOLM13 cells were treated with 3 μg/ml puromycin for 1 day. 500,000 selected cells were injected into 6-8 weeks old female NSG mice that had been sublethally irradiated with 450 rads the day before transplantation. For the in vivo transplantation experiments of PDX AML-1 and AML-13, primary transplanted cells were used, and for PDX AML-11, secondary transplanted cells were used. BM and/or spleen leukemia cells were transduced with scramble shRNA or shRNAs targeting RBMX and RBMXL1 and 8 μg/ml polybrene. 1-day after transduction, cells were sorted on the basis of human CD45 and GFP double positivity. 500,000 (PDX AML-1) and 80,000 (PDX AML-11 and 13) sorted cells were transplanted.
Colony-forming unit (CFU) assays
CFU assay was performed as previously described73. Briefly, for murine BM cells and MLL-AF9 transformed leukemia cells, 10,000 cells were plated on methylcellulose (Methocult M3434, Stem Cell Technologies), and colonies were scored 6-7 days after plating for murine BM cells. For Rbmxf/f Cre-ER cells, after 24 or 48 hours of 4-OHT Tamoxifen (Sigma-Aldrich) or ethanol treatment, 10,000 cells were plated on methylcellulose with 100 nM or 200 nM 4-OHT Tamoxifen (Sigma-Aldrich) or ethanol treatment. Colonies were scored 6 days after plating. For Rbmxl1 knockdown Rbmx deficient leukemic cells, 1,000 or 10,000 cells were plated with 3 μl/ml puromycin. For CB-CD34+ cells, 10,000 cells were plated on methylcellulose (MethoCult H4434, Stem Cell Technologies). Colonies (BFU-E, CFU-E, CFU-GM, and CFU-GEMM) were scored 14 days after plating.
Immunoblot analysis
Cells were counted and washed twice with PBS prior to collection. ~125,000 cells were resuspended and lysed in 40 μl 1X Laemmli protein sample buffer and boiled for 5 minutes. The lysates were separated on a 4-15% gradient SDS-PAGE and blotted onto a nitrocellulose membrane. Membranes were incubated with the following antibodies: RBMX, CBX5, FLAG, GAPDH, Histone H3, PABPC4, DACH1, CBS, SEPT11, HOXA9, MYC, and ACTIN (Catalogue# in Supplementary Table 19) at 1 in 1000 dilution in 5% skim milk TBST.
Immunoblot analysis of cytoplasmic and chromatin-bound proteins
MOLM13 cells washed twice with PBS were subjected to Subcellular Protein Fractionation procedure with the corresponding kit (Pierce). Cytoplasmic extracts and chromatin-bound fractions were lysed, denatured, and performed immunoblot analysis.
RNA purification and quantitative real-time PCR (qRT-PCR)
Total RNA was extracted from cells using TRIZOL (Sigma-Aldrich) and the RNeasy RNA extraction kit (Qiagen). RNA was reverse transcribed into cDNA using iSCRIPT kit (Bio-Rad). qRT-PCR was performed using the ABI 7500 Realtime PCR system. β actin was used to normalize for cDNA loading. Relative quantification of the target genes was calculated using the 2−ΔCt method.
mRNA stability assay
Control and RBMX/L1-depleted MOLM13 cells 2 days after transduction were treated with 5 μg/ml actinomycin D (Sigma-Aldrich) and collected at the indicated timepoints. Total RNA was isolated from the cells for qRT-PCR as described above. mRNA levels for each timepoint were normalized to levels at the starting point of the treatment.
Nascent mRNA assay
Newly synthesized RNA transcripts from control and RBMX/L1-depleted MOLM13 cells 2 days after transduction were isolated using Click-iT Nascent RNA Capture Kit (Invitrogen). cDNA was synthesized from RNA using SuperScript VILO cDNA Synthesis Kit (Invitrogen). qRT-PCR was performed as described above.
Flow cytometry
To measure myeloid differentiation, murine cells and human leukemic cells were stained with antibodies listed in Supplementary Table 17 at 1 in 200 dilution. To measure apoptosis, cells were incubated with anti-Annexin V (Supplementary Table 17) at 5 in 150 dilution in the 1X Annexin-V binding buffer (Thermo Fisher, V13246) and DAPI was added prior to flow cytometry. To quantify human leukemia engraftment, BM cells from recipient mice were stained with the antibodies listed in Supplementary Table 17, all at 1 in 200 dilution. Cells were analyzed using BD FACS LSR Fortessa instruments.
Morphological analysis
125,000 MOLM13 cells were washed once with PBS, cytospun onto slides at 500 RPM/5 minutes, and air-dried prior to GIEMSA staining. Cell morphology was imaged using Zeiss Imager M-2 equipped with AxioCam ERc 5s at 400X magnification.
Complex chromosomal karyotyping
Complex chromosomal karyotyping was done by the Molecular Cytogenetics Core at MSKCC. Briefly, MOLM13 control and RBMX/L1 depleted cells were incubated in media containing 0.5 μg/ml Colcemid for 45 minutes, then in 0.075 mol/L KCl at 37°C for 10 minutes and fixed in methanol-acetic acid (3:1). Metaphase spreads were prepared as per standard laboratory procedure. A minimum of 20 DAPI-banded metaphases were fully karyotyped and an additional 100 consecutive metaphases scored to assess chromosome morphology and chromosomal instability in the form of breaks/gaps and gross chromosomal structural alterations that can be easily recognized without karyotyping (ring chromosomes, dicentric/tricentrics, radial figures, exchanges, and giant marker chromosomes). Due to limitation of chromosome morphology and/or resolution, presence of subtle chromosomal abnormalities cannot be positively excluded. Composite karyotype contains all clonally occurring abnormalities within the sample and indicative of karyotypic heterogeneity.
smFISH
Probes specific to the CBX5 3’UTR and the first CBX5 intron were performed in Oligo7 software. Fifteen 30mer targeting sequences were identified using requirements in the Supplementary Table 20, with a minimum of 10bp between successive probes. smFISH was performed as previously described75, specifically noted in that paper the following method sections “Poly-l-lysine coating of #1.0 12mm coverslips, probe design, sequential smFISH, smFISH imaging and Image analysis for smFISH”. Intronic signal intensity is determined by the summed intensity of single, thresholded spots.”
Luciferase reporter assay
Original (CBX5) or deleted (ΔCBX5) intron 1 of human CBX5 was cloned upstream of Renilla luciferase reporter gene in pRL-Null vector (Promega AF025844). For ΔCBX5 construct, the RBMX/L1 CBX5 binding site was deleted. pRL-Null CBX5 or pRL-Null ΔCBX5 construct was co-transfected with Firefly luciferase control, as well as MSCV-IRES-GFP (Addgene #20672) empty vector control (EV), Flag-RBMX, or the indicated Flag-RBMX mutant in 293T cells. Flag-RBMX mutants were deleted as follows: ΔRRM (Δ9-81 amino acids), ΔSRR (Δ173-217), ΔTRR (Δ218-391), ΔRBD (Δ334-391), RGG Mutant (arginine-to-phenylalanine mutations in the three RGG repeats of the RBD [R373F, R377F, R384F]). 48 hours post transfection, Renilla and Firefly luciferase signal was measured by Dual-Luciferase Reporter Assay System (Promega).
RNA-Immunoprecipitation (RNA-IP)
MOLM13 cells overexpressing RBMX-Flag (RBMX-R2) were collected (20 x 106 cells were used per IP reaction) and washed twice with ice-cold PBS. Cells were lysed in ice-cold IP lysis buffer (50mM Tris-HCL pH 7.5; 300mM NaCl and 0.5% NP40) for 30 minutes on ice and frozen down at −80°C immediately to aid the lysis. On the IP day, lysate was spun down to precipitate the debris. Supernatant was collected and incubated with 7.5 ug anti-Flag antibody (Sigma Aldrich clone M2- F1804) or mouse IgG (Millipore 12-371) overnight at 4°C. RNA-RBMX-Flag-antibody complexes were pulled down using Dynabeads Protein A/G (Millipore) and washed 5 times in 100% IP lysis buffer, 70% IP lysis buffer and 30% PBS, 50% IP lysis buffer and 50% PBS, 30% IP lysis buffer and 70% PBS, and 100% PBS. RNA was extracted using phenol-chroloroform method and quantified for qRT-PCR.
RNA sequencing analysis
Total RNA was isolated from MOLM13 cells 2 days after transduction. RNA-sequencing was performed as previously described13, specifically noted on that paper “RNA was denatured, and the first strand cDNA was synthesized using oligo (dT)-primer-containing Illumina-compatible linker sequence. After RNA removal, the second cDNA strand was synthesized with a random decamer containing another Illumina-compatible linker sequence. Illumina-compatible annealing sequences and external barcodes were introduced during amplification of the libraries.”
Differential expression analyses
Raw reads were first analyzed for quality control using FastQC. Reads were then aligned to the hg19 assembly of the human genome using the STAR aligner. The resulting BAM files had their reads counted using the summarizeOverlaps function from the GenomicAlignments package in R. A count table of reads mapping to genes was constructed and a differential expression analysis was conducted using the DESeq software package. Prior to significance assessment, genes were filtered according to a reads per kilobase (RPK) value of 500 given the deep average depth of uniquely mapped reads (106,458,498) present in the samples. Statistical significance was determined with the negative binomial test using average read counts for controls and RBMX/RBMXL1 knockdown for all genes passing the RPK filter. The Benjamini-Hochberg correction was applied to all nominal p-values to account for multiple hypotheses testing to yield q-values. Genes were determined to be significantly differentially expressed if they possessed a q-value that was less than or equal to .05.
Differential splicing analysis
rMATS v4.0.1(turbo)76 software was used to perform differential splicing analysis between MOLM13 control and RBMX/L1 depleted cells 2 days after transduction. Human hg19 annotation was adopted as the background reference (gencodeGRCh37.v19.annotation.gtf). Alternative splicing events of five kinds (SE, A5SS, A3SS, MXE and RI) were determined by FDR < 0.05 as well as inclusion level differences larger than 0.1 between control and RBMX/L1-depleted cells.
PAR-CLIP sequencing analysis
PAR-CLIP sequencing of RBMX/L1 (HNRNPG) was obtained from NCBI GEO database with accession ID: GSE7408522. Fastq files of two replicates were downloaded with IDs: GSM1909463 and GSM1909464. Before alignment, tool ‘cutadapt’ was used to trim illumina TruSeq Small RNA 3’ Adapter: TGGAATTCTCGGGTGCCAAGG. Bowtie alignment was performed with allowing at most 2 bases of mismatch (parameter: -v 2). After sorting and indexing the bam files, the PARpipe pipeline from Ohler’s lab77 (https://github.com/ohlerlab/PARpipe) was used to identify potential mRNA binding clusters of RBMX/L1.
Assay for transposase-accessible chromatin sequencing (ATAC-seq) and analysis
MOLM13 control and RBMX/L1 depleted cells were processed for ATAC-sequencing 3 days after transduction. ATAC-sequencing was performed as previously described73. Pipeline ‘proatac’ (https://proatac.readthedocs.io/en/latest/) was used to perform preprocessing steps, including trimming, mapping, and initial quality controls. To identify reads peaks, MACS2 was applied with running mode ‘—broad’78. Next, peaks called on individual sample were merged into a single bed file using ‘Bedtools merge’. Then, function ‘Bedtools multicov’ was used to count reads that overlapped with each peak. This calculation resulted in a matrix indicating number of reads count for each peak (column) in each ATAC sample (row). Peaks with low mean reads counts < 50 were removed, followed by quantile normalization on sample level. Peaks were further annotated to human hg19 using R package ‘ChIPseeker’. Two-sided Students.t.test was applied to the normalized reads counts table to identify ATAC-seq peaks with significantly increased or decreased accessibility in RBMX/L1-depleted cells. Functional enrichment analysis for genes associated with significantly changed peaks was performed using g.profiler (https://biit.cs.ut.ee/gprofiler/gost). Hierarchical clustering was performed on the peaks with significantly altered accessibility between control and RBMX/L1-depleted cells. Command ‘heatmap.2’ from R package ‘gplots’ was adopted for this analysis using 1-(spearman correlation)/2 as the distance. The above analyses were repeated by only using peaks falling into pericentric or telomeric heterochromatin regions, which take 10% total length of entire chromosome arms.
Statistics and reproducibility
Two-tailed Student’s t test was used to test the significant difference in the graphs, except when stated otherwise. A two-sample equal variance with normal distribution was used. Significant difference was considered if p values are less than 0.05. Data are presented as means +/− s.e.m., except when stated otherwise. The number of independent experiments, patient samples, or events were indicated in the figure legends. For in vitro human cell line knock-down using shRNAs, data points were excluded if the knock-down did not work, confirming by immunoblots. In the luciferase assay in 293T cells, data points were excluded if the transfection did not work, confirming by the signal of firefly luciferase control. No other data was excluded. The investigators were not blinded to allocation during experiments and outcome assessment. For in vivo transplantation studies, survival probabilities were estimated using the Kaplan-Meier analysis and significant difference between groups was accessed by two-sided Mantel-cox test. Minimum of six animals per group were chosen to have an estimated 80% power in detecting a greater than 1.50 s.d. difference in means at a significant level of α = 0.05 using a two-sided test. Animals were randomly assigned to experimental groups. Statistical tests were performed using GraphPad Prism 8.0 and the R statistical environment.
Further information on research design is available in the Nature Research Reporting Summary linked to this article.
Data availability
ATAC-seq and RNA-seq data that support the findings of this study have been deposited in the Gene Expression Omnibus (GEO) database under the accession code GSE153637. Previously published microarray data in LSC+ vs LSC− fractions were reanalyzed here are available under accession code GSE76009. Previously published PAR-CLIP data of RBMX/L1 (HNRNPG) that were re-analyzed here are available under accession code GSE74085. Previously published TCGA data that were re-analyzed here are available at https://www.cbioportal.org/. Previously published ONCOMINE data that were re-analyzed here are available at https://www.oncomine.org/resource/login.html. Source data of all figures have been provided for this study. All other data supporting the findings of this study are available from the corresponding author on reasonable request.
Extended Data
Extended Data Fig. 1. RBMX is required for murine leukemia maintenance but is dispensable for leukemia initiation.

(a) Log2 fold depletion of control shRNAs (n = 5 independent shRNAs) and Rbmx-specifc shRNAs (n = 4 independent shRNAs) in MLL-AF9 leukemic BM cells in pooled in vivo shRNA screen.
(b) qRT-PCR showing efficient Rbmx deletion in MLL-AF9 leukemia cells 4 days post transduction. n = 3 independent experiments.
(c) Representative FACS plots of Fig. 1c.
(d) Representative FACS plots of Fig. 1d.
(e-f) qRT-PCR of Rbmx in normal c-Kit+ BM cells (control and shRNA97: n = 4, shRNA96: n = 3 independent experiments) and in MLL-AF9 leukemia cells (n = 3 independent experiments).
(g) qRT-PCR of Rbmx in AML1-ETO leukemia cells. n = 3 independent experiments.
(h) Colony formation assay of cells in h. n = 3 independent experiments.
(i) Diagram for generating Rbmx conditional knockout mice.
(j) Genotyping PCR detecting Rbmx deletion in BM cells isolated from RbmxΔ/Δ and RbmxΔ mice before leukemic transformation. Cre bands indicate the presence of Mx1-Cre allele. Representative image of 2 independent experiments with similar results.
(k) qRT-PCR showing Rbmx deletion of cells in j. n = 3 independent experiments.
(l) Experimental scheme for leukemia initiation experiments.
(m) Kaplan-Meier survival analysis of mice injected with female MLL-AF9-transformed Rbmxf/f and RbmxΔ/Δ cells. Rbmxf/f n = 9, RbmxΔ/Δ n = 10 mice; two-sided Mantel-Cox test.
(n) Spleen and liver weights from mice that succumbed to disease in m. Rbmxf/f n = 8, RbmxΔ/Δ n = 9 mice.
(o) Kaplan-Meier survival analysis of mice injected with male MLL-AF9 transformed Rbmxf and RbmxΔ cells. Rbmxf/f n = 10, RbmxΔ/Δ n = 12 mice; two-sided Mantel-Cox test.
(p) Spleen and liver weights from mice that succumbed to disease in o. Rbmxf/f n = 8, RbmxΔ/Δ n = 6 mice.
(q) Immunoblot analysis of MLL-AF9 Rbmxf/f Cre-ER cells expressing ectopic human RBMX and knocking down of endogenous RBMX when treated with 400nM 4-OHT. The experiment was performed 4 times with similar results.
(r) qRT-PCR of the cells from q. n = 3 independent experiments.
Data presented in a-b, e-h, k, n, p, r as mean +/− s.e.m. p value determined by two-tailed Student’s t test, unless stated otherwise.
Extended Data Fig. 2. Retrogene Rbmxl1 is functionally redundant with Rbmx in vitro and in vivo.

(a) Immunoblot analysis of RBMX/L1 protein in the BM cells isolated from Rbmxf/f and Rbmxf mice and RBMXL1 from RbmxΔ/Δ and RbmxΔ before leukemic transformation. The experiment was performed once.
(b) qRT-PCR of Rbmx and Rbmxl1 expression by shRNAs specific to Rbmx (but not Rbmxl1) in MLL-AF9 leukemia cells. Control and shRNA96: n = 3, shRNA97: n = 4 independent experiments.
(c) qRT-PCR of Rbmx and Rbmxl1 expression in MLL-AF9 Rbmxf/f Cre-ER cells treated with 4-OHT for 24 hours. n = 3 independent experiments.
(d) Quantitative FACS analysis summary of Gr-1+Mac-1+ and CD115+F4/80+ cells in control and RBMXL1-knockdown leukemic RbmxΔ/Δ cells 4 days post transduction. Control and shRNA587: n = 6, shRNA932: n = 4 independent experiments.
(e) Representative FACS plots of Fig. 2j.
(f) Representative FACS plots of Fig. 2k.
(g) Spleen and liver weights from mice that succumbed to disease in Fig. 2l. Control: n = 9, shRNA587: n = 5, shRNA932: n = 4 mice.
(h) Immunoblot analysis of leukemic BM cells isolated from mice that succumbed to disease in Fig. 2l. The experiment was performed once.
Data presented in b-d, and g as mean +/− s.e.m. p value determined by two-tailed Student’s t test, unless stated otherwise.
Extended Data Fig. 3. RBMX and RBMXL1 overexpression in myeloid leukemia.

(a)RBMX expression in AML patients with indicated status of NPM1 and FLT3-ITD mutation. Data are presented as mean of normalized RPKM +/− s.e.m, on the basis of data from the BeatAML vizome dataset (Tyner JW et al. Nature. 2018). Double negative n = 286, FLT3-ITD positive n = 54, NPM1 mut positive n = 59, double positive n = 49 patient samples; two tailed Student’s t test with Welch’s correction.
(b)RBMX expression in leukemic stem cell (LSC+) and non-leukemic stem cell population (LSC−) in AML patient samples on the basis of data from Ng SW et al. Nature. 2016 (GSE76009). LSC− n = 89, LSC+ n = 138 patient samples; data as mean +/− s.e.m, two-tailed Student’s t test.
(c-d) qRT-PCRs showing RBMX and RBMXL1 mRNA levels in multiple myeloid leukemia cell lines. For RBMX CB-CD34+, THP-1, HL-60, U-937 and K562: n = 3, MOLM13, Nomo-1 and NB4: n = 5, Kasumi-1, KCL-22, KG-1 and TF-1: n = 4 independent experiments; For RBMXL1 CB-CD34+, Nomo-1, THP-1, HL-60, U-937 and TF-1: n = 3; MOLM13, Kasumi-1, K562 and KG-1: n = 4; NB4 and KCL-22: n = 5 independent experiments. Data as mean +/− s.e.m, two-tailed Student’s t test.
(e) CRISPR score rank of RBMX, its retrogenes (RBMXL1, RBMXL2, and RBMXL3), and its paralog RBMY1A1. CRISPR score is the average log2 fold-change in the abundance of all sgRNAs targeting the gene after 14 population doublings33.
(f) CRISPR score of RBMX, its retrogenes, and its paralog across the 14 tested leukemia cell lines.
Extended Data Fig. 4. RBMX and RBMXL1 are required for human myeloid leukemia cell survival.

(a) Giemsa staining of control and RBMX/L1-knockdown MOLM13 cells from Fig. 4k. Original magnification 400X. Scale bar, 20μm. The experiment was performed once; control and shRNA1: 9 images, shRNA2: 16 images were collected.
(b-d) Representative FACS plots of Fig. 4m, o and p, respectively.
(e) Immunoblot analysis of RBMX/L1 in KCL-22 transduced with EV or RBMX overexpressing vector (RBMX-R2) and shRNA control or shRNAs against RBMX/L1. The experiment was performed 3 times with similar results.
(f) Proliferation assay of cells in e. n = 3 independent experiments.
(g) Quantitative FACS analysis of apoptotic cells in control and RBMX/L1-knockdown KCL-22-EV and KCL-22-RBMX-R2 cells 5 days post transduction. n = 3 independent experiments.
(h) Immunoblots for RBMX/L1 in MOLM13-Cas9 cells transduced with sgRNAs targeting RBMX/L1 (sg-1 and sg-2). The experiment was performed 4 times with similar results.
(i) Proliferation assay of cells in h. n = 4 independent experiments.
(j) FACS analysis of myeloid differentiation markers CD11b and CD33 in cells from h. n = 4 independent experiments.
(k) Quantitative FACS analysis summary of apoptosis of cells in h, 3 days post transduction. n = 4 independent experiments.
(l) Immunoblots analysis of GFP+ PDX AML-1 cells. The experiment was performed once.
(m) qRT-PCR showing depletion of RBMX/L1 in GFP+ PDX AML-13 cells. n = 1 experiment.
(n) Immunoblots for RBMX/L1 upon RBMX/L1 depletion in GFP+ PDX AML-11 cells. The experiment was performed once.
(o) Representative FACS plots of Fig. 4t.
(p) Immunoblot and band densitometry of RBMX/L1 in BM cells from animals transplanted with PDX AML-1 cells that succumbed to leukemia. The experiment was performed once.
(q-s) Representative FACS plots of Fig. 5c, g and h, respectively.
Data presented in f-g, i-k as mean, error bars, s.e.m. p values were calculated using two-tailed Student’s t test, unless indicated otherwise.
Extended Data Fig. 5. Loss of RBMX and RBMXL1 results in a dysregulated chromatin state in leukemia cells.

(a) Immunoblot analysis of RBMX/L1, MYC, and HOXA9 in RBMX/L1 depleted MOLM13 cells. The experiment was performed 3 times with similar results.
(b) Heatmap of the top 1,000 peaks from ATAC-sequencing from control and RBMX/L1-knockdown MOLM13 cells. n = 3 independent experiments.
(c) Scatterplot showing accessibility changes at pericentric and telomeric heterochromatin upon RBMX/L1-knockdown. n = 3 independent experiments.
(d) Location of increased accessible and decreased accessible ATAC-sequencing peaks in RBMX/L1-knockdown MOLM13 cells.
(e) Location of increased accessible and decreased accessible ATAC-sequencing pericentric and telomeric heterochromatin peaks in RBMX/L1-knockdown MOLM13 cells.
(f) Gene expression heatmap of the top 99 upregulated and downregulated genes from RNA-sequencing analysis of MOLM13 cells upon RBMX/L1 knockdown. n = 4 independent experiments.
(g) Tables showing alternative splicing events and genes MOLM13 cells upon RBMX/L1 depletion. n = 4 independent experiments.
(h) mRNA expression of the 11 genes from the overlap in Fig. 7a. n = 4 independent experiments; data as mean +/− s.e.m, two-tailed Student’s t test.
(i) qRT-PCR of recovered RNA in RNA-IP at 11 candidate target genes shown in Fig. 7a. n = 4 independent experiments; data as mean +/− s.e.m, two-tailed Student’s t test.
(j) Overall survival analysis of AML patients with low versus high expression of RBMX/L1 direct regulated pathway including 8 down-regulated targets validated by PAR-CLIP, RNA-IP and RNA-sequencing (CBX5, CBS, DACH1, SEPT11, UNG, XBP1, PABPC4, and SLC38A1). Data from TCGA database.
Extended Data Fig. 6. Loss RBMX/L1 in MOLM13 cells leads to decreased CBX5 transcript expression.

(a) Immunoblot analysis and band densitometry of RBMX/L1, DACH1, CBX5, CBS, and SEPT11 upon RBMX/L1 depletion in MOLM13 cells. The experiment was performed 3 times with similar results.
(b)CBX5 mRNA expression in leukemic RBMXL1 depleted RbmxΔ cells. n = 5 independent experiments.
(c) Immunoblots and band densitometry of RBMX/L1 and CBX5 in leukemic RBMXL1 depleted RbmxΔ cells. The experiment was performed 3 times with similar results.
(d)CBX5 mRNA expression upon RBMX/L1 depletion in MOLM13-Cas9 cells. n = 4 independent experiments.
(e) Immunoblots and band densitometry of RBMX/L1 and CBX5 upon RBMX/L1 depletion in MOLM13-Cas9 cells. Same immunoblot as Extended data Fig. 4h with longer exposure for RBMX/L1 band. The experiment was performed 3 times with similar results.
(f) qRT-PCR of CBX5 mRNA expression at indicated exon and exon-exon junction. Exon 3 amplicon: n = 3, all other amplicons: n = 6 independent experiments; data as mean +/− s.e.m, two-tailed Student’s t test.
(g) mRNA stability of RBMX and CBX5 upon RBMX/L1 depletion in MOLM13 cells. 0 min and 90 min: n = 5, 30 min and 270 min: n = 4, 150 min: n = 3 independent experiments.
(h) qRT-PCR of nascent mRNAs of RBMX/L1 candidate targets upon RBMX/L1 depletion. DACH1: n = 4, SEPT11 and PABPC4: n = 5, CBS control and shRNA1 n = 6 and shRNA2 n = 5, XBP1 control n = 6 for, shRNA1 and shRNA2 n = 4, UNG control and shRNA1 n = 6, shRNA2 n = 4 independent experiments.
(i) Quantitative summary of smFISH with CBX5-Intron 1 probe (Fig. 7f). Control: n = 229, shRNA1: n = 71, shRNA2: n = 38 foci.
(j) qRT-PCR measuring absolute number of CBX5-Intron 1 and Renilla luciferase (Rluc) nascent mRNA transcripts in CBX5-Intron 1 luciferase reporter assay. n = 4 independent experiments.
(k) qRT-PCR of CBX5 and RBMX mRNA upon CBX5 depletion in MOLM13 cells. n = 3 independent experiments.
(l) qRT-PCR of RBMX and CBX5 mRNA upon RBMX/L1 depletion in MOLM13-EV and MOLM13-CBX5 cells. EV-shRNA2 n = 4, all other groups: n = 3 independent experiments.
(m) Cells from Fig. 8e were plated for proliferation assay and counted 4 days post transduction. n = 3 independent experiments.
Data presented in b, d, f-m as mean +/− s.e.m. p values were calculated using two-tailed Student’s t test, unless indicated otherwise.
Supplementary Material
Acknowledgements
We would like to thank members of the Kharas laboratory for their discussions, helpful advice, and suggestions. We would also like to thank the MSKCC Integrated Genomics Operation (IGO), Epigenetics Technology Innovation Lab, and Molecular Cytogenetics Core for their technical support. We would like to thank Kaylah Birmingham for her technical support. M. G. K. is a Scholar of the Leukemia and Lymphoma Society and supported by the US NIH National Institute of Diabetes Digestive and Kidney Diseases Career Development Award; NIDDK NIH R01-DK101989-01A1; NCI 1R01CA193842-01 NCI 1R01CA193842-06A1, 5R01CA186702-07, 1R01DK1010989-06A1, R01HL135564, and R01CA225231-01; NYSTEM 0266-A121-4609, the Kimmel Scholar Award; the V-Scholar Award; the Geoffrey Beene Award; the Starr Cancer Consortium; the Alex’s Lemonade Stand A Award; the LLS Translation Research Program; the Susan and Peter Solomon Fund; and the Tri-Institutional Stem Cell Initiative 2016-014. C.P. is supported by NIDDK Research Supplement to Promote Diversity in Health-Related Research 3R01DK101989-03S1. D.T.T.N is supported by Scholar Award from the American Society of Hematology. A.M.S is supported by Lauri Strauss Leukemia Foundation and AIL (Associazione Italiana contro Leucemie, Linfomi e Mielomi) through SIES (Societa’ Italiana Ematologia Sperimentale) and L.P.V. is supported by K99 CA229993 and the LLS Career Development Award.
Competing Interests Statement
M.G.K discloses the following relationships and financial interests: 28-7 Therapeutics (Provision of Services, uncompensated) and Accent Therapetics (Provision of Services). U.S. has received research funding from GlaxoSmithKline, Bayer Healthcare, Aileron Therapeutics, Novartis, has received compensation for consultancy services and for serving on scientific advisory boards from GlaxoSmithKline, Bayer Healthcare, Novartis, Celgene, Aileron Therapeutics, Stelexis Therapeutics, Pieris Pharmaceuticals, and Vor Biopharma, and has equity ownership in and is serving on the board of directors of Stelexis Therapeutics. All other authors declare no competing interests.
References
- 1.Maynadié M et al. Twenty-five years of epidemiological recording on myeloid malignancies: Data from the specialized registry of hematologic malignancies of côte d’or (Burgundy, France). Haematologica 96, 55–61 (2011). [DOI] [PMC free article] [PubMed] [Google Scholar]
- 2.Prieto C & Kharas MG RNA Regulators in Leukemia and Lymphoma. Cold Spring Harb. Perspect. Med. 1–27 (2020). doi: 10.1101/cshperspect.a034967 [DOI] [PMC free article] [PubMed] [Google Scholar]
- 3.Kharas MG et al. Musashi-2 regulates normal hematopoiesis and promotes aggressive myeloid leukemia. Nat. Med 16, 903–908 (2010). [DOI] [PMC free article] [PubMed] [Google Scholar]
- 4.Ito T et al. Regulation of myeloid leukaemia by the cell-fate determinant Musashi. Nature 466, 765–768 (2010). [DOI] [PMC free article] [PubMed] [Google Scholar]
- 5.Byers RJ, Currie T, Tholouli E, Rodig SJ & Kutok JL MSI2 protein expression predicts unfavorable outcome in acute myeloid leukemia. Blood 118, 2857–2867 (2011). [DOI] [PubMed] [Google Scholar]
- 6.Kwon HY et al. Tetraspanin 3 is required for the development and propagation of acute myelogenous leukemia. Cell Stem Cell 17, 152–164 (2015). [DOI] [PMC free article] [PubMed] [Google Scholar]
- 7.Park S et al. Musashi2 sustains the mixed-lineage leukemia–driven stem cell regulatory program. J Clin Invest 125, 1–13 (2015). [DOI] [PMC free article] [PubMed] [Google Scholar]
- 8.Taggart J et al. MSI2 is required for maintaining activated myelodysplastic syndrome stem cells. Nat. Commun 7, 10739 (2016). [DOI] [PMC free article] [PubMed] [Google Scholar]
- 9.Xiao R et al. Pervasive chromatin-RNA binding protein interactions enable RNA-based regulation of transcription. Cell 178, 107–121.e18 (2019). [DOI] [PMC free article] [PubMed] [Google Scholar]
- 10.Taccioli GE et al. Ku80: Product of the XRCC5 gene and its role in DNA repair and V(D)J recombination. Science (80-. ). 265, 1442–1445 (1994). [DOI] [PubMed] [Google Scholar]
- 11.Baltz AG et al. The mRNA-bound proteome and its global occupancy profile on protein-coding transcripts. Mol. Cell 46, 674–690 (2012). [DOI] [PubMed] [Google Scholar]
- 12.Davidovich C et al. Toward a consensus on the binding specificity and promiscuity of PRC2 for RNA. Mol. Cell 57, 552–558 (2015). [DOI] [PMC free article] [PubMed] [Google Scholar]
- 13.Vu LP et al. Functional screen of MSI2 interactors identifies an essential role for SYNCRIP in myeloid leukemia stem cells. Nat. Genet 49, 866–875 (2017). [DOI] [PMC free article] [PubMed] [Google Scholar]
- 14.Lingenfelter PA et al. Expression and conservation of processed copies of the RBMX gene. Mamm. Genome 12, 538–545 (2001). [DOI] [PubMed] [Google Scholar]
- 15.Elliott DJ, Dalgliesh C, Hysenaj G & Ehrmann I RBMX family proteins connect the fields of nuclear RNA processing, disease and sex chromosome biology. Int. J. Biochem. Cell Biol 108, 1–6 (2019). [DOI] [PubMed] [Google Scholar]
- 16.Matsunaga S et al. RBMX: A Regulator for Maintenance and Centromeric Protection of Sister Chromatid Cohesion. Cell Rep. 1, 299–308 (2012). [DOI] [PubMed] [Google Scholar]
- 17.Heinrich B et al. Heterogeneous nuclear ribonucleoprotein G regulates splice site selection by binding to CC(A/C)-rich regionsin pre-mRNA. J. Biol. Chem 284, 14303–14315 (2009). [DOI] [PMC free article] [PubMed] [Google Scholar]
- 18.Hirschfeld M et al. HNRNP G and HTRA2-BETA1 regulate estrogen receptor alpha expression with potential impact on endometrial cancer. BMC Cancer 15, 1–11 (2015). [DOI] [PMC free article] [PubMed] [Google Scholar]
- 19.Nasim MT, Chernova TK, Chowdhury HM, Yue BG & Eperon IC HnRNP G and Tra2β: Opposite effects on splicing matched by antagonism in RNA binding. Hum. Mol. Genet 12, 1337–1348 (2003). [DOI] [PubMed] [Google Scholar]
- 20.Cléry A et al. Molecular basis of purine-rich RNA recognition by the human SR-like protein Tra2-β1. Nat. Struct. Mol. Biol 18, 443–451 (2011). [DOI] [PubMed] [Google Scholar]
- 21.Moursy A, Allain FHT & Cléry A Characterization of the RNA recognition mode of hnRNP G extends its role in SMN2 splicing regulation. Nucleic Acids Res. 42, 6659–6672 (2014). [DOI] [PMC free article] [PubMed] [Google Scholar]
- 22.Liu N et al. N6-methyladenosine alters RNA structure to regulate binding of a low-complexity protein. Nucleic Acids Res. 45, 6051–6063 (2017). [DOI] [PMC free article] [PubMed] [Google Scholar]
- 23.Becker JS et al. Genomic and Proteomic Resolution of Heterochromatin and Its Restriction of Alternate Fate Genes. Mol. Cell 68, 1134–1146.e6 (2017). [DOI] [PMC free article] [PubMed] [Google Scholar]
- 24.Zhou KI et al. Regulation of Co-transcriptional Pre-mRNA Splicing by m6A through the Low-Complexity Protein hnRNPG. Mol. Cell 76, 70–81 (2019). [DOI] [PMC free article] [PubMed] [Google Scholar]
- 25.Renieri A et al. Oligogenic germline mutations identified in early non-smokers lung adenocarcinoma patients. Lung Cancer 85, 168–174 (2014). [DOI] [PubMed] [Google Scholar]
- 26.Zhang D, Qu L, Zhou B, Wang G & Zhou G Genomic variations in the counterpart normal controls of lung squamous cell carcinomas. Front. Med. 12, 280–288 (2018). [DOI] [PubMed] [Google Scholar]
- 27.Ouyang YQ et al. Expression levels of hnRNP G and hTra2-beta1 correlate with opposite outcomes in endometrial cancer biology. Int. J. Cancer 128, 2010–2019 (2011). [DOI] [PubMed] [Google Scholar]
- 28.Martinez-Arribas F et al. Positive correlation between the expression of X-chromosome RBM genes (RBMX, RBM3, RBM10) and the proapoptotic Bax gene in human breast cancer. J. Cell. Biochem 97, 1275–1282 (2006). [DOI] [PubMed] [Google Scholar]
- 29.Shin KH, Kang MK, Kim RH, Christensen R & Park NH Heterogeneous nuclear ribonucleoprotein G shows tumor suppressive effect against oral squamous cell carcinoma cells. Clin. Cancer Res. 12, 3222–3228 (2006). [DOI] [PubMed] [Google Scholar]
- 30.Antonello ZA et al. Vemurafenib-resistance via de novo RBM genes mutations and chromosome 5 aberrations is overcome by combined therapy with palbociclib in thyroid carcinoma with BRAFV600E. Oncotarget 8, (2017). [DOI] [PMC free article] [PubMed] [Google Scholar]
- 31.Ng SWK et al. A 17-gene stemness score for rapid determination of risk in acute leukaemia. Nature 540, 433–437 (2016). [DOI] [PubMed] [Google Scholar]
- 32.Radich JP et al. Gene expression changes associated with progression and response in chronic myeloid leukemia. Proc. Natl. Acad. Sci. U. S. A 103, 2794–2799 (2006). [DOI] [PMC free article] [PubMed] [Google Scholar]
- 33.Wang T et al. Gene Essentiality Profiling Reveals Gene Networks and Synthetic Lethal Interactions with Oncogenic Ras. Cell 168, 890–903.e15 (2017). [DOI] [PMC free article] [PubMed] [Google Scholar]
- 34.Munschauer M et al. The NORAD lncRNA assembles a topoisomerase complex critical for genome stability. Nature 561, 132–136 (2018). [DOI] [PubMed] [Google Scholar]
- 35.Somervaille TCP et al. Hierarchical maintenance of MLL myeloid leukemia stem cells employs a transcriptional program shared with embryonic rather than adult stem cells. Cell Stem Cell 4, 129–140 (2009). [DOI] [PMC free article] [PubMed] [Google Scholar]
- 36.Wu K et al. Cell fate determination factor DACH1 inhibits c-Jun-induced contact-independent growth. Mol. Biol. Cell 18, 755–767 (2007). [DOI] [PMC free article] [PubMed] [Google Scholar]
- 37.Wu K et al. The cell fate determination factor Dachshund inhibits androgen receptor signaling and prostate cancer cellular cell growth. Cancer Res. 69, 3347–3355 (2009). [DOI] [PMC free article] [PubMed] [Google Scholar]
- 38.Lee JW et al. Regulation of HOXA9 activity by predominant expression of DACH1 against C/EBPα and GATA-1 in myeloid leukemia with MLL-AF9. Biochem. Biophys. Res. Commun. 426, 299–305 (2012). [DOI] [PubMed] [Google Scholar]
- 39.Ge Y, Jensen TL, Matherly LH & Taub JW Transcriptional regulation of the cystathionine-β-synthase gene in Down syndrome and non-Down syndrome megakaryocytic leukemia cell lines. Blood 101, 1551–1557 (2003). [DOI] [PubMed] [Google Scholar]
- 40.Ge Y et al. High frequency of the 844ins68 cystathionine-β-synthase gene variant in Down syndrome children with acute myeloid leukemia. Leukemia 16, 2339–2341 (2002). [DOI] [PubMed] [Google Scholar]
- 41.Santos J et al. Expression pattern of the septin gene family in acute myeloid leukemias with and without MLL-SEPT fusion genes. Leuk. Res. 34, 615–621 (2010). [DOI] [PubMed] [Google Scholar]
- 42.Sun H et al. Inhibition of IRE1α-driven pro-survival pathways is a promising therapeutic application in acute myeloid leukemia. Oncotarget 7, 18736–18749 (2016). [DOI] [PMC free article] [PubMed] [Google Scholar]
- 43.Slupianek A et al. BCR-ABL1 kinase inhibits uracil DNA glycosylase UNG2 to enhance oxidative DNA damage and stimulate genomic instability. Leukemia 27, 629–634 (2013). [DOI] [PMC free article] [PubMed] [Google Scholar]
- 44.Kuppers DA et al. N6-methyladenosine mRNA marking promotes selective translation of regulons required for human erythropoiesis. Nat. Commun. 10, (2019). [DOI] [PMC free article] [PubMed] [Google Scholar]
- 45.Kini HK, Kong J & Liebhaber S a. Cytoplasmic Poly(A) Binding Protein C4 serves a critical role in erythroid differentiation. Mol. Cell. Biol. 34, 1300–1309 (2014). [DOI] [PMC free article] [PubMed] [Google Scholar]
- 46.Li Y, Shao H, Da Z, Pan J & Fu B High expression of SLC38A1 predicts poor prognosis in patients with de novo acute myeloid leukemia. J. Cell. Physiol. 234, 20322–20328 (2019). [DOI] [PubMed] [Google Scholar]
- 47.Maison C & Almouzni G HP1 and the dynamics of heterochromatin maintenance. Nat. Rev. Mol. Cell Biol. 5, 296–304 (2004). [DOI] [PubMed] [Google Scholar]
- 48.Kwon SH & Workman JL The heterochromatin protein 1 (HP1) family: put away a bias toward HP1. Mol. Cells 26, 217–27 (2008). [PubMed] [Google Scholar]
- 49.Bannister AJ et al. Selective recognition of methylated lysine 9 on histone H3 by the HP1 chromo domain. Nature 410, 120–124 (2001). [DOI] [PubMed] [Google Scholar]
- 50.Jamieson K et al. Loss of HP1 causes depletion of H3K27me3 from facultative heterochromatin and gain of H3K27me2 at constitutive heterochromatin. Genome Res. 26, 97–107 (2016). [DOI] [PMC free article] [PubMed] [Google Scholar]
- 51.Femino AM, Fay FS, Fogarty K & Singer RH Visualization of single RNA transcripts in situ. Science (80-. ). 280, 585–590 (1998). [DOI] [PubMed] [Google Scholar]
- 52.Senecal A et al. Transcription factors modulate c-Fos transcriptional bursts. Cell Rep. 8, 75–83 (2014). [DOI] [PMC free article] [PubMed] [Google Scholar]
- 53.Skinner SO et al. Single-cell analysis of transcription kinetics across the cell cycle. Elife 5, e12175 (2016). [DOI] [PMC free article] [PubMed] [Google Scholar]
- 54.Tantale K et al. A single-molecule view of transcription reveals convoys of RNA polymerases and multi-scale bursting. Nat. Commun. 7, (2016). [DOI] [PMC free article] [PubMed] [Google Scholar]
- 55.Zoller B, Little SC & Gregor T Diverse spatial expression patterns emerge from unified kinetics of transcriptional bursting. Cell 175, 835–847.e25 (2018). [DOI] [PMC free article] [PubMed] [Google Scholar]
- 56.Wan Y et al. Dynamic imaging of nascent RNA reveals general principles of transcription dynamics and stochastic splice site selection. (Social Science Research Network, 2019). [DOI] [PMC free article] [PubMed] [Google Scholar]
- 57.Kato M et al. Cell-free Formation of RNA Granules: Low Complexity Sequence Domains Form Dynamic Fibers within Hydrogels. Cell 149, 753–767 (2012). [DOI] [PMC free article] [PubMed] [Google Scholar]
- 58.Nott TJ et al. Phase Transition of a Disordered Nuage Protein Generates Environmentally Responsive Membraneless Organelles. Mol. Cell 57, 936–947 (2015). [DOI] [PMC free article] [PubMed] [Google Scholar]
- 59.Elbaum-Garfinkle S et al. The disordered P granule protein LAF-1 drives phase separation into droplets with tunable viscosity and dynamics. Proc. Natl. Acad. Sci. 112, 7189–7194 (2015). [DOI] [PMC free article] [PubMed] [Google Scholar]
- 60.Molliex A et al. Phase Separation by Low Complexity Domains Promotes Stress Granule Assembly and Drives Pathological Fibrillization. Cell 163, 123–133 (2015). [DOI] [PMC free article] [PubMed] [Google Scholar]
- 61.Chong PA, Vernon RM & Forman-kay JD RGG/RG Motif Regions in RNA Binding and Phase Separation. J. Mol. Biol. 430, 4650–4665 (2018). [DOI] [PubMed] [Google Scholar]
- 62.Vernon RM & Forman-kay JD First-generation predictors of biological protein phase separation. Curr. Opin. Struct. Biol. 58, 88–96 (2019). [DOI] [PubMed] [Google Scholar]
- 63.Kanhoush R et al. Novel domains in the hnRNP G/RBMX protein with distinct roles in RNA binding and targeting nascent transcripts. Nucleus I, 109–122 (2009). [DOI] [PMC free article] [PubMed] [Google Scholar]
- 64.Tyner JW et al. Functional genomic landscape of acute myeloid leukaemia. Nature 562, 526–531 (2018). [DOI] [PMC free article] [PubMed] [Google Scholar]
- 65.Han T et al. Anticancer sulfonamides target splicing by inducing RBM39 degradation via recruitment to DCAF15. Science (80-. ). 356, (2017). [DOI] [PubMed] [Google Scholar]
- 66.Uehara T et al. Selective degradation of splicing factor CAPERα by anticancer sulfonamides. Nat. Chem. Biol. 13, 675–680 (2017). [DOI] [PubMed] [Google Scholar]
- 67.Eric Wang A et al. Targeting an RNA-Binding Protein Network in Acute Myeloid Leukemia Article Targeting an RNA-Binding Protein Network in Acute Myeloid Leukemia. Cancer Cell 35, 1–16 (2019). [DOI] [PMC free article] [PubMed] [Google Scholar]
- 68.Minuesa G et al. Small-molecule targeting of MUSASHI RNA-binding activity in acute myeloid leukemia. Nat. Commun. 10, 1–15 (2019). [DOI] [PMC free article] [PubMed] [Google Scholar]
- 69.Kaida D et al. Spliceostatin A targets SF3b and inhibits both splicing and nuclear retention of pre-mRNA. 3, 5–9 (2007). [DOI] [PubMed] [Google Scholar]
- 70.Kotake Y et al. Splicing factor SF3b as a target of the antitumor natural product pladienolide. 3, 570–575 (2007). [DOI] [PubMed] [Google Scholar]
- 71.Fan L, Lagisetti C, Edwards CC, Webb TR & Potter PM Sudemycins, novel small molecule analogues of FR901464, induce alternative gene splicing. 582–589 (2011). doi: 10.1021/cb100356k [DOI] [PMC free article] [PubMed] [Google Scholar]
- 72.Bonnal S, Vigevani L & Valcarcel J The spliceosome as a target of novel antitumour drugs. Nat. Rev. Drug Discov. 11, 847–859 (2012). [DOI] [PubMed] [Google Scholar]
- 73.Park SM et al. IKZF2 Drives Leukemia Stem Cell Self-Renewal and Inhibits Myeloid Differentiation. Cell Stem Cell 24, 153–165.e7 (2019). [DOI] [PMC free article] [PubMed] [Google Scholar]
- 74.Vu LP et al. The N6-methyladenosine (m6A)-forming enzyme METTL3 controls myeloid differentiation of normal hematopoietic and leukemia cells. Nat. Med. 23, 1369–1376 (2017). [DOI] [PMC free article] [PubMed] [Google Scholar]
- 75.Wheat JC et al. Single-molecule imaging of transcription dynamics in somatic stem cells. Nature 583, 431–436 (2020). [DOI] [PMC free article] [PubMed] [Google Scholar]
- 76.Shen S et al. rMATS: Robust and flexible detection of differential alternative splicing from replicate RNA-Seq data. Proc. Natl. Acad. Sci. U. S. A. 111, E5593–E5601 (2014). [DOI] [PMC free article] [PubMed] [Google Scholar]
- 77.Mukherjee N et al. Deciphering human ribonucleoprotein regulatory networks. Nucleic Acids Res. 47, 570–581 (2019). [DOI] [PMC free article] [PubMed] [Google Scholar]
- 78.Zhang Y et al. Model-based analysis of ChIP-Seq (MACS). Genome Biol. 9, (2008). [DOI] [PMC free article] [PubMed] [Google Scholar]
Associated Data
This section collects any data citations, data availability statements, or supplementary materials included in this article.
Supplementary Materials
Data Availability Statement
ATAC-seq and RNA-seq data that support the findings of this study have been deposited in the Gene Expression Omnibus (GEO) database under the accession code GSE153637. Previously published microarray data in LSC+ vs LSC− fractions were reanalyzed here are available under accession code GSE76009. Previously published PAR-CLIP data of RBMX/L1 (HNRNPG) that were re-analyzed here are available under accession code GSE74085. Previously published TCGA data that were re-analyzed here are available at https://www.cbioportal.org/. Previously published ONCOMINE data that were re-analyzed here are available at https://www.oncomine.org/resource/login.html. Source data of all figures have been provided for this study. All other data supporting the findings of this study are available from the corresponding author on reasonable request.