

Abstract
Background:
In older adults, increases in physical activity may prevent decline in lower-extremity function, but whether the benefit differs according to metabolic syndrome (MetS) status is uncertain. We aim to investigate whether structured physical activity is associated with less decline in lower-extremity function among older adults with versus without MetS.
Methods:
We used data from the multicenter Lifestyle Interventions and Independence for Elders (LIFE) study to analyze 1535 sedentary functionally-vulnerable women and men, aged 70 to 89 years old, assessed every 6 months (February 2010–December 2013) for an average of 2.7 years. Participants were randomized to a structured, moderate-intensity physical activity intervention (PA; n = 766) or health education program (HE; n = 769). MetS was defined according to the 2009 multi-agency harmonized criteria. Lower-extremity function was assessed by 400-m walking speed and the Short Physical Performance Battery (SPPB) score.
Results:
763 (49.7%) participants met criteria for MetS at baseline. Relative to HE, PA was associated with faster 400-m walking speed among participants with MetS (P < 0.001) but not among those without MetS (P = 0.91), although the test for statistical interaction was marginally non-significant (P = 0.07). In contrast, no benefit of PA versus HE was observed on the SPPB score in either MetS subgroup.
Conclusions:
Among older adults at high risk for mobility disability, moderate-intensity physical activity conveys significant benefits in 400-m walking speed but not SPPB in those with, but not without, MetS. The LIFE physical activity program may be an effective strategy for maintaining or improving walking speed among vulnerable older adults with MetS.
Trial registration:
clinicaltrials.gov Identifier: NCT01072500
Keywords: Metabolic syndrome, Walking speed, Short physical performance battery, Physical activity intervention, Randomized clinical trial
1. Introduction
Metabolic syndrome (MetS) (Alberti et al., 2009), a grouping of metabolic indicators, including abdominal obesity, high triglycerides (TG), low HDL-cholesterol (HDL-C), high blood-pressure (BP), and impaired glucose tolerance, has been identified in approximately 50% of adults age 60 years and older in the US (Hirode and Wong, 2020). Existing studies have documented an association between MetS and/or its components and subsequent decline in muscle strength, quality, and function, and in multiple measures of lower-extremity function, including walking speed and other indicators assessed by the Short Physical Performance Battery (SPPB) (Mankowski et al., 2015; Carriere et al., 2014; Laudisio et al., 2014; Kuo et al., 2009; Okoro et al., 2006). In turn, declines in walking speed and SPPB scores are highly predictive of subsequent disability, hospitalization, nursing home admission, and mortality (Guralnik et al., 1994; Guralnik et al., 1995; Newman et al., 2006).
Sedentary behavior is a risk factor for MetS (Healy et al., 2011), while increasing levels of physical activity may slow the progression towards MetS, independent of a variety of confounding factors (Ekelund et al., 2007). In this context, understanding the effects of MetS and physical activity, separately and together, on various indicators of lower-extremity function, such as walking speed and SPPB, is important for both clinical and public health practice.
Results from the LIFE-P (Pahor et al., 2006) and LIFE studies (Pahor et al., 2014; Santanasto et al., 2017) show that structured physical activity is effective in improving lower-extremity function (primarily walking speed, but also overall SPPB score and its chair-stand component) and preventing mobility disability among older adults with functional limitations. More so, in a recent analysis of the LIFE study data, physical activity substantially lowered the risk for persistent mobility disability among participants with MetS, but not among those without MetS (Botoseneanu et al., 2017), suggesting a differential effect of physical activity on mobility according to metabolic status. However, the evidence is lacking on whether the differential benefit of physical activity according to MetS status extends beyond mobility disability to discrete measures of lower-extremity function. This is an important gap in knowledge, given that walking speed and SPPB, including declines in both measures over time, are strong predictors of key aging outcomes, not only mobility disability, but also quality of life, institutionalization, and mortality (Guralnik et al., 1994; Legrand et al., 2014; Volpato et al., 2011; Newman et al., 2006). As such, interventions aimed at preserving lower-extremity function, as assessed by walking speed and SPPB, are of utmost importance for older adults. Additionally, walking speed and SPPB show only moderate correlation and a significant degree of predictive discordance (Sayers et al., 2006), thereby justifying their assessment as separate outcomes. The objective of the current study was to add to the previous investigations by determining whether baseline MetS modifies the beneficial effect of a structured physical activity intervention on the two indicators of lower-extremity function, specifically 400-m walking speed and the SPPB score, in a sample of vulnerable but nondisabled older adults with functional limitations.
Given the potential treatability of MetS, the results of this study may inform clinical and public health interventions aimed at maintaining lower-extremity function in high-risk older adults, by identifying subgroups who could benefit from physical activity versus those who may need other interventions (beyond exercise) to preserve their lower-extremity function.
2. Methods
The current manuscript presents results for a secondary analysis that was not pre-specified in the study protocol but was pre-specified in a proposal that was approved by the LIFE Publications and Presentations Committee prior to initiation.
2.1. Study design and participants
The Lifestyle Interventions and Independence for Elders (LIFE) study was a multi-center, parallel randomized controlled trial, which compared the effects of a moderate-intensity physical activity (PA) intervention with a health education (HE) program on the incidence of major mobility disability (defined as inability to walk 400 m in less than 15 min) in 1635 adults, ages 70 to 89 years old, who had functional limitations. The LIFE study was conducted at 8 centers across the US between February 2010 and December 2013.
Primary results and detailed descriptions of study design, recruitment, intervention protocol, and inclusion/exclusion criteria have been provided in detail elsewhere (Pahor et al., 2014; Marsh et al., 2013; Fielding et al., 2011). Briefly, inclusion criteria were: (a) sedentary lifestyle (i.e., <20 min/week of structured physical activity in the past month and ≤125 min/week of moderate physical activity based on 18 items from the Community Healthy Activities Model Program for Seniors (CHAMPS) physical activity questionnaire) (Stewart et al., 2001); presence of functional limitations (defined as a Short Physical Performance Battery (SPPB) score of 9 or less) (Guralnik et al., 1994); and ability to walk 400-m in <15 min, unassisted, without sitting or leaning. The exclusion criteria aimed to identify persons likely unable to fully participate in the interventions because of comorbid conditions or cognitive impairment and those for whom PA would be unsafe.
2.2. Randomization and analytic sample
The participant flow diagram is shown in Supplement S1. Details regarding screening, recruitment yields, and randomization flow have been published (Pahor et al., 2014; Marsh et al., 2013). 1635 eligible participants were randomized to the PA group (818 participants) or the HE group (817 participants), using a web-based data management system with a permuted block algorithm, stratified by clinical site and gender. For the present study, we excluded 100 participants (52 from the PA group and 48 from the HE group) for whom the MetS status at baseline could not be determined because of missing data, resulting in an analytic sample of 1535 participants.
2.3. Interventions
The PA intervention included walking, with the goal of 30 min of moderate intensity walking per session or 150 min per week, supplemented with strength, balance, and large-muscle flexibility training to be done twice per week at the clinic and 3–4 times per week at home. Activity intensity was assessed with the Borg scale of self-perceived exertion (range 0–20) (Borg, 1982) and participants were asked to perform at an intensity of 13 (i.e., “somewhat hard”) for walking or 15–16 (i.e., “hard”) for the other exercises. The PA group attended 63% of the scheduled sessions (median [IQR], 71% [50%–83%]).
The HE program entailed weekly workshops focused on successful aging topics (e.g., preventive health care and screening, navigating the healthcare system, and finding reliable health information) for the first 26 weeks and monthly workshops thereafter. The topic of physical activity was deliberately avoided. The HE group also participated in a 5- to 10-minute instructor-led program of upper-extremity stretching exercises. HE participants attended 73% of the scheduled sessions (median [IQR], 82% [63%–90%]).
The two programs, behavioral strategies for maintaining the PA intervention program, and assessment of intervention adherence have been described in detail elsewhere (Pahor et al., 2014; Fielding et al., 2011).
2.4. Measures
2.4.1. Lower-extremity function
Two measures of lower-extremity function were evaluated: 400-m walking speed and the SPPB score. 400-m walking speed (in meters/second; m/s) was calculated at baseline and at 6-months intervals for up to 42 months, based on the time that each participant needed to complete a 400-m course, while walking at usual speed, without sitting, leaning, or the assistance of another person or a walker. In older adults, the 400-m walk time has been associated with greater risk of mobility limitation, disability, and mortality (Newman et al., 2006), and serves as a proxy indicator for ability to walk within the community (Shumway-Cook et al., 2007).
The SPPB score (Guralnik et al., 1994), assessed at baseline, 6, 12, 24, and 36 months, is a reliable and responsive summary measure of lower-extremity performance (Ostir et al., 2002), comprised of three timed tests of balance, 4-m usual pace walking, and repeated chair stands. Per convention (Guralnik et al., 1994), a five-level summary scale, ranging from 0 (unable to perform the task) to 4 (best performance) was created for each test and an overall SPPB score (range: 0–12; higher score indicates better performance) was calculated for each participant by summing the scores on the three tests.
2.4.2. Metabolic syndrome (MetS)
MetS was measured at baseline using the harmonized criteria from the 2009 Joint Interim Statement from multiple scientific associations (Alberti et al., 2009), as the presence of 3 or more components from the following: (a) abdominal obesity (waist circumference ≥ 102 cm in men and ≥88 cm in women; waist circumference was measured at the midpoint between highest point of the iliac crest and lowest part of the costal margin in the mid-axillary line); (b) low HDL-cholesterol (<40 mg/dl for men and <50 mg/dl for women or drug treatment for low HDL); (c) high triglycerides (TG) (≥150 mg/dl or drug treatment for elevated TG); (d) high blood pressure (systolic pressure ≥ 130 and/or diastolic pressure ≥ 85 mm Hg or antihypertensive drug treatment with a history of physician-diagnosed elevated blood pressure); and (e) high fasting plasma glucose (≥100 mg/dl or drug treatment for diabetes). MetS was coded as a binary variable (absent/present).
The 12-hour fasting blood samples were tested in a single laboratory. Participants were asked to bring all current medications and a medication review was done at the phlebotomy visit.
2.4.3. Other measures
The other baseline measures included self-reported sociodemographic information, medical and hospitalization history, medication inventory, health care utilization, physical activity assessed with the Community Healthy Activities Model Program for Seniors (CHAMPS) questionnaire (Stewart et al., 2001) and accelerometry over 7-day periods (Actigraph Inc.) (Matthew, 2005), and cognitive status. Details about these measures are provided elsewhere (Fielding et al., 2011). Participants’ health status was assessed by: (a) self-report of physician-diagnosed diabetes (absent/present); (b) a comorbidity summary index (range: 0–6) of participants’ reports of physician-diagnosed angina/myocardial infarction, congestive heart failure, stroke, cancer, and lung disease (no/yes for all 5 conditions), and peripheral arterial disease (absent if ankle-brachial index 0.9 and present if <0.9) (Aboyans et al., 2012); (c) cognitive function assessed with the Modified Mini-Mental State (3MS) examination (range: 0–100; higher score denotes better cognitive functionigher score denotes better cognitive function) (Teng and Chui, 1987); and (d) body-mass index (BMI) calculated from measured weight and height [weight (kg)/height2 (m)].
2.5. Statistical analysis
Baseline characteristics were summarized by MetS status and intervention group using means and standard deviations for continuous variables and counts and percentages for categorical variables. Intervention adherence was calculated as the percentage of scheduled intervention sessions attended. Linear mixed effect models (LMM) were used for analysis of follow-up measures including 400-m walking speed and SPPB scores (for lower-extremity function outcomes), and minutes spent in activity associated with more than 760 cpm (by accelerometry; for assessment of intervention adherence) (Matthew, 2005). For each outcome, the model included intervention group, baseline status of metabolic syndrome, discrete follow-up time, and interaction terms MetS * intervention group, MetS * time, intervention group * time, and MetS * intervention group * time, with the adjustment of site, sex, and the corresponding baseline outcome measure. Appropriate variance-covariance structures were selected based on Akaike information criterion (AIC) and the principle of parsimony. Least square means and standard errors (SE) were reported. Contrasts were used to compare the two interventions arms within each MetS status at each follow-up visit and overall across the duration of the study.
Because the effect of physical activity may vary across the three components of the SPPB score (Santanasto et al., 2017), supplementary analyses were conducted with the SPPB gait speed, chair stands, and balance components as additional outcomes.
All analyses were performed using SAS 9.4 (Cary, NC) and p-values less than 0.05 were considered statistically significant.
3. Results
Participants’ sociodemographic and health characteristics are summarized in Table 1, according to MetS status and intervention group. As shown, 763 (49.7%) participants had 3 or more MetS criteria, thus fulfilling the requirements for MetS (MetS subgroup), while 772 (50.3%) had 2 or fewer criteria (non-MetS subgroup). Baseline characteristics were similar between PA and HE participants within each MetS subgroup. In the overall sample, the mean age was 78.9 years, 66.6% were women, and 20.3% were non-Whites. As expected, in both the PA and HE groups, the mean body-mass index (BMI) and percentage of participants with diabetes were higher in the MetS than in the non-MetS subgroups, but the number of comorbidities and 3MS scores were similar in the two subgroups.
Table 1.
Descriptive characteristics of study participants, according to metabolic syndrome (MetS) status and intervention group.
| Characteristics | Non-MetS (n =
772) |
MetS (n =
763) |
||
|---|---|---|---|---|
| PA (n =380) | HE (n = 392) | PA (n = 386) | HE (n = 377) | |
| Demographics | ||||
| Age, mean (SD), years | 79.5 (5.4) | 80.1 (5.3) | 77.9 (5.0) | 78.0 (4.9) |
| Female, n (%) | 250 (65.8) | 267 (68.1) | 257 (66.6) | 248 (65.8) |
| Non-white, n (%) | 81 (21.4) | 70 (17.9) | 86 (22.3) | 74 (19.7) |
| Education, college or above, n (%) | 274 (72.0) | 280 (72.0) | 239 (61.9) | 238 (63.1) |
| Health status | ||||
| Diabetes diagnosis, n (%) | 34 (8.9) | 41 (10.5) | 176 (45.6) | 192 (50.9) |
| BMI, mean (SD) | 28.0 (5.3) | 28.1 (5.7) | 32.2 (5.5) | 32.6 (6.0) |
| Comorbidities, mean (SD) | 0.48 (0.7) | 0.57 (0.7) | 0.57 (0.8) | 0.59 (0.8) |
| 3MSE score, mean (SD) | 91.6 (5.4) | 91.7 (5.2) | 91.7 (5.4) | 91.6 (5.5) |
| CHAMPS score, mean (SD) | 15.7 (31.1) | 20.1 (35.5) | 16.9 (33.5) | 16.7 (32.8) |
| MetS criteriaa, n (%) | ||||
| Abdominal obesity | 188 (49.9) | 214 (55.4) | 359 (93.2) | 348 (92.3) |
| Low HDL-C | 10 (2.6) | 7 (1.8) | 160 (41.8) | 161 (44.0) |
| High triglycerides | 25 (6.6) | 23 (5.9) | 205 (53.4) | 195 (53.7) |
| Hypertension | 245 (64.5) | 248 (63.3) | 359 (93.0) | 352 (93.4) |
| High fasting glucose | 73 (19.2) | 69 (17.6) | 321 (83.6) | 312 (82.8) |
| 400-m walking speed, mean (SD), m/s | 0.84 (0.2) | 0.84 (0.2) | 0.81 (0.2) | 0.80 (0.2) |
| SPPB score, mean (SD) | 7.4 (1.4) | 7.4 (1.6) | 7.4 (1.6) | 7.2 (1.6) |
| Attrition and follow-up | ||||
| Died, n (%) | 23 (6.1) | 22 (5.6) | 24 (6.2) | 17 (4.5) |
| Lost to follow-up, n (%) | 15 (3.9) | 16 (4.1) | 15 (3.9) | 8 (2.1) |
| Follow-up time, mean (SD), years | 2.7 (0.6) | 2.7 (0.5) | 2.7 (0.6) | 2.7 (0.6) |
| Sessions attended, n (%) | 63.3 (26.5) | 73.0 (25.2) | 63.8 (26.6) | 74.0 (23.7) |
| 400-M walking assessments, mean (SD) | 5.9 (1.8) | 6.0 (1.6) | 6.0 (1.7) | 6.1 (1.7) |
| SPPB score assessments, mean (SD) | 4.5 (1.2) | 4.5 (1.0) | 4.5 (1.2) | 4.5 (1.1) |
Abbreviations: MetS – metabolic syndrome; PA – physical activity group; HE – health education group; BMI - body-mass index; 3MSE - Modified Mini-Mental Examination score; CHAMPS - Community Healthy Activities Model Program for Seniors physical activity score; HDL-C - high-density lipoprotein cholesterol; SPPB – Short Physical Performance Battery.
Missing values account for the small discrepancies between total n (in each column) and the values listed under each descriptive characteristic.
For each condition, medication use was included as a diagnostic criterion, as described in the Methods.
3.1. Intervention adherence and attrition
Follow-up and attrition indicators were similar between the two MetS subgroups in both intervention groups (Table 1). PA participants in both the MetS and non-MetS subgroups attended 63% of the scheduled sessions; HE participants attended 73% (MetS subgroup) and 74% (non-MetS subgroup) of the sessions. The difference observed between the PA and the HE group in accelerometer-based minutes of physical activity within each MetS group was maintained over time (Table 2).
Table 2.
Accelerometer-baseda minutes of physical activity according to metabolic syndrome status and intervention group.
| Monthb | Non-MetS |
MetS |
||
|---|---|---|---|---|
| PA |
HE |
PA |
HE |
|
| Mean (SE) | Mean (SE) | Mean (SE) | Mean (SE) | |
| 0 | 197.4 (9.3) | 208.2 (9.3) | 182.1 (9.3) | 180.7 (9.4) |
| 6 | 224.3 (6.7) | 180.9 (6.6) | 222.2 (6.7) | 174.0 (6.8) |
| 12 | 210.7 (6.5) | 176.1 (6.5) | 213.9 (6.5) | 168.0 (6.6) |
| 24 | 196.1 (7.1) | 154.4 (7.0) | 173.5 (7.0) | 157.2 (7.2) |
Abbreviations: MetS – metabolic syndrome; PA – physical activity group; HE – health education group; SE – standard error.
Mean values represent least squares means from a mixed-effects model adjusting for clinical site and sex (both used to stratify randomization). In addition, the model included a term for the MetS/intervention group, follow-up clinic visit, and the MetS * intervention group * visit
3-way interaction; p-value for interaction = 0.059.
Accelerometry based on the 760 cpm cut-point (Aboyans et al., 2012).
All participants had expected follow-up through 24 months; accelerometry data were not collected beyond 24 months.
3.2. Outcomes
As shown in Table 3 and Fig. 1, the PA intervention (as compared with the HE program) had a beneficial overall effect on the 400-m walking speed among participants with MetS (P < 0.001 for overall effect), but not among those without MetS (P = 0.91 for overall effect). Specifically, participants in the MetS/PA group had statistically significant faster walking speeds compared with those in the MetS/HE group at all post-randomization assessments except at 36 months. Among participants without MetS, 400-m walking speeds did not differ statistically over time, with the exception of a higher walking speed in PA vs. HE group at the 6-month assessment (0.85 vs. 0.83 m/s, P = 0.03). However, the statistical interaction for 400-m walking speed was marginally non-significant (P-interaction 0.07).
Table 3.
Adjusteda 400-m walking speed and SPPB score at each follow-up time, by metabolic syndrome (MetS) status and intervention group.
| Non-MetS | MetS | |||||
|---|---|---|---|---|---|---|
|
|
|
|
|
|||
| PA | HE | PA | HE | |||
|
|
|
|
|
|
|
|
| Mean (SE) | Mean (SE) | P-value (for difference PA-HE) | Mean (SE) | Mean (SE) | P-value (for difference PA-HE) | |
| 400-m walking speed (m/s)baseline | 0.84 (0.01) | 0.84 (0.01) | 0.96 | 0.81 (0.01) | 0.80 (0.01) | 0.15 |
| 6 months | 0.85 (0.01) | 0.83 (0.01) | 0.03 | 0.85 (0.01) | 0.81 (0.01) | <0.001 |
| 12 months | 0.82 (0.01) | 0.81 (0.01) | 0.53 | 0.82 (0.01) | 0.79 (0.01) | <0.001 |
| 18 months | 0.81 (0.01) | 0.80 (0.01) | 0.42 | 0.81 (0.01) | 0.77 (0.01) | <0.001 |
| 24 months | 0.79 (0.01) | 0.78 (0.01) | 0.64 | 0.79 (0.01) | 0.75 (0.01) | <0.001 |
| 30 months | 0.75 (0.01) | 0.76 (0.01) | 0.50 | 0.77 (0.01) | 0.74 (0.01) | 0.03 |
| 36 months | 0.74 (0.01) | 0.75 (0.01) | 0.41 | 0.75 (0.01) | 0.73 (0.01) | 0.24 |
| 42 months | 0.73 (0.02) | 0.76 (0.02) | 0.30 | 0.74 (0.02) | 0.68 (0.01) | 0.01 |
| Overall effectb | 0.91 | <0.001 | ||||
| P-value for interactionc = 0.07 | ||||||
| SPPB scored baseline | 7.37 (0.08) | 7.44 (0.08) | 0.55 | 7.45 (0.08) | 7.23 (0.08) | 0.06 |
| 6 months | 8.50 (0.11) | 8.21 (0.11) | 0.06 | 8.46 (0.11) | 8.10 (0.11) | 0.02 |
| 12 months | 8.20 (0.11) | 8.06 (0.11) | 0.33 | 8.46 (0.11) | 8.05 (0.11) | 0.01 |
| 24 months | 7.92 (0.11) | 7.78 (0.11) | 0.34 | 7.96 (0.11) | 7.75 (0.11) | 0.18 |
| 36 months | 7.75 (0.15) | 7.48 (0.15) | 0.21 | 7.68 (0.15) | 7.70 (0.15) | 0.92 |
| Overall effectb | 0.11 | 0.07 | ||||
| P-value for interactionc = 0.22 | ||||||
Abbreviations: MetS – metabolic syndrome; PA – physical activity; HE – health education; SPPB – Short Physical Performance Battery.
Adjusted for clinical site and gender.
Overall difference in 400-m walk speed and SPPB across follow-up time points, adjusted for baseline value.
Interaction terms included MetS * intervention group, MetS * time, intervention group * time, and MetS * group * time terms.
Per inclusion criteria, participants were eligible if they had a baseline SPPB score of 9 or less; SPPB scores could potentially be >9 at follow-up visits.
Fig. 1.
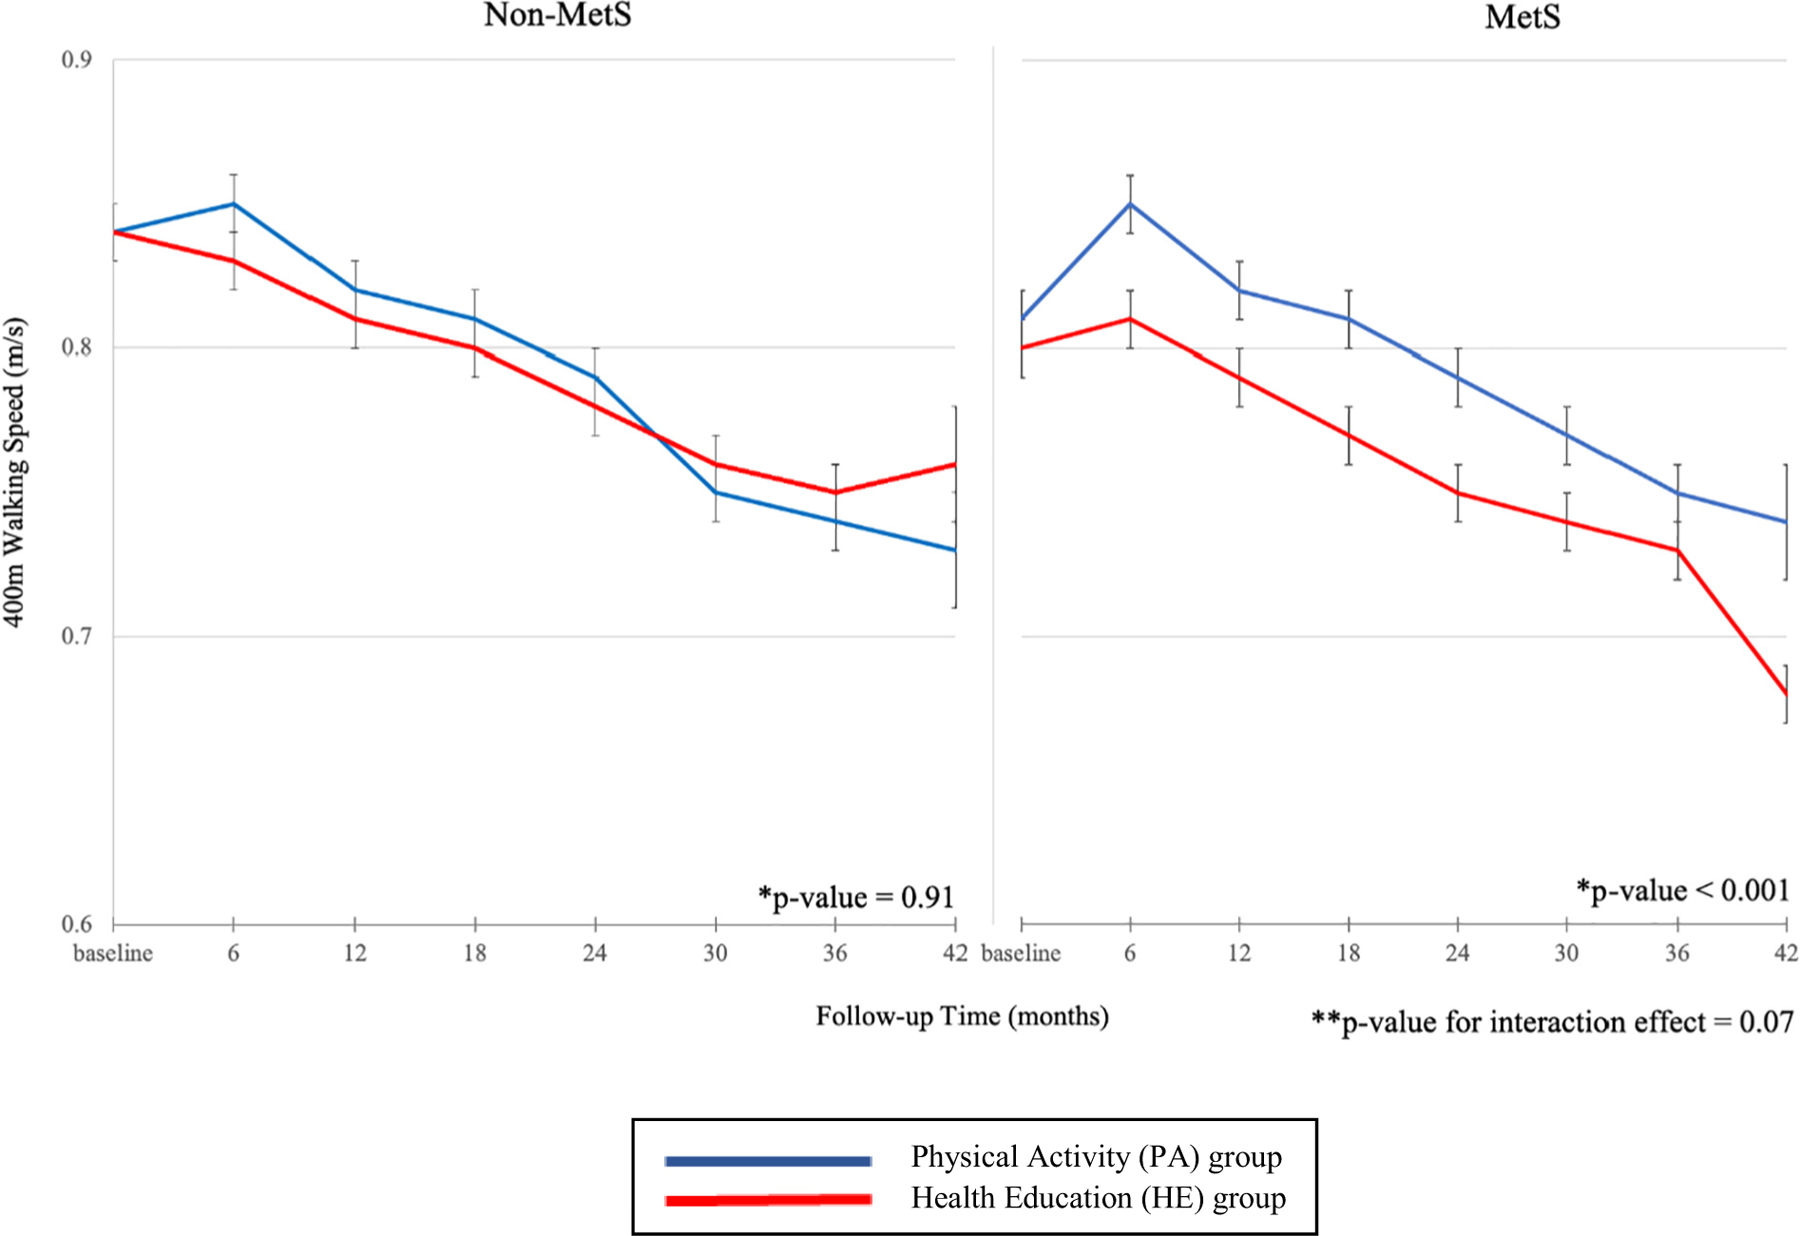
Adjusted mean 400-m walking speed by metabolic syndrome (MetS) status and intervention group.
Notes: Abbreviations: MetS – metabolic syndrome.
*p-value for difference between the physical activity (PA) and health education (HE) groups.
**p-value for interaction included MetS * intervention group, MetS * time, intervention group * time, and MetS * intervention group * time terms.
The PA intervention did not show a statistically significant overall benefit (relative to HE) on SPPB scores in the MetS subgroup (P = 0.07) or the non-MetS subgroup (P = 0.11) (Table 3 and Fig. 2). MetS/PA participants had significantly higher SPPB scores at 6 months (8.46 vs. 8.10, P = 0.02) and 12 months (8.46 vs. 8.05, P = 0.01) compared with MetS/HE participants, but not at 24 (P = 0.18) or 36 months (P = 0.92). In the non-MetS group, the mean SPPB scores did not statistically differ between the PA and HE arms at any of the time points. The interaction was not statistically significant (P-interaction = 0.22) for SPPB score.
Fig. 2.
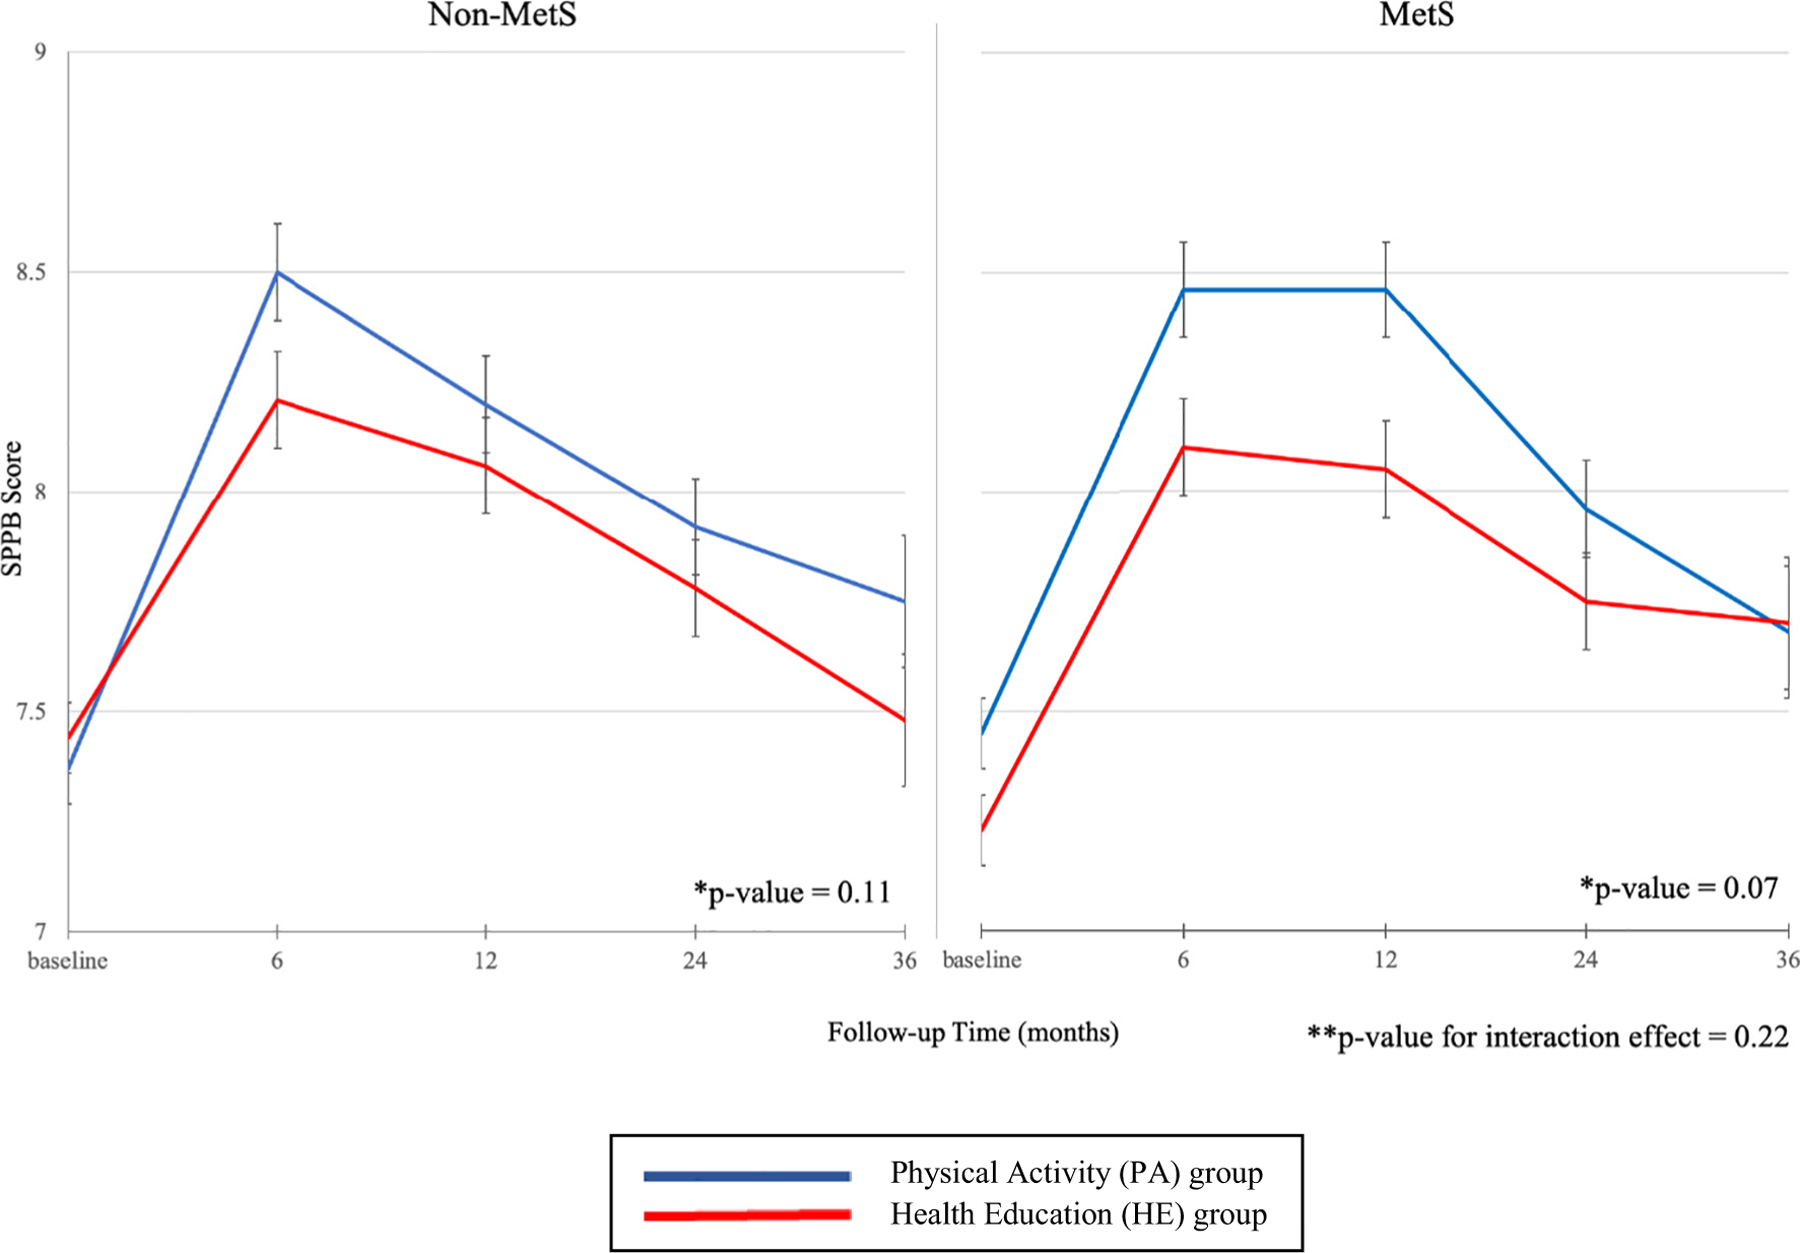
Adjusted mean SPPB score by metabolic syndrome (MetS) status and intervention group.
Notes: Abbreviations: MetS – metabolic syndrome; SPPB – Short Physical Performance Battery.
*p- value for difference between the physical activity (PA) and health education (HE) groups.
**p- v alue for interaction included MetS * intervention group, MetS * time, intervention group * time, and MetS * intervention group * time terms.
The supplementary analyses, which tested the three SPPB components – gait speed, chair stands, and balance – as separate outcomes (Supplementary File 2), showed that the interaction terms were not significant for any of the three components, indicating that the difference in PA benefit (vs. HE) for gait speed, chair stands, and balance was not statistically different between participants with and without MetS. Additionally, the differences between PA and HE were non-significant overall and at all time points, in both the MetS and non-MetS groups for the gait and balance components. For the chair stands component, the results indicated that the PA intervention (vs. HE) had a small positive effect overall and at 6 and 12 months in the MetS group, but only at 24 months in the non-MetS group.
4. Discussion
In this analysis of data from a large, long-term (average 2.7 years) randomized controlled trial, a structured moderate-intensity physical activity intervention, focused on walking supplemented by balance and lower-extremity resistance training, showed a beneficial effect (compared with health education) on 400-m walking speed among older adults with MetS, but not among those without MetS. However, the difference in benefit between participants with versus without MetS was marginally non-significant. In addition, although the intervention showed an early (at 6- and 12-months) benefit on SPPB scores in participants with MetS, there was no overall SPPB benefit over the full course of follow-up in either participants with or without MetS.
In line with prevalence estimates from the general older US population (Hirode and Wong, 2020; Shin et al., 2018), one out of every 2 participants in our sample of older adults at high-risk for mobility disability met the criteria for MetS, with abdominal obesity and hypertension being the most prevalent individual components. These findings underscore that a wide segment of the older population with functional limitations is at risk for negative functional outcomes associated with metabolic dysfunction (Botoseneanu et al., 2017), and highlight the clinical and public health importance of identifying effective interventions aimed at maintaining lower-extremity function in older persons with MetS.
Compared with the HE intervention, the LIFE PA intervention produced a significant benefit in 400-m walking speed among MetS participants. This finding aligns with published reports from the LIFE Study, which showed that the PA intervention substantially reduced the incidence of major mobility disability (defined based on ability to walk a 400-m course in 15 min or less) in participants with MetS but not in those without MetS (Botoseneanu et al., 2017). The current findings add to the existing literature by investigating the effects of the intervention specifically on walking speed, a physical functioning measure with strong positive associations with both quality and quantity of life in older adults (Newman et al., 2006; Groessl et al., 2007). In the current study, the difference in walking speed between PA and HE participants ranged from 0.03 to 0.06 m/s. These values, which were statistically significant, represent small clinically meaningful differences (Kwon et al., 2009), corresponding to a self-reported ability to climb one flight of stair or walk an additional quarter-mile (Perera et al., 2006). The clinical importance of even small changes in walking speed is enhanced by prior findings showing that incremental clinical benefits can be detected across a continuous, rather than categorical, range of walking speeds (Abellan Van Kan et al., 2009; Studenski et al., 2011), and that improvement in 400-m walking speed was responsible for a considerable portion of the benefit of the LIFE Study exercise intervention in preventing mobility disability (Santanasto et al., 2017).
In contrast, the PA intervention did not improve walking speed (vs. HE) for participants without MetS, Based on formal tests of interaction, however, the differential benefit of the intervention on walking speed between the two groups was only marginally non-significant (P 0.07). The LIFE Study was powered to detect clinically meaningful reductions in the primary outcome (major mobility disability) according to intervention group for all participants, but not within specific subgroups. Because the analyses presented here were not prespecified in the original study protocol, and 100 participants were omitted because of missing baseline MetS data, we cannot exclude the possibility that a larger sample or longer follow-up would have resulted in statistically significant MetS subgroup differences.
We considered several possible explanations for our findings on walking speed. First, the pathophysiological processes responsible for age-related slow walking speed may differ between persons with and without MetS. MetS has been linked to muscle deficiency ( de Carvalho et al., 2019; Cawthon et al., 2011), low cardiorespiratory fitness (Hassinen et al., 2010) and chronic inflammatory and oxidative stress processes (Catalán et al., 2018; Collins et al., 2018; Beavers et al., 2013a). Prior observational and intervention studies (Kritchevsky et al., 2017; Villareal et al., 2011; Porter Starr et al., 2014; Beavers et al., 2013b) have demonstrated robust beneficial effects of physical activity on these processes. In contrast, our findings suggest that processes that are not responsive to moderate physical activity, such as age-related sensory impairments (Ward et al., 2014; Crews and Campbell, 2004), central and peripheral neuroaging (Ward et al., 2015; Rosso et al., 2013), and/or loss of proprioception (Peixoto et al., 2011), may contribute to slow walking speed in persons without MetS, though it is unclear whether the contribution of these factors differs between persons with and without MetS. Second, we evaluated markers of intervention adherence and found that the percent of sessions attended was similar between MetS/intervention subgroups (Table 1) and that the difference in accelerometer-measured minutes of physical activity was maintained over the follow-up period (Table 2), indicating that a difference in intervention adherence between MetS subgroups is an unlikely explanation for these results.
Despite the rather substantial improvement in SPPB scores from baseline to 6 months in all the sub-groups (Table 3 and Fig. 2), the PA intervention showed no overall benefit compared with the HE program on SPPB scores in either the MetS or non-MetS subgroups. Analyses that evaluated the SPPB score components as separate outcomes showed that PA and HE had similar effects on gait speed and balance regardless of MetS status and that a small benefit of PA (vs. HE) was observed only on chair stands in the MetS subgroup. The lack of a benefit of PA on the overall SPPB score is in contrast to published reports from the LIFE-P and the main LIFE Study, which found an overall benefit of physical activity on SPPB scores in the aggregate sample, but aligns with analyses of the same data stratified according to diabetes status (Espeland et al., 2017), suggesting that insufficient statistical power rather than a true lack of effect may underlie the findings. In the MetS subgroup, we found a substantial meaningful SPPB difference (ΔSPPB ≥ 0.4) between PA and HE at 12 months and a small meaningful difference at 6 months (ΔSPPB 0.3) (Kwon et al., 2009). In contrast, the largest difference reported by Santanasto et al. for the entire LIFE sample was 0.3 points at 6 months (Santanasto et al., 2017). The fact that the magnitude of the difference in SPPB scores between PA and HE was larger at all post-randomization assessments in the MetS group as compared with the difference previously reported in the aggregate LIFE sample, yet the overall effect of the intervention was not statistically significant in the MetS group, further strengthens the likelihood that lack of statistical power rather than a true lack of effect is at play here. In addition, based on the eligibility criteria, LIFE participants were required to be able to walk unassisted at a speed compatible with independent living (excluding those at the very low end of SPPB scores) and to be at high risk of mobility disability as indicated by an SPPB score of 9 or less. By reducing variability across subgroups, the condensed range of SPPB scores in the resulting sample may have limited the ability to detect differences by MetS/intervention subgroups.
To our knowledge, this is the first study to assess the effectiveness of a structured physical activity intervention, combining walking, resistance, and balance training, on indicators of lower-extremity function in mobility-risk older individuals, separately by MetS status. This study has important strengths, including objectively measured outcomes of high clinical relevance in older adults; assessment of MetS based on updated harmonized criteria, allowing for comparison across studies; high retention and intervention adherence rates; and longer follow-up than other randomized trials of physical activity in older populations. Several limitations should also be noted, in addition to this being a post-hoc analysis, possibly insufficiently powered to detect some subgroup differences. The 2.7 years of average follow-up is short relative to the 9-year life expectancy of the LIFE cohort and may be too short to yield significant benefits (Pahor et al., 2014). Information was not available on the duration of MetS, which may be associated with muscle quality and strength, cardiorespiratory fitness, and/or other mechanisms underlying diminished lower-extremity function and possibly influencing the likelihood of benefit from the PA intervention. Because the participants were enrolled in a randomized controlled trial aimed at preventing mobility decline in older, sedentary individuals with an SPPB score of 9 or less, the results may not be generalizable to individuals who do not meet these criteria. However, the results are likely to be representative of a considerable segment of community-living older adults, many of whom are sedentary and have functional limitations.
In conclusion, structured, moderate-intensity physical activity appears to confer a benefit in walking speed but not in lower-extremity function as assessed by SPPB scores in sedentary, functionally-vulnerable individuals with MetS, but this benefit was not observed for either walking speed or SPPB score among individuals without MetS. The findings from this study support further evaluation of this physical activity program as a promising cost-effective strategy for improving walking speed among vulnerable older adults with MetS. In addition, investigations are needed to better understand the mechanisms underlying impairments in lower-extremity function among metabolically-healthy older adults.
Supplementary Material
Acknowledgments
The LIFE Study is funded by a National Institutes of Health/National Institute on Aging Cooperative Agreement U01AG22376 and a supplement from the National Heart, Lung and Blood Institute (3U01AG022376). It is sponsored in part by the Intramural Research Program, National Institute on Aging, National Institutes of Health. Complete acknowledgments and funding information are shown in Supplementary File 3 and are available at: https://www.thelifestudy.org/secure/documents.
Dr. Botoseneanu was funded by grants AG024824 from the University of Michigan - Claude D. Pepper Older Americans Independence Center; UL1TR000433 from the Michigan Institute for Clinical and Health Research.
Dr. Gill is supported by the Yale Claude D. Pepper Older Americans Independence Center (P30AG21342).
Footnotes
All authors meet the criteria for authorship stated in the Uniform Requirements for Manuscripts Submitted to Biomedical Journals.
Supplementary data to this article can be found online at https://doi.org/10.1016/j.exger.2021.111343.
Data integrity statement
Haiying Chen and Walter T. Ambrosius confirm that they had full access to all of the data in the study and take responsibility for the integrity of the data and the accuracy of the data analysis.
Sponsor’s role
None.
Declaration of competing interest
The authors are not aware of any potential conflict of interest. Dr. Anton reports paid travel to several conferences and scientific meetings on obesity, metabolism, and intermittent fasting.
References
- Abellan Van Kan G, Rolland Y, Andrieu S, et al. , 2009. Gait speed at usual pace as a predictor of adverse outcomes in community-dwelling older people an International Academy on Nutrition and Aging (IANA) Task Force. J. Nutr. Health Aging 13 (10), 881–889. 10.1007/s12603-009-0246-z. [DOI] [PubMed] [Google Scholar]
- Aboyans V, Criqui MH, Abraham P, et al. , 2012. Measurement and interpretation of the ankle-brachial index: a scientific statement from the American Heart Association. Circulation 126 (24), 2890–2909. 10.1161/CIR.0b013e318276fbcb. [DOI] [PubMed] [Google Scholar]
- Alberti KGMM, Eckel Robert H, Grundy Scott M, et al. , 2009. Harmonizing the metabolic syndrome. Circulation 120 (16), 1640–1645. 10.1161/CIRCULATIONAHA.109.192644. [DOI] [PubMed] [Google Scholar]
- Beavers KM, Hsu F-C, Houston DK, et al. , 2013a. The role of metabolic syndrome, adiposity, and inflammation in physical performance in the health ABC study. J. Gerontol. Ser. A 68 (5), 617–623. 10.1093/gerona/gls213. [DOI] [PMC free article] [PubMed] [Google Scholar]
- Beavers KM, Ambrosius WT, Nicklas BJ, Rejeski WJ, 2013b. Independent and combined effects of physical activity and weight loss on inflammatory biomarkers in overweight and obese older adults. J. Am. Geriatr. Soc 61 (7), 1089–1094. 10.1111/jgs.12321. [DOI] [PMC free article] [PubMed] [Google Scholar]
- Borg GA, 1982. Psychophysical bases of perceived exertion. Med. Sci. Sports Exerc 14 (5), 377–381. [PubMed] [Google Scholar]
- Botoseneanu A, Chen H, Ambrosius WT, et al. , 2017. Effect of metabolic syndrome on the mobility benefit of a structured physical activity intervention—the lifestyle interventions and independence for elders randomized clinical trial. J. Am. Geriatr. Soc 65 (6), 1244–1250. 10.1111/jgs.14793. [DOI] [PMC free article] [PubMed] [Google Scholar]
- Carriere I, Peres K, Ancelin ML, et al. , 2014. Metabolic syndrome and disability: findings from the prospective three-city study. J. Gerontol. Biol. Sci. Med. Sci 69 (1), 79–86. 10.1093/gerona/glt101. [DOI] [PMC free article] [PubMed] [Google Scholar]
- de Carvalho DHT, Scholes S, Santos JLF, de Oliveira C, Alexandre T. da S., 2019. Does abdominal obesity accelerate muscle strength decline in older adults? Evidence from the English longitudinal study of ageing. J. Gerontol. Ser. A 74 (7), 1105–1111. 10.1093/gerona/gly178. [DOI] [PMC free article] [PubMed] [Google Scholar]
- Catalán V, Frühbeck G, Gómez-Ambrosi J, 2018. Chapter 8 - inflammatory and oxidative stress markers in skeletal muscle of obese subjects. In: del Moral AM, Aguilera García CM (Eds.), Obesity Academic Press, pp. 163–189. 10.1016/B978-0-12-812504-5.00008-8. [DOI] [Google Scholar]
- Cawthon PM, Fox KM, Gandra SR, et al. , 2011. Clustering of strength, physical function, muscle, and adiposity characteristics and risk of disability in older adults. J. Am. Geriatr. Soc 59 (5), 781–787. 10.1111/j.1532-5415.2011.03389.x. [DOI] [PMC free article] [PubMed] [Google Scholar]
- Collins KH, Herzog W, MacDonald GZ, et al. , 2018. Obesity, metabolic syndrome, and musculoskeletal disease: common inflammatory pathways suggest a central role for loss of muscle integrity. In: Frontiers in Physiology. Frontiers, vol 9. Accessed June 23, 2020. . [DOI] [PMC free article] [PubMed] [Google Scholar]
- Crews JE, Campbell VA, 2004. Vision impairment and hearing loss among community-dwelling older Americans: implications for health and functioning. Am. J. Public Health 94 (5), 823–829. 10.2105/AJPH.94.5.823. [DOI] [PMC free article] [PubMed] [Google Scholar]
- Ekelund U, Franks PW, Sharp S, Brage S, Wareham NJ, 2007. Increase in physical activity energy expenditure is associated with reduced metabolic risk independent of change in fatness and fitness. Diabetes Care 30 (8), 2101–2106. 10.2337/dc07-0719. [DOI] [PubMed] [Google Scholar]
- Espeland MA, Lipska K, Miller ME, et al. , 2017. Effects of physical activity intervention on physical and cognitive function in sedentary adults with and without diabetes. J. Gerontol. Ser. A 72 (6), 861–866. 10.1093/gerona/glw179. [DOI] [PMC free article] [PubMed] [Google Scholar]
- Fielding RA, Rejeski WJ, Blair S, et al. , 2011. The lifestyle interventions and Independence for elders study: design and methods. J. Gerontol. Ser. A 66A (11), 1226–1237. 10.1093/gerona/glr123. [DOI] [PMC free article] [PubMed] [Google Scholar]
- Groessl EJ, Kaplan RM, Rejeski WJ, et al. , 2007. Health-related quality of life in older adults at risk for disability. Am. J. Prev. Med 33 (3), 214–218. 10.1016/j.amepre.2007.04.031. [DOI] [PMC free article] [PubMed] [Google Scholar]
- Guralnik JM, Simonsick EM, Ferrucci L, et al. , 1994. A short physical performance battery assessing lower extremity function: association with self-reported disability and prediction of mortality and nursing home admission. J. Gerontol 49 (2), M85–M94. 10.1093/geronj/49.2.M85. [DOI] [PubMed] [Google Scholar]
- Guralnik JM, Ferrucci L, Simonsick EM, Salive ME, Wallace RB, 1995. Lower-extremity function in persons over the age of 70 years as a predictor of subsequent disability. N. Engl. J. Med 332 (9), 556–562. 10.1056/NEJM199503023320902. [DOI] [PMC free article] [PubMed] [Google Scholar]
- Hassinen M, Lakka TA, Hakola L, et al. , 2010. Cardiorespiratory fitness and metabolic syndrome in older men and women: the dose responses to exercise training (DR’s EXTRA) study. Diabetes Care 33 (7), 1655–1657. 10.2337/dc10-0124. [DOI] [PMC free article] [PubMed] [Google Scholar]
- Healy GN, Matthews CE, Dunstan DW, Winkler EAH, Owen N, 2011. Sedentary time and cardio-metabolic biomarkers in US adults: NHANES 2003–06. Eur. Heart J 32 (5), 590–597. 10.1093/eurheartj/ehq451. [DOI] [PMC free article] [PubMed] [Google Scholar]
- Hirode G, Wong RJ, 2020. Trends in the prevalence of metabolic syndrome in the United States, 2011–2016. JAMA 323 (24), 2526–2528. 10.1001/jama.2020.4501. [DOI] [PMC free article] [PubMed] [Google Scholar]
- Kritchevsky SB, Lovato L, Handing EP, et al. , 2017. Exercise’s effect on mobility disability in older adults with and without obesity: the LIFE study randomized clinical trial. Obesity 25 (7), 1199–1205. 10.1002/oby.21860. [DOI] [PMC free article] [PubMed] [Google Scholar]
- Kuo CK, Lin LY, Yu YH, Wu KH, Kuo HK, 2009. Inverse association between insulin resistance and gait speed in nondiabetic older men: results from the US National Health and Nutrition Examination Survey (NHANES) 1999–2002. BMC Geriatr 9 (1), 49–55. [DOI] [PMC free article] [PubMed] [Google Scholar]
- Kwon S, Perera S, Pahor M, et al. , 2009. What is a meaningful change in physical performance? Findings from a clinical trial in older adults (the LIFE-P study). J. Nutr. Health Aging 13 (6), 538–544. 10.1007/s12603-009-0104-z. [DOI] [PMC free article] [PubMed] [Google Scholar]
- Laudisio A, Bandinelli S, Gemma A, Ferrucci L, Incalzi RA, 2014. Metabolic syndrome and functional ability in older age: the InCHIANTI study. Clin. Nutr 33 (4), 626–633. [DOI] [PMC free article] [PubMed] [Google Scholar]
- Legrand D, Vaes B, Matheï C, Adriaensen W, Pottelbergh GV, Degryse J-M, 2014. Muscle strength and physical performance as predictors of mortality, hospitalization, and disability in the oldest old. J. Am. Geriatr. Soc 62 (6), 1030–1038. 10.1111/jgs.12840. [DOI] [PubMed] [Google Scholar]
- Mankowski RT, Anton SD, Aubertin-Leheudre M, 2015. The role of muscle mass, muscle quality, and body composition in risk for the metabolic syndrome and functional decline in older adults. Curr. Geriatr. Rep 4 (3), 221–228. 10.1007/s13670-015-0132-y. [DOI] [Google Scholar]
- Marsh AP, Lovato LC, Glynn NW, et al. , 2013. Lifestyle interventions and independence for elders study: recruitment and baseline characteristics. J. Gerontol. Ser. A 68 (12), 1549–1558. 10.1093/gerona/glt064. [DOI] [PMC free article] [PubMed] [Google Scholar]
- Matthew CE, 2005. Calibration of accelerometer output for adults. Med. Sci. Sports Exerc 37 (11 Suppl), S512–S522. 10.1249/01.mss.0000185659.11982.3d. [DOI] [PubMed] [Google Scholar]
- Newman AB, Simonsick EM, Naydeck BL, et al. , 2006. Association of long-distance corridor walk performance with mortality, cardiovascular disease, mobility limitation, and disability. JAMA 295 (17), 2018–2026. 10.1001/jama.295.17.2018. [DOI] [PubMed] [Google Scholar]
- Okoro CA, Zhong Y, Ford ES, Balluz LS, Strine TW, Mokdad AH, 2006. Association between the metabolic syndrome and its components and gait speed among U.S. adults aged 50 years and older: a cross-sectional analysis. BMC Public Health 6 (1), 282. 10.1186/1471-2458-6-282. [DOI] [PMC free article] [PubMed] [Google Scholar]
- Ostir GV, Volpato S, Fried LP, Chaves P, Guralnik JM, 2002. Reliability and sensitivity to change assessed for a summary measure of lower body function: results from the Women’s Health and Aging Study. J. Clin. Epidemiol 55 (9), 916–921. 10.1016/S0895-4356(02)00436-5. [DOI] [PubMed] [Google Scholar]
- Pahor M, Blair SN, Espeland M, et al. , 2006. Effects of a physical activity intervention on measures of physical performance: results of the lifestyle interventions and independence for Elders Pilot (LIFE-P) study. J. Gerontol. Biol. Sci. Med. Sci 61 (11), 1157–1165. [DOI] [PubMed] [Google Scholar]
- Pahor M, Guralnik JM, Ambrosius WT, et al. , 2014. Effect of structured physical activity on prevention of major mobility disability in older adults: the LIFE study randomized clinical trial. JAMA 311 (23), 2387–2396. [DOI] [PMC free article] [PubMed] [Google Scholar]
- Peixoto JG, Dias JMD, Dias RC, Fonseca S.T. da, Teixeira-Salmela LF, 2011. Relationships between measures of muscular performance, proprioceptive acuity, and aging in elderly women with knee osteoarthritis. Arch. Gerontol. Geriatr 53 (2), e253–e257. 10.1016/j.archger.2011.05.008. [DOI] [PubMed] [Google Scholar]
- Perera S, Mody SH, Woodman RC, Studenski SA, 2006. Meaningful change and responsiveness in common physical performance measures in older adults. J. Am. Geriatr. Soc 54 (5), 743–749. 10.1111/j.1532-5415.2006.00701.x. [DOI] [PubMed] [Google Scholar]
- Porter Starr KN, McDonald SR, Bales CW, 2014. Obesity and physical frailty in older adults: a scoping review of lifestyle intervention trials. J. Am. Med. Dir. Assoc 15 (4), 240–250. 10.1016/j.jamda.2013.11.008. [DOI] [PMC free article] [PubMed] [Google Scholar]
- Rosso AL, Studenski SA, Chen WG, et al. , 2013. Aging, the central nervous system, and mobility. J. Gerontol. Ser. A 68 (11), 1379–1386. 10.1093/gerona/glt089. [DOI] [PMC free article] [PubMed] [Google Scholar]
- Santanasto AJ, Glynn NW, Lovato LC, et al. , 2017. Effect of physical activity versus health education on physical function, grip strength and mobility. J. Am. Geriatr. Soc 65 (7), 1427–1433. 10.1111/jgs.14804. [DOI] [PMC free article] [PubMed] [Google Scholar]
- Sayers SP, Guralnik JM, Newman AB, Brach JS, Fielding RA, 2006. Concordance and discordance between two measures of lower extremity function: 400 meter self-paced walk and SPPB. Aging Clin. Exp. Res 18 (2), 100–106. 10.1007/BF03327424. [DOI] [PubMed] [Google Scholar]
- Shin D, Kongpakpaisarn K, Bohra C, 2018. Trends in the prevalence of metabolic syndrome and its components in the United States 2007–2014. Int. J. Cardiol 259, 216–219. 10.1016/j.ijcard.2018.01.139. [DOI] [PubMed] [Google Scholar]
- Shumway-Cook A, Guralnik JM, Phillips CL, et al. , 2007. Age-associated declines in complex walking task performance: the walking InCHIANTI toolkit. J. Am. Geriatr. Soc 55 (1), 58–65. 10.1111/j.1532-5415.2006.00962.x. [DOI] [PMC free article] [PubMed] [Google Scholar]
- Stewart AL, Mills KM, King AC, Haskell WL, Gillis D, Ritter PL, 2001. CHAMPS physical activity questionnaire for older adults: outcomes for interventions. Med. Sci. Sports Exerc 33 (7), 1126–1141. 10.1097/00005768-200107000-00010. [DOI] [PubMed] [Google Scholar]
- Studenski S, Perera S, Patel K, et al. , 2011. Gait speed and survival in older adults. JAMA 305 (1), 50–58. 10.1001/jama.2010.1923. [DOI] [PMC free article] [PubMed] [Google Scholar]
- Teng EL, Chui HC, 1987. The Modified Mini-Mental State (3MS) examination. J. Clin. Psychiatry 48 (8), 314–318. [PubMed] [Google Scholar]
- Villareal DT, Chode S, Parimi N, et al. , 2011. Weight loss, exercise, or both and physical function in obese older adults. N. Engl. J. Med 364 (13), 1218–1229. 10.1056/NEJMoa1008234. [DOI] [PMC free article] [PubMed] [Google Scholar]
- Volpato S, Cavalieri M, Sioulis F, et al. , 2011. Predictive value of the short physical performance battery following hospitalization in older patients. J. Gerontol. Ser. A 66A (1), 89–96. 10.1093/gerona/glq167. [DOI] [PMC free article] [PubMed] [Google Scholar]
- Ward RE, Boudreau RM, Caserotti P, et al. , 2014. Sensory and motor peripheral nerve function and incident mobility disability. J. Am. Geriatr. Soc 62 (12), 2273–2279. 10.1111/jgs.13152. [DOI] [PMC free article] [PubMed] [Google Scholar]
- Ward RE, Caserotti P, Cauley JA, et al. , 2015. Mobility-related consequences of reduced lower-extremity peripheral nerve function with age: a systematic review. Aging Dis. 7 (4), 466–478. 10.14336/AD.2015.1127. [DOI] [PMC free article] [PubMed] [Google Scholar]
Associated Data
This section collects any data citations, data availability statements, or supplementary materials included in this article.