

Abstract
Background
Many adults have risk factors for non-alcoholic fatty liver disease (NAFLD). Screening all adults with risk factors for NAFLD using imaging is not feasible.
Objective
To develop a practical scoring tool for predicting NAFLD using participant demographics, medical history, anthropometrics, and lab values.
Design
Cross-sectional.
Participants
Data came from 6194 white, African American, Hispanic, and Chinese American participants from the Multi-Ethnic Study of Atherosclerosis cohort, ages 45–85 years.
Main Measures
NAFLD was identified by liver computed tomography (≤ 40 Hounsfield units indicating > 30% hepatic steatosis) and data on 14 predictors was assessed for predicting NAFLD. Random forest variable importance was used to identify the minimum subset of variables required to achieve the highest predictive power. This subset was used to derive (n = 4132) and validate (n = 2063) a logistic regression–based score (NAFLD-MESA Index). A second NAFLD-Clinical Index excluding laboratory predictors was also developed.
Key Results
NAFLD prevalence was 6.2%. The model included eight predictors: age, sex, race/ethnicity, type 2 diabetes, smoking history, body mass index, gamma-glutamyltransferase (GGT), and triglycerides (TG). The NAFLD-Clinical Index model excluded GGT and TG. In the NAFLD-MESA model, the derivation set achieved an AUCNAFLD-MESA = 0.83 (95% CI, 0.81 to 0.86), and the validation set an AUCNAFLD-MESA = 0.80 (0.77 to 0.84). The NAFLD-Clinical Index model was AUCClinical = 0.78 [0.75 to 0.81] in the derivation set and AUCClinical = 0.76 [0.72 to 0.80] in the validation set (pBonferroni-adjusted < 0.01).
Conclusions
The two models are simple but highly predictive tools that can aid clinicians to identify individuals at high NAFLD risk who could benefit from imaging.
Supplementary Information
The online version contains supplementary material available at 10.1007/s11606-020-06426-5.
KEY WORDS: non-alcoholic fatty liver disease, prediction model, anthropometry, biomarkers, race/ethnicity
INTRODUCTION
Non-alcoholic fatty liver disease (NAFLD) is the most common chronic liver disease in westernized societies,1 with a global prevalence of 25%.2 NAFLD represents a spectrum of disease from fat accumulation in the liver, to inflammation and progressive fibrosis, and eventual progression to cirrhosis and hepatocellular carcinoma.3–5 In addition, recent evidence showed that NAFLD complications were not only confined to advanced liver disease but may also contribute to major extrahepatic conditions.6,7 These include a 2-fold increase in the risk of incident type 2 diabetes,8,9 and furthermore, cardiovascular disease (CVD) and extrahepatic malignancies account for a greater proportion of mortality than liver disease.10
To diagnose NAFLD, there must be evidence of hepatic steatosis by imaging or histology, and absence of secondary causes.4 Performing a liver biopsy, considered the gold standard for NAFLD diagnosis, would be costly and unnecessarily invasive and is not feasible in the general population.4 Furthermore, in view of the high prevalence of overweight and the metabolic syndrome, assessing all patients at risk for NAFLD using imaging is likewise not feasible.11 A simplified algorithm to screen patients at high NAFLD risk is therefore desirable. In clinical settings, clinicians could prioritize who should receive an imaging study. Likewise, in research settings, investigators could identify high-risk study participants.
Previous risk scores have been developed for detecting hepatic steatosis12–17 and some have been externally validated.18–22 However, all were developed in racially homogeneous populations so it is unclear how they would perform in a heterogeneous population in the USA. Furthermore, all risk scores included clinical laboratory markers, which are not always readily available. The aim of this study was therefore to develop, in a large multi-ethnic cohort in the USA, a practical scoring tool for predicting NAFLD risk based on participant demographics, medical history, anthropometrics, and routine lab values, referred to as the NAFLD-MESA Index. Furthermore, since laboratory tests are sometimes not readily available or feasible to measure, a secondary aim was to develop a second NAFLD-Clinical Index without laboratory variables. And lastly, we compare the performance of our two models against the fatty liver index (FLI),12 which we additionally validate in our sample, to quantify any observed difference in classification performance.
METHODS
Data Source
The Multi-Ethnic Study of Atherosclerosis (MESA)23 is a well-characterized cohort of 6814 participants aged 45–85 and free of known CVD. Established in 2000, participants were recruited from six US communities (Columbia University, New York; Johns Hopkins University, Baltimore; Northwestern University, Chicago; UCLA, Los Angeles; University of Minnesota, Twin Cities; and Wake Forest University, Winston-Salem). Racial/ethnic distribution was as follows: 38% white, 28% African American, 22% Hispanic, and 12% Chinese American. Informed consent was obtained from all study participants and institutional review board (IRB) approval was obtained by the MESA sites. Ethics approval for the use of anonymized data was obtained from the UCSF IRB on 2 January 2018 (16-21085).
Sample Population
We excluded participants whose computed tomography (CT) imaging did not extend inferiorly sufficiently to measure liver fat attenuation (n = 78); participants with a high alcohol use (average > 1 serving/day in women and > 2 servings/day in men) (n = 343), liver cirrhosis (n = 9), and use of oral steroids or class 3 antiarrhythmic medications (n = 103).24 Our final sample size was 6194 from the baseline visit between 2000 and 2002.
Outcome Measure: NAFLD
At the baseline visit, participants received two consecutive CT scans, which included liver images.24,25 Liver attenuation by CT scan has been shown to be inversely correlated with liver fat deposition by liver biopsy (correlation coefficient: − 0.9; p value < 0.001), showing that CT scanning provides a useful non-invasive method for identifying moderate to severe fatty liver.26 We used a previously validated threshold of ≤ 40 Hounsfield units (HU) for the identification of a binary classification of moderate to severe hepatic steatosis (> 30% liver fat).27,28
Potential Predictors
Fourteen candidate predictors were identified a priori based on their known association with NAFLD29,30 or components of the metabolic syndrome31 and their availability. These included the following: body mass index (BMI), waist circumference (WC), waist-to-hip ratio, age, sex, race/ethnicity, education, smoking history, recent weight change, gamma-glutamyltransferase (GGT), triglycerides, type 2 diabetes, high-density lipoprotein (HDL)-cholesterol, and hypertension.
Predictor Measurements
Anthropometric measures were taken using standardized procedures.32 BMI was categorized according to established criteria33–35: normal weight (< 25 kg/m2), overweight (25–< 30 kg/m2), and obesity (30–< 35 kg/m2 grade 1, ≥ 35 kg/m2 grade 2) for white, African American, and Hispanic participants, and normal weight (< 23 kg/m2), overweight (23–< 27.5 kg/m2), obesity (≥ 27.5 kg/m2) for Chinese Americans. WC was measured and categorized into three groups36: < 88, 88–102, > 102 cm. Age was categorized into decade groups and further modified into three categories to maximize discrimination ability: 45–< 65, 65–< 75, and 75–85. Sex was self-reported. Highest achieved education was categorized into the following: less than high school, high school, some college, bachelor’s degree, or higher. Race/ethnicity was self-reported. Smoking history was categorized as never, former, or current. Recent weight change was calculated comparing measured weight at study baseline against self-reported highest weight over the prior 3 years and calculated as percentage of weight loss/gain. GGT was categorized into quartiles according to units per liter (< 5, 5–< 8, 8–< 14, and ≥ 14). Triglycerides were measured in the fasted state and initially categorized according to established criteria,36 but then modified into the following three categories to improve discrimination: < 75, 75–< 150, ≥ 150 mg/dL. Type 2 diabetes was defined as fasting glucose ≥ 126 mg/dL and/or on any diabetes treatment. HDL cholesterol was classified using the ATP III criteria < 40 mg/dL and ≥ 60,36 with intermediate categories 40–49 and 50–59 mg/dL. Resting blood pressure was measured in the seated position. Missing data was observed in less than 2% of these predictor variables.
Statistical Analysis of Characteristics
Baseline characteristics, anthropometric data, and clinical parameters are reported as means and SD or median and interquartile range depending on their distribution, or as counts and proportions.
Risk Score Derivation
To select the optimal subset of predictor variables that minimize error in NAFLD prediction, we used a conditional random forest classification algorithm that accounts for variable correlation in the importance calculation. Estimation was based on the R party package37 using the full sample. Random forest classification is a nonparametric, ensemble classification tree method that incorporates bootstrap aggregation in the assessment of variable importance.38 From the original 14 variables, the random forest identified nine predictor variables that were most influential in minimizing prediction error. WC was identified as an important variable but was subsequently removed from the final set of predictor variables because it is not regularly or accurately measured in routine clinical settings; furthermore, including it did not significantly improve the model performance, thus leaving eight variables for the final model.
To develop and validate our final model, called the NAFLD-MESA index, we selected a random 2/3 of the sample (n = 4151) for model training and 1/3 (n = 2063) for model validation. A risk score for the final multivariate model was derived using a modified version of the Framingham Heart Study approach.39 Briefly, a logistic regression model was fitted to the NAFLD outcome using the eight predictors. Model coefficients were then converted to points, with 1 point indicating the risk equivalent to the smallest coefficient (type 2 diabetes). A total risk score was then calculated for each participant by adding all points from the eight variables. A detailed algorithm describing risk score point derivation is included in the Appendix in the Supplementary Information. We assessed presence of two-way multiplicative interaction in separate models using likelihood ratio tests, including between race and BMI, sex and BMI, sex and age category, and sex and smoking. None of these was statistically significant at the 5% level, so the final model included only main effects.
We used a similar approach to construct the second model excluding laboratory variables (GGT and TG). The smallest coefficient in this case was being a former smoker. A chi-squared test comparing the estimated AUC was used to compare the two models; we present Bonferroni-adjusted p values given that multiple pairwise differences were tested, including stratified models by race/ethnicity.
Internal Discrimination and Calibration
To assess discrimination ability, we constructed ROC curves and calculated sensitivity, specificity, interval likelihood ratios, and estimated post-test probability of NAFLD at various intervals. The intervals were selected from visually inspecting the ROC curves to identify slope changes. Interval likelihood ratios were obtained by dividing the proportion of participants with NAFLD over the proportion of participants without NAFLD in each interval. Calibration performance was assessed on the validation sample using Hosmer-Lemeshow goodness-of-fit measures40 and Brier scores41 and graphically using a calibration plot by grouping participants into quintiles of NAFLD risk and plotting the average predicted risk of each quintile against the average observed risk.
Model Performance Compared to the Fatty Liver Index
We compared the performance of our NAFLD-MESA and NAFLD-Clinical Index models against the FLI. The FLI includes BMI (kg/m2), WC (cm), and log-transformed serum TG (mg/dL) and GGT (U/L)12 to obtain a score between 0 and 100 based on a logistic model. We compared the AUC of our models against the FLI using a chi-squared test. In sensitivity analysis, for a fairer comparison, we modified the FLI predictors (e.g., made them categorical) to potentially better fit our data and improve its discrimination performance. Analyses were conducted using R version 3.6.1 (Vienna, Austria) and Stata 15.0 (College Station, TX, USA).
RESULTS
Participant Characteristics
A total of 6194 participants were included in the study. Participants included in the derivation and validation sets had similar distributions of important covariates (Table 1). Participants with NAFLD were younger and had more components of the metabolic syndrome including a higher BMI, WC, TG, systolic blood pressure, and GGT. In addition, participants with NAFLD were more likely to be Hispanic, have a lower educational background, have type 2 diabetes, and be never smokers.
Table 1.
Characteristics of Study Participants With and Without NAFLD in the Development and Validation Samples
| Characteristic | Development sample (n = 4132) | Validation sample (n = 2063) | ||
|---|---|---|---|---|
| NAFLD (n = 257) 6.2% | Non-NAFLD (n = 3874) 93.8% | NAFLD (n = 128) 6.2% | Non-NAFLD (n = 1935) 93.8% | |
| Age, years | 59 (8) | 62 (10) | 59 (9) | 63 (10) |
| Sex | ||||
| Female | 160 (7.3) | 2040 (92.7) | 66 (6.1) | 1024 (93.9) |
| Male | 97 (5.0) | 1834 (95.0) | 62 (6.4) | 911 (93.6) |
| Race/ethnicity* | ||||
| White | 93 (6.2) | 1420 (93.9) | 39 (5.3) | 702 (94.7) |
| African American | 40 (3.4) | 1137 (96.6) | 29 (5.0) | 553 (95.0) |
| Hispanic | 94 (10.0) | 836 (90.0) | 45 (9.3) | 437 (90.7) |
| Chinese American | 31 (6.1) | 481 (93.9) | 15 (5.8) | 243 (94.2) |
| BMI, kg/m2 | 32 (6) | 28 (5) | 33 (6) | 28 (5) |
| Waist circumference, cm | 107 [97–118] | 97 [88–106] | 108 [98–118] | 97 [88–106] |
| Type 2 diabetes† | 57 (22) | 481 (12) | 31 (24) | 248 (13) |
| Triglycerides‡, mg/dL | 154 [118–221] | 108 [77–158] | 163 [116–221] | 110 [77–157] |
| GGT, U/L | 13 [9–22] | 8 [5–13] | 13 [9–21] | 8 [5–13] |
| HDL cholesterol‡, mg/dL | 43 [37–50] | 48 [40–58] | 41 [36–48] | 48 [40–59] |
| Systolic blood pressure, mm Hg | 127 [116–142] | 123 [111–140] | 130 [116–143] | 124 [111–140] |
| Diastolic blood pressure, mm Hg | 73 [66–81] | 72 [65–78] | 74 [67–82] | 72 [67–79] |
| Education ≥ bachelor’s degree | 73 (28) | 1346 (35) | 35 (27) | 680 (35) |
| Cigarette smoking history | ||||
| Never | 153 (60) | 1990 (51) | 69 (54) | 997 (51) |
| Former | 82 (32) | 1396 (36) | 41 (32) | 710 (37) |
| Current | 22 (8) | 488 (13) | 18 (14) | 228 (12) |
| Weight change, % | − 1 [− 4–0] | − 2 [− 5–0] | 0 [− 3–0] | − 2 [− 5–0] |
Results are presented as mean (SD) or median [interquartile range] for continuous variables, or n (%) for categorical variables. BMI, body mass index; GGT, gamma-glutamyltransferase; HDL, high-density lipoprotein; MET-min, metabolic equivalent minutes
*Self-reported
†Defined as having fasting blood glucose ≥ 126 mg/dL, or on anti-diabetic medications
‡Fasting sample
NAFLD Predictors
The final logistic regression model for the NAFLD-MESA model included BMI, GGT, TG, sex, smoking, age, type 2 diabetes, and race/ethnicity. Our second NAFLD-Clinical Index model excluded GGT and TG (Table 2). When coefficients were converted to risk score points, high levels of TG or BMI had the greatest risk contribution. In the second NAFLD-Clinical Index model, high BMI and younger age category had the greatest risk contributions.
Table 2.
NAFLD-MESA Index and NAFLD-Clinical Index Predictors (Derivation Set, n = 4131)
| Predictor | NAFLD-MESA Index | NAFLD-Clinical Index | ||
|---|---|---|---|---|
| Coefficient (95% CI) | Points | Coefficient (95% CI) | Points | |
| BMI category (kg/m2)* | ||||
| Normal | 0 | 0 | 0 | 0 |
| Overweight | 0.9 (0.3, 1.5) | 3 | 1.3 (0.7, 1.9) | 6 |
| Obese, grade 1 | 1.6 (1.0, 2.1) | 5 | 2.1 (1.6, 2.7) | 9 |
| Obese, grade 2 | 2.1 (1.5, 2.7) | 6 | 2.7 (2.1, 3.3) | 11 |
| GGT quartile (U/L) | ||||
| First (< 5) | 0 | 0 | – | – |
| Second (5–7.9) | 0.6 (0, 1.1) | 2 | – | – |
| Third (8–13.9) | 1.3 (0.8, 1.9) | 4 | – | – |
| Fourth (≥ 14) | 1.8 (1.3, 2.4) | 5 | – | – |
| Triglycerides† (mg/dL) | ||||
| < 75 | 0 | 0 | – | – |
| 75–149 | 1.8 (1.0, 2.5) | 5 | – | – |
| ≥ 150 | 2.0 (1.2, 2.8) | 6 | – | – |
| Female sex | 0.6 (0.3, 0.9) | 2 | 0.3 (0.0, 0.5) | 1 |
| Cigarette smoking history | ||||
| Never | 0.8 (0.3, 1.3) | 2 | 0.5 (0.0, 1.0) | 2 |
| Former | 0.5 (0.0, 1.0) | 1 | 0.2 (− 0.3, 0.7) | 1 |
| Current | 0 | 0 | 0 | 0 |
| Age category (years) | ||||
| 44–64 | 1.6 (0.9, 2.4) | 5 | 1.8 (1.0, 2.5) | 8 |
| 65–74 | 1.3 (0.5, 2.1) | 4 | 1.3 (0.6, 2.1) | 6 |
| 75–84 | 0 | 0 | 1 | 0 |
| Type 2 diabetes‡ | 0.3 (0, 0.7) | 1 | 0.5 (0.2, 0.8) | 2 |
| Race/ethnicity§ | ||||
| White | 0.9 (0.5, 1.3) | 3 | 1.0 (0.6, 1.4) | 4 |
| African American | 0 | 0 | 0 | 0 |
| Hispanic | 1.0 (0.6, 1.4) | 3 | 1.3 (0.9, 1.6) | 5 |
| Chinese American | 1.0 (0.5, 1.6) | 3 | 1.3 (0.8, 1.8) | 6 |
*BMI cut-points are < 25 normal, 25–< 30 overweight, 30–< 35 obese grade 1 for whites, African Americans, and Hispanics, and ≥ 35 obese, grade 2 for whites, African Americans, and Hispanics. < 23 normal, 23–< 27.5 overweight, and ≥ 27.5 obese for Chinese Americans
†Fasting sample
‡Defined as having fasting blood glucose ≥ 126 mg/dL, or on anti-diabetic medications
§Self-reported
Discrimination
ROC curves were constructed using the point-based system and AUC estimated with NAFLD. In our full NAFLD-MESA model, the derivation set achieved an AUCNAFLD-MESA = 0.83 (95% CI, 0.81 to 0.86) and the validation set an AUCNAFLD-MESA = 0.80 (0.77 to 0.84) (Fig. 1). Our NAFLD-Clinical Index model performed marginally lower AUCClinical = 0.78 [0.75 to 0.81] in the derivation set and AUCClinical = 0.76 [0.72 to 0.80] in the validation set (pBonferroni-adjusted < 0.01) (Fig. 2).
Figure 1.

Area under the receiver operating characteristic curve using the point system on the derivation (n = 4151) and validation (n = 2063) model 1: NAFLD-MESA. AUC, area under the curve.
Figure 2.
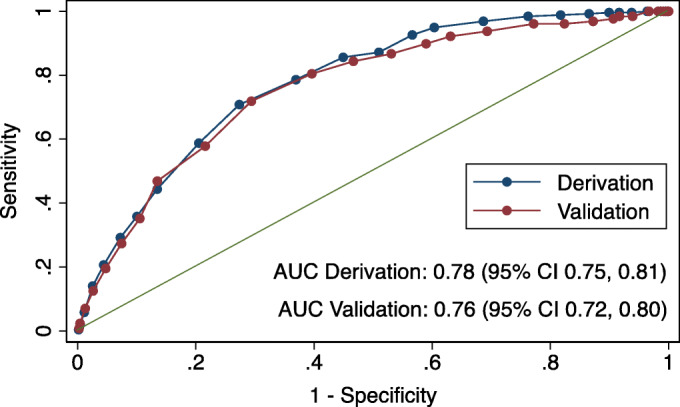
Area under the receiver operating characteristic curve using the point system on the derivation (n = 4151) and validation (n = 2063) model 2: NAFLD-Clinical Index. AUC, area under the curve.
We provided the interval likelihood ratio and post-test probability at each two-unit interval for both models (Table 3). We considered a post-test probability of NAFLD greater than the average pre-test probability (prevalence) as suitable cut-offs for higher suspicion of NAFLD. In the NAFLD-MESA index, this corresponded to a binary cut-off of ≥ 22 points which had a sensitivity of 75%, a specificity of 72%, and a post-test probability of > 8%. Similarly, in our NAFLD-Clinical Index, the corresponding binary cut-off was ≥ 20 points, which had a sensitivity of 80%, specificity of 60%, and post-test probability of > 8%.
Table 3.
NAFLD-MESA Index and NAFLD-Clinical Index Interval Table
| Interval | % of the population in interval | % D+ in interval | % D− in interval | Interval LR | Post-test probability in interval (%) |
|---|---|---|---|---|---|
| NAFLD-MESA Index | |||||
| 26 to 30 | 7 | 30 | 5 | 5.9 | 28 |
| 24 to < 26 | 10 | 26 | 9 | 2.9 | 16 |
| 22 to < 24 | 14 | 20 | 14 | 1.4 | 8 |
| 20 to < 22 | 17 | 13 | 17 | 0.7 | 5 |
| 18 to < 20 | 15 | 5 | 15 | 0.3 | 2 |
| 16 to < 18 | 13 | 4 | 13 | 0.3 | 2 |
| NAFLD-Clinical Index | |||||
| 24 to 30 | 12 | 35 | 11 | 3.3 | 18 |
| 22 to < 24 | 12 | 23 | 11 | 2.0 | 12 |
| 20 to < 22 | 18 | 23 | 18 | 1.3 | 8 |
| 18 to < 20 | 13 | 6 | 13 | 0.5 | 3 |
| 16 to < 18 | 10 | 5 | 10 | 0.5 | 3 |
| 14 to < 16 | 13 | 4 | 14 | 0.3 | 2 |
D+, disease positive (NAFLD ≤ 40 Hounsfield units in CT scan); D−, disease negative (> 40 Hounsfield units in CT scan); Interval LR, interval likelihood ratio
Italicized entries reflect the cut-off at which the post-test probability of NAFLD is sufficiently high to trigger screening by imaging
Internal Calibration
In our NAFLD-MESA model, the Hosmer-Lemeshow goodness-of-fit test had a p = 0.24, and the Brier score was 0.053 for the validation set, indicating that our validation model had acceptable calibration and prediction performance. In our second NAFLD-Clinical Index model, the Hosmer-Lemeshow goodness-of-fit test had a p = 0.39, and the Brier score was 0.05. Graphically, we found that both the NAFLD-MESA and NAFLD-Clinical Index models slightly overestimated risk overall, but the estimates by quintiles were close to the line of equality (Appendix Figures 1 and 2 in the Supplementary Information).
Comparison with the Fatty Liver Index
Compared to the FLI, when applied to our full cohort (n = 6194), our NAFLD-MESA index outperformed the FLI (AUCNAFLD-MESA = 0.83 [95% CI: 0.81, 0.85] vs. AUCFLI = 0.78 [0.76, 0.80]; pBonferroni-adjusted < 0.01). On the other hand, our NAFLD-Clinical Index model performed similar to the FLI (AUCClinical = 0.78 [0.75 0.80]; pBonferroni-adjusted 1.00) (Table 4). In race/ethnicity stratified analyses, we found that our NAFLD-MESA index also performed better than the FLI among African Americans (AUCNAFLD-MESA, African Americans = 0.83 [0.78, 0.88] vs. AUCFLI, African American = 0.79 [0.73, 0.84]; pBonferroni-adjusted 0.01) and Hispanics (AUCNAFLD-MESA, Hispanics = 0.79 [0.76, 0.83] vs. AUCFLI, Hispanics = 0.74 [0.70, 0.78]; pBonferroni-adjusted < 0.01), though similar in whites and Chinese Americans (Appendix Table 1 in the Supplementary Information). In sensitivity analysis, modifying the FLI predictors to improve its performance in our data resulted in minimal AUC changes of less than 1% (data not shown).
Table 4.
Comparing the AUC of the NAFLD-MESA and NAFLD-Clinical Index Models Using the Point System to the AUC of the Fatty Liver Index Using the Regression Equation According to Bedogni et al.
| Model | Anthropometry and characteristics | Clinical parameters | AUC | p value* | |||||||
|---|---|---|---|---|---|---|---|---|---|---|---|
| BMI | WC | Sex | Smoke | Age | Race/Eth. | T2D | GGT | TG | Full cohort | ||
| NAFLD-MESA | ✓ | – | ✓ | ✓ | ✓ | ✓ | ✓ | ✓ | ✓ | 0.83 (0.81, 0.85) | – |
| NAFLD-Clinical Index | ✓ | – | ✓ | ✓ | ✓ | ✓ | ✓ | – | – | 0.78 (0.75, 0.80) | < 0.01 |
| Fatty Liver Index | ✓ | ✓ | – | – | – | – | – | ✓ | ✓ | 0.78† (0.76, 0.80) | < 0.01 |
AUC, area under the curve; BMI, body mass index; WC, waist circumference; T2D, type 2 diabetes; GGT, gamma-glutamyltransferase; TG, triglycerides
*Chi2 test Bonferroni-adjusted p value comparing the AUC of each model to the AUC of the NAFLD-MESA Index model
†Chi2 test Bonferroni-adjusted p value = 1.00 comparing the AUC of the FLI to the AUC of the NAFLD-Clinical Index model
DISCUSSION
In this large population-based cross-sectional study of white, African American, Hispanic, and Chinese American adults over the age of 45 years, we developed two practical indices that use a point-based system to discriminate between individuals with and without NAFLD with good precision. The index showed adequate discrimination, supporting its use in clinical settings to prioritize who should be referred for an imaging study for NAFLD diagnosis. Likewise, in research settings, researchers can use the index to identify high or low NAFLD risk individuals. We also developed a NAFLD-Clinical Index excluding biomarkers (GGT and TG) and found it to perform only marginally lower than the full NAFLD-MESA index, indicating its use appropriate when laboratory tests are not readily available.
Machine learning can allow the identification of highly predictive variables, which otherwise may have gone unexplored using traditional methods such as stepwise logistic regression.42 The algorithm identified similar variables included in prior risk models and also additional variables not previously included (sex, age, and smoking). Equally important, there is usefulness in developing models that are interpretable and easy to implement in practice. For instance, the performance of our final simplified models was similar to regression models that allowed for nonlinearities of continuous variables without categorization, or to analog models based on the random forest (data not shown). Consistent with prior studies,29,30 BMI, GGT, TG, type 2 diabetes, and race/ethnicity were independent NAFLD predictors. Age and sex also have been associated with NAFLD, but their association varies across the life-course. NAFLD prevalence increases with age until about 50 years, particularly among men.43,44 In populations < 50, men generally have a higher NAFLD risk compared to women, whereas among post-menopausal women, the risk of NAFLD has been found to be similar to men their age.43,44 NAFLD prevalence decreases after about the age of 50 in men and around the age of 70 in women.44 These findings are consistent in MESA with adults > 75 years having the lowest risk of NAFLD. In our model, women had a slightly higher risk than men. On the other hand, the association between cigarette smoking history and NAFLD is less clear. In MESA, current smokers had the lowest NAFLD prevalence, and this was consistent across different strata of BMI (data not shown). As we did not control for other ectopic fat stores in our models, it is possible for residual confounding to explain at least part of this inverse association.
Our models share predictors used in a number of NAFLD indices previously developed among homogeneous populations outside of the USA.12–17 Because of unavailability of some variables, we were only able to validate the FLI12 in our sample. We found that our NAFLD-MESA index outperformed the FLI by 5% of AUC, and our NAFLD-Clinical Index had a comparable performance compared to the FLI. Notably, the FLI was developed in an Italian population12 and has been validated in East Asian populations,18–22 but this is the first time that a NAFLD risk score approach is developed on an ethnically diverse sample. It is noteworthy noting that the NAFLD-MESA index performed particularly better among African American and Hispanic adults, but no better than the FLI among whites and Chinese Americans, highlighting the importance of including race/ethnicity as a risk factor for NAFLD.
Our study has limitations. First, NAFLD diagnosis in our study was based on CT scans which are insensitive to mild hepatic steatosis.27,28 This resulted in outcome misclassification of mild NAFLD cases. Furthermore, steatosis tends to be reduced with progressing fibrosis, also leading to misclassification. Second, we could not evaluate non-alcoholic steatohepatitis due to the lack of histologic data. Third, MESA did not measure other liver enzymes, potentially leading to a lower model performance. Fourth, we were unable to compare our model performance against other NAFLD indices as we lacked the necessary variables. Lastly, we were unable to externally validate our index in contemporary clinical populations.
The 2016 European Associations for the Study of the Liver, Diabetes, and Obesity recommend screening high-risk individuals (e.g., with obesity) for NAFLD by liver enzymes and/or ultrasound as part of routine work-up.45 Likewise, the American Diabetes Association recommends routine screening of non-alcoholic steatohepatitis and liver fibrosis in patients with type 2 diabetes and fatty liver on ultrasound.46 Due to the high prevalence obesity or the metabolic syndrome, routine screening for NAFLD would likely overwhelm imaging services. And importantly, the sensitivity for NAFLD using a BMI > 30 kg/m2 is likely too low, especially for those of Asian origin, who have a lower BMI distribution. The NAFLD-MESA index addresses this limitation, making it easier to identify high-risk individuals and reduce the proportion of patients referred to imaging studies. For instance, by applying the NAFLD-MESA index cut-off to MESA, only about 1/3 of the population would be referred to imaging, compared to about 75% of individuals with high BMI and/or type 2 diabetes. Nevertheless, we agree with prior authors47 that further research should evaluate if targeted NAFLD screening using a tool such as this one is cost-effective.
CONCLUSION
In conclusion, the NAFLD-MESA and NAFLD-Clinical indices adequately discriminate between individuals with and without moderate to severe NAFLD and perform better or similar to the previously validated FLI. These indices can aid clinical decision making by risk stratifying and referring to those at high risk for imaging studies. Likewise, in research settings, this index may aid in identifying high-risk individuals in research studies.
Supplementary Information
(DOCX 1286 kb)
Acknowledgments
The authors thank all investigators, staff, and MESA study participants for their valuable contributions. A full list of participating MESA investigators and institutions can be found at http://www.mesa-nhlbi.org. The authors also thank Professors Michael Kohn and Thomas Newman, at the University of California, San Francisco, for providing technical expertise for the development and presentation of the risk score models.
Author Contributions
L.A.R. analyzed the data, drafted and revised the manuscript, and had full access to all the data in the study and takes responsibility for the integrity of the data and the accuracy of the data analysis; L.A.R., A.M.K., and P.T.B. designed the research and obtained funding; S.C.S. provided statistical expertise and contributed to the analysis of the data; A.F. contributed to the interpretation of the data; D.H. is a principal investigator of the MESA cohort and was responsible for the data collection procedures; J.D. is a principal investigator of a MESA ancillary study and was responsible for the data collection and procedures; and R.D.B. is a principal investigator of a MESA ancillary study and was responsible for the data collection and procedures and contributed to study design considerations; all authors critically reviewed and approved the final manuscript.
Funding
MESA was supported by contracts 75N92020D00001, HHSN268201500003I, N01-HC-95159, 75N92020D00005, N01-HC-95160, 75N92020D00002, N01-HC-95161, 75N92020D00003, N01-HC-95162, 75N92020D00006, N01-HC-95163, 75N92020D00004, N01-HC-95164, 75N92020D00007, N01-HC-95165, N01-HC-95166, N01-HC-95167, N01-HC-95168, and N01-HC-95169 from the National Heart, Lung, and Blood Institute, and by grants UL1-TR-000040, UL1-TR-001079, and UL1-TR-001420 from the National Center for Advancing Translational Sciences (NCATS). L.A.R. was supported by the National Institute of Diabetes And Digestive And Kidney Diseases of the National Institutes of Health (NIH) under Award Number F31DK115029, and by a University of California Dissertation-Year Fellowship Award. A.F. was supported by NIH grant K24DK102057.
Compliance with Ethical Standards
Conflict of Interest
The authors declare that they do not have a conflict of interest.
Disclaimer
The content is solely the responsibility of the authors and does not necessarily represent the official views of the National Institutes of Health, or of the University of California.
Footnotes
Publisher’s Note
Springer Nature remains neutral with regard to jurisdictional claims in published maps and institutional affiliations.
References
- 1.Tolman KG, Fonseca V, Dalpiaz A, Tan MH. Spectrum of Liver Disease in Type 2 Diabetes and Management of Patients With Diabetes and Liver Disease. Diabetes Care. 2007;30:734–43. doi: 10.2337/dc06-1539. [DOI] [PubMed] [Google Scholar]
- 2.Younossi ZM, Koenig AB, Abdelatif D, Fazel Y, Henry L, Wymer M. Global epidemiology of nonalcoholic fatty liver disease—Meta-analytic assessment of prevalence, incidence, and outcomes. Hepatology. 2016;64:73–84. doi: 10.1002/hep.28431. [DOI] [PubMed] [Google Scholar]
- 3.Perito ER, Rodriguez LA, Lustig RH. Dietary treatment of nonalcoholic steatohepatitis. Curr Opin Gastroenterol. 2013;29:170–6. doi: 10.1097/MOG.0b013e32835ca11d. [DOI] [PubMed] [Google Scholar]
- 4.Chalasani N, Younossi Z, Lavine JE, et al. The diagnosis and management of nonalcoholic fatty liver disease: Practice guidance from the American Association for the Study of Liver Diseases: Hepatology, Vol. XX, No. X, 2017. Hepatology. 2018;67:328–57. doi: 10.1002/hep.29367. [DOI] [PubMed] [Google Scholar]
- 5.Stefan N, Kantartzis K, Häring H-U. Causes and Metabolic Consequences of Fatty Liver. Endocr Rev. 2008;29:939–60. doi: 10.1210/er.2008-0009. [DOI] [PubMed] [Google Scholar]
- 6.Adams LA, Anstee QM, Tilg H, Targher G. Non-alcoholic fatty liver disease and its relationship with cardiovascular disease and other extrahepatic diseases. Gut. 2017;66:1138–53. doi: 10.1136/gutjnl-2017-313884. [DOI] [PubMed] [Google Scholar]
- 7.Dongiovanni P, Stender S, Pietrelli A, et al. Causal relationship of hepatic fat with liver damage and insulin resistance in nonalcoholic fatty liver. J Intern Med. 2018;283:356–70. doi: 10.1111/joim.12719. [DOI] [PMC free article] [PubMed] [Google Scholar]
- 8.Ballestri S, Zona S, Targher G, et al. Nonalcoholic fatty liver disease is associated with an almost twofold increased risk of incident type 2 diabetes and metabolic syndrome. Evidence from a systematic review and meta-analysis. J Gastroenterol Hepatol. 2016;31:936–44. doi: 10.1111/jgh.13264. [DOI] [PubMed] [Google Scholar]
- 9.Mantovani A, Petracca G, Beatrice G, Tilg H, Byrne CD, Targher G. Non-alcoholic fatty liver disease and risk of incident diabetes mellitus: an updated meta-analysis of 501 022 adult individuals. Gut Published Online First: 16 September 2020. 10.1136/gutjnl-2020-322572. [DOI] [PubMed]
- 10.Cai J, Zhang X-J, Ji Y-X, Zhang P, She Z-G, Li H. Nonalcoholic Fatty Liver Disease Pandemic Fuels the Upsurge in Cardiovascular Diseases. Circ Res. 2020;126:679–704. doi: 10.1161/CIRCRESAHA.119.316337. [DOI] [PubMed] [Google Scholar]
- 11.Dowman JK, Tomlinson JW, Newsome PN. Systematic review: the diagnosis and staging of non-alcoholic fatty liver disease and non-alcoholic steatohepatitis. Aliment Pharmacol Ther. 2011;33:525–40. doi: 10.1111/j.1365-2036.2010.04556.x. [DOI] [PMC free article] [PubMed] [Google Scholar]
- 12.Bedogni G, Bellentani S, Miglioli L, et al. The Fatty Liver Index: a simple and accurate predictor of hepatic steatosis in the general population. BMC Gastroenterol. 2006;66(1):33. doi: 10.1186/1471-230X-6-33. [DOI] [PMC free article] [PubMed] [Google Scholar]
- 13.Lee J-H, Kim D, Kim HJ, et al. Hepatic steatosis index: A simple screening tool reflecting nonalcoholic fatty liver disease. Dig Liver Dis. 2010;42:503–8. doi: 10.1016/j.dld.2009.08.002. [DOI] [PubMed] [Google Scholar]
- 14.Kotronen A, Peltonen M, Hakkarainen A, et al. Prediction of Non-Alcoholic Fatty Liver Disease and Liver Fat Using Metabolic and Genetic Factors. Gastroenterology. 2009;137:865–72. doi: 10.1053/j.gastro.2009.06.005. [DOI] [PubMed] [Google Scholar]
- 15.Poynard T, Ratziu V, Naveau S, et al. The diagnostic value of biomarkers (SteatoTest) for the prediction of liver steatosis. Comp Hepatol. 2005;4:10. doi: 10.1186/1476-5926-4-10. [DOI] [PMC free article] [PubMed] [Google Scholar]
- 16.Yip TC-F, Ma AJ, Wong VW-S, et al. Laboratory parameter-based machine learning model for excluding non-alcoholic fatty liver disease (NAFLD) in the general population. Aliment Pharmacol Ther. 2017;46:447–56. doi: 10.1111/apt.14172. [DOI] [PubMed] [Google Scholar]
- 17.Bedogni G, Kahn HS, Bellentani S, Tiribelli C. A simple index of lipid overaccumulation is a good marker of liver steatosis. BMC Gastroenterol. 2010;10:98. doi: 10.1186/1471-230X-10-98. [DOI] [PMC free article] [PubMed] [Google Scholar]
- 18.Koehler EM, Schouten JNL, Hansen BE, Hofman A, Stricker BH, Janssen HLA. External Validation of the Fatty Liver Index for Identifying Nonalcoholic Fatty Liver Disease in a Population-based Study. Clin Gastroenterol Hepatol. 2013;11:1201–4. doi: 10.1016/j.cgh.2012.12.031. [DOI] [PubMed] [Google Scholar]
- 19.Yang B-L, Wu W-C, Fang K-C, et al. External Validation of Fatty Liver Index for Identifying Ultrasonographic Fatty Liver in a Large-Scale Cross-Sectional Study in Taiwan. Sookoian SC, ed. PLoS ONE 2015; 10: e0120443. [DOI] [PMC free article] [PubMed]
- 20.Kim JH, Kwon SY, Lee SW, Lee CH. Validation of fatty liver index and lipid accumulation product for predicting fatty liver in Korean population: Letters to the Editor. Liver Int. 2011;31:1600–1. doi: 10.1111/j.1478-3231.2011.02580.x. [DOI] [PubMed] [Google Scholar]
- 21.Cuthbertson DJ, Weickert MO, Lythgoe D, et al. External validation of the fatty liver index and lipid accumulation product indices, using 1H-magnetic resonance spectroscopy, to identify hepatic steatosis in healthy controls and obese, insulin-resistant individuals. Eur J Endocrinol. 2014;171:561–9. doi: 10.1530/EJE-14-0112. [DOI] [PubMed] [Google Scholar]
- 22.Huang X, Xu M, Chen Y, et al. Validation of the Fatty Liver Index for Nonalcoholic Fatty Liver Disease in Middle-Aged and Elderly Chinese. Medicine (Baltimore) 2015;94:e1682. doi: 10.1097/MD.0000000000001682. [DOI] [PMC free article] [PubMed] [Google Scholar]
- 23.Bild DE, Bluemke DA, Burke GL, et al. Multi-Ethnic Study of Atherosclerosis: Objectives and Design. Am J Epidemiol. 2002;156:871–81. doi: 10.1093/aje/kwf113. [DOI] [PubMed] [Google Scholar]
- 24.Tison GH, Blaha MJ, Nasir K, et al. Relation of Anthropometric Obesity and Computed Tomography Measured Nonalcoholic Fatty Liver Disease (from the Multiethnic Study of Atherosclerosis) Am J Cardiol. 2015;116:541–6. doi: 10.1016/j.amjcard.2015.05.012. [DOI] [PMC free article] [PubMed] [Google Scholar]
- 25.Carr JJ, Nelson JC, Wong ND, et al. Calcified Coronary Artery Plaque Measurement with Cardiac CT in Population-based Studies: Standardized Protocol of Multi-Ethnic Study of Atherosclerosis (MESA) and Coronary Artery Risk Development in Young Adults (CARDIA) Study. Radiology. 2005;234:35–43. doi: 10.1148/radiol.2341040439. [DOI] [PubMed] [Google Scholar]
- 26.Bydder GM, Chapman RWG, Harry D, Bassan L, Sherlock S, Kreel L. Computed tomography attenuation values in fatty liver. J Comput Tomogr. 1981;5:33–5. doi: 10.1016/0149-936X(81)90054-0. [DOI] [PubMed] [Google Scholar]
- 27.Shah RV, Allison MA, Lima JAC, et al. Liver fat, statin use, and incident diabetes: The Multi-Ethnic Study of Atherosclerosis. Atherosclerosis. 2015;242:211–7. doi: 10.1016/j.atherosclerosis.2015.07.018. [DOI] [PMC free article] [PubMed] [Google Scholar]
- 28.Zeb I, Li D, Nasir K, Katz R, Larijani VN, Budoff MJ. Computed Tomography Scans in the Evaluation of Fatty Liver Disease in a Population Based Study: The Multi-Ethnic Study of Atherosclerosis. Acad Radiol. 2012;19:811–8. doi: 10.1016/j.acra.2012.02.022. [DOI] [PMC free article] [PubMed] [Google Scholar]
- 29.Younossi Z, Anstee QM, Marietti M, et al. Global burden of NAFLD and NASH: trends, predictions, risk factors and prevention. Nat Rev Gastroenterol Hepatol. 2017;15:11–20. doi: 10.1038/nrgastro.2017.109. [DOI] [PubMed] [Google Scholar]
- 30.Le MH, Devaki P, Ha NB, et al. Prevalence of non-alcoholic fatty liver disease and risk factors for advanced fibrosis and mortality in the United States. Yu M-L, ed. PLoS ONE 2017; 12: e0173499. [DOI] [PMC free article] [PubMed]
- 31.Alberti KGMM, Zimmet P, Shaw J. Metabolic syndrome—a new world-wide definition. A Consensus Statement from the International Diabetes Federation. Diabet Med. 2006;23:469–80. doi: 10.1111/j.1464-5491.2006.01858.x. [DOI] [PubMed] [Google Scholar]
- 32.Golden SH, Lee HB, Schreiner PJ, et al. Depression and Type 2 Diabetes Mellitus: The Multiethnic Study of Atherosclerosis. Psychosom Med. 2007;69:529–36. doi: 10.1097/PSY.0b013e3180f61c5c. [DOI] [PubMed] [Google Scholar]
- 33.Anon. WHO | Obesity: preventing and managing the global epidemic. 2000. [PubMed]
- 34.Consultation W expert Appropriate body-mass index for Asian populations and its implications for policy and intervention strategies. Lancet. 2004;363:157–63. doi: 10.1016/S0140-6736(03)15268-3. [DOI] [PubMed] [Google Scholar]
- 35.Araneta MRG, Kanaya AM, Hsu WC, et al. Optimum BMI Cut Points to Screen Asian Americans for Type 2 Diabetes. Diabetes Care. 2015;38:814–20. doi: 10.2337/dc14-2071. [DOI] [PMC free article] [PubMed] [Google Scholar]
- 36.Wilkins LW. Third Report of the National Cholesterol Education Program (NCEP) Expert Panel on Detection, Evaluation, and Treatment of High Blood Cholesterol in Adults (Adult Treatment Panel III) Final Report. Circulation. 2002;106:3143–3143. doi: 10.1161/circ.106.25.3143. [DOI] [PubMed] [Google Scholar]
- 37.Strobl C, Hothorn T, Zeileis A. Party on! A New, Conditional Variable Importance Measure for Random Forests Available in the party Package. The R Journal, 1(2):14–17. http://journal.R-project.org/archive/2009-2/RJournal_2009-2_Strobl-et-al.pdf.
- 38.Breiman L. Random Forests. Mach Learn. 2001;45:5–32. doi: 10.1023/A:1010933404324. [DOI] [Google Scholar]
- 39.Sullivan LM, Massaro JM, D’Agostino RB. Presentation of multivariate data for clinical use: The Framingham Study risk score functions. Stat Med. 2004;23:1631–60. doi: 10.1002/sim.1742. [DOI] [PubMed] [Google Scholar]
- 40.Harrison DA, Brady AR, Parry GJ, Carpenter JR, Rowan K. Recalibration of risk prediction models in a large multicenter cohort of admissions to adult, general critical care units in the United Kingdom*. Crit Care Med. 2006;34:1378–88. doi: 10.1097/01.CCM.0000216702.94014.75. [DOI] [PubMed] [Google Scholar]
- 41.Rufibach K. Use of Brier score to assess binary predictions. J Clin Epidemiol. 2010;63:938–9. doi: 10.1016/j.jclinepi.2009.11.009. [DOI] [PubMed] [Google Scholar]
- 42.Goldstein BA, Navar AM, Carter RE. Moving beyond regression techniques in cardiovascular risk prediction: applying machine learning to address analytic challenges. Eur Heart J 2017 Jun 14;38(23):1805-14. [DOI] [PMC free article] [PubMed]
- 43.Long MT, Pedley A, Massaro JM, et al. A simple clinical model predicts incident hepatic steatosis in a community-based cohort: The Framingham Heart Study. Liver Int 2018 Aug;38(8):1495-503. [DOI] [PMC free article] [PubMed]
- 44.Bertolotti M. Nonalcoholic fatty liver disease and aging: Epidemiology to management. World J Gastroenterol. 2014;20:14185. doi: 10.3748/wjg.v20.i39.14185. [DOI] [PMC free article] [PubMed] [Google Scholar]
- 45.Anon EASL–EASD–EASO Clinical Practice Guidelines for the management of non-alcoholic fatty liver disease. J Hepatol. 2016;64:1388–402. doi: 10.1016/j.jhep.2015.11.004. [DOI] [PubMed] [Google Scholar]
- 46.American Diabetes Association 4. Comprehensive Medical Evaluation and Assessment of Comorbidities: Standards of Medical Care in Diabetes—2019. Diabetes Care. 2019;42:S34–S45. doi: 10.2337/dc19-S004. [DOI] [PubMed] [Google Scholar]
- 47.Caussy C. Should We Screen High-Risk Populations for NAFLD? Curr Hepatol Rep. 2019;18:433–43. doi: 10.1007/s11901-019-00497-7. [DOI] [Google Scholar]
Associated Data
This section collects any data citations, data availability statements, or supplementary materials included in this article.
Supplementary Materials
(DOCX 1286 kb)