Figure 3.
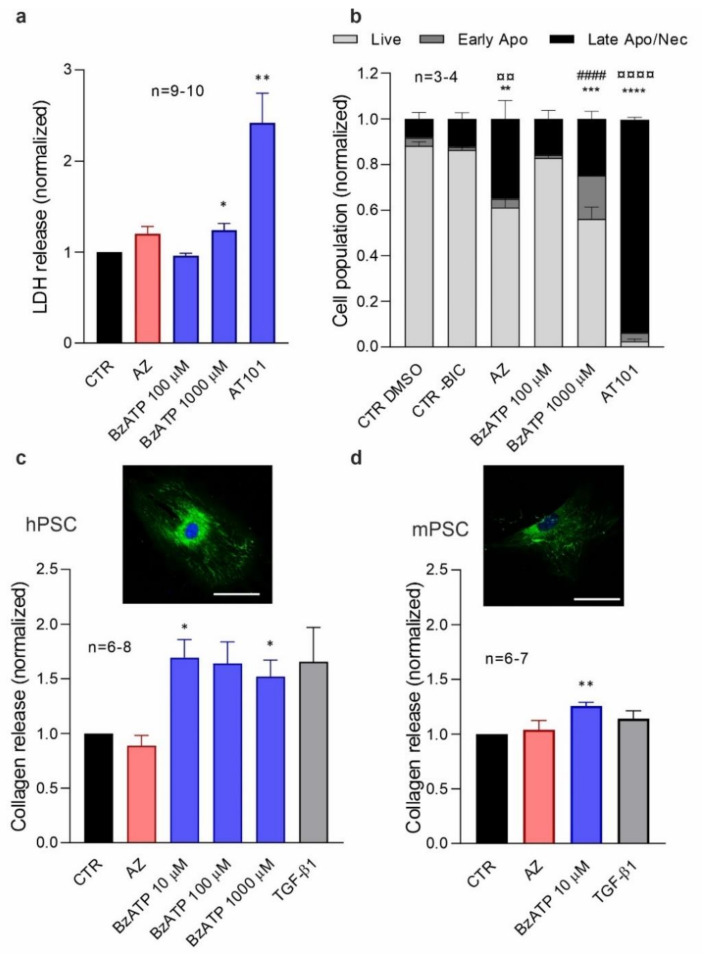
Effect of P2X7R on cell survival and collagen release. (a,b) Effects of 10 μM AZ10606120 (AZ) and different concentrations of BzATP on (a) LDH release (b) and live/dead cell population (flow cytometry analysis) on hPSCs. (c,d) Collagen release and representative images of collagen staining are shown for hPSCs and mPSCs (P2X7R wt). Scale bar is 50 μm. Data are normalized to the control values (CTR). AT101 10 μM and TGF-β1 5 ng/µl were used as positive controls. Statistical analysis was as above and significance is indicated by (a) * p < 0.05, ** p < 0.01; (c) * p < 0.05; (d) ** p < 0.01. We analyzed the flow cytometry data with one-way ANOVA followed by Bonferroni correction and compared to the control and significant difference for live (*), early apoptosis (#), late apoptosis/necrosis (¤) is indicated by the following: ** ¤¤ p < 0.01; *** p < 0.001; **** #### ¤¤¤¤ p < 0.0001.

