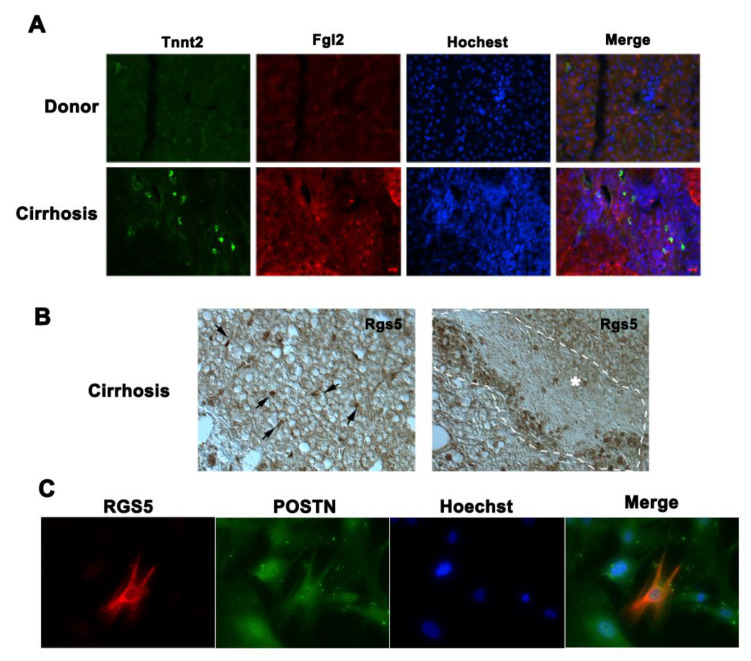
Figure 7.
The analysis of heterogeneity of human HSCs in cirrhotic liver. (A) Co-Immunofluorescent staining of Tnnt2 and Fgl2 in control (Ctr) and cirrhotic human liver (200×). (B) Immunohistochemistry staining of Rgs5 in cirrhotic liver. Left panel shows interstitial Rgs5 positive HSCs (arrows) and right panel shows that Rgs5 positive signal detected in portion of activated HSCs in fibrotic area (within the dash line circle) (200×). (C) Co-Immunofluorescent staining of Rgs5 and Postn in fresh isolated human HSCs from cirrhotic liver (400×).

