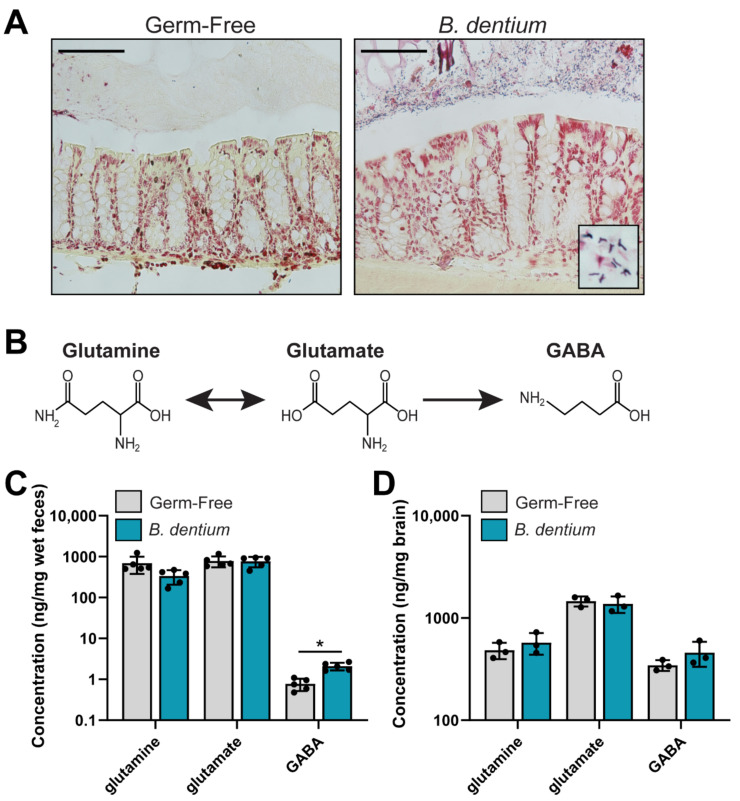
Figure 2.
(A). Representative Gram stains of the germ-free and B. dentium mono-associated colon. Scale bar = 100 µm. (B). Depiction of the glutamine, glutamate, GABA pathway. (C). Analysis of glutamine, glutamate, and GABA measured from a known mass of stool (ng/mg wet feces weight) by LC-MS/MS reflecting in vivo levels of these neurotransmitters from the germ-free and B. dentium mono-associated mice. (D). Concentrations of glutamine, glutamate, and GABA in a known mass of whole brain homogenate (ng/mg brain). n = 3–5 mice/group; two-way ANOVA, * p < 0.05.

