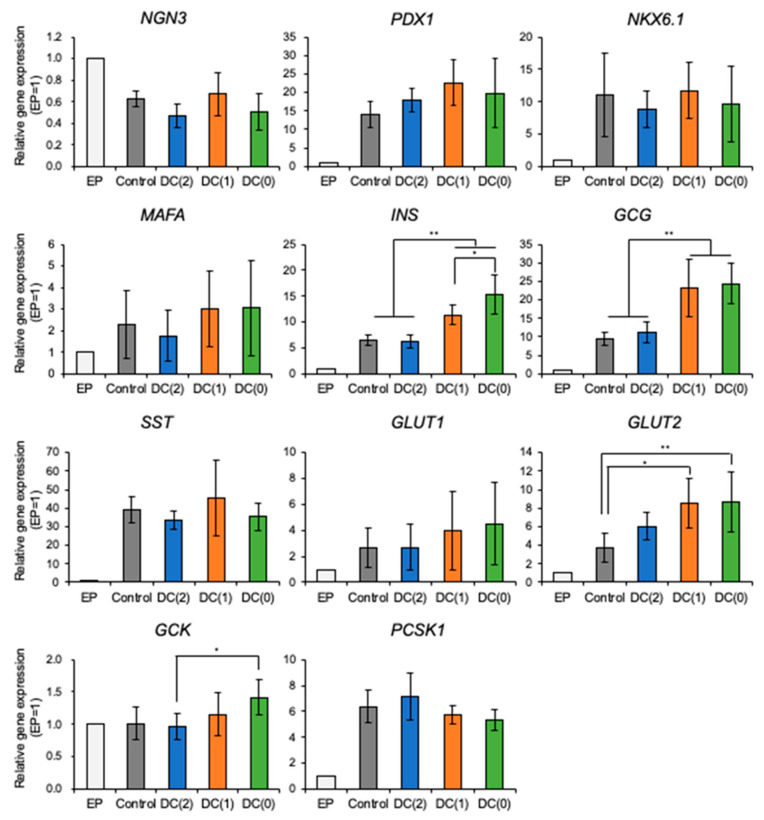
Figure 4.
Relative gene expression levels of NGN3, PDX1, NKX6.1, MAFA, INS, GCG, SST, GLUT1, GLUT2, GCK, and PCSK1 in differentiated EP cells and islet-like cells were measured by RT-qPCR. Data represent mean ± SD of n = 5–6 from two independent experiments. Statistical analysis as determined by one-way ANOVA with post hoc Tukey HSD test. (* p < 0.05, ** p < 0.01).

