

Abstract

Superionic phases of bulk anhydrous salts based on large cluster-like polyhedral (carba)borate anions are generally stable only well above room temperature, rendering them unsuitable as solid-state electrolytes in energy-storage devices that typically operate at close to room temperature. To unlock their technological potential, strategies are needed to stabilize these superionic properties down to subambient temperatures. One such strategy involves altering the bulk properties by confinement within nanoporous insulators. In the current study, the unique structural and ion dynamical properties of an exemplary salt, NaCB11H12, nanodispersed within porous, high-surface-area silica via salt-solution infiltration were studied by differential scanning calorimetry, X-ray powder diffraction, neutron vibrational spectroscopy, nuclear magnetic resonance, quasielastic neutron scattering, and impedance spectroscopy. Combined results hint at the formation of a nanoconfined phase that is reminiscent of the high-temperature superionic phase of bulk NaCB11H12, with dynamically disordered CB11H12– anions exhibiting liquid-like reorientational mobilities. However, in contrast to this high-temperature bulk phase, the nanoconfined NaCB11H12 phase with rotationally fluid anions persists down to cryogenic temperatures. Moreover, the high anion mobilities promoted fast-cation diffusion, yielding Na+ superionic conductivities of ∼0.3 mS/cm at room temperature, with higher values likely attainable via future optimization. It is expected that this successful strategy for conductivity enhancement could be applied as well to other related polyhedral (carba)borate-based salts. Thus, these results present a new route to effectively utilize these types of superionic salts as solid-state electrolytes in future battery applications.
Introduction
Since the first report of superionic conductivity observed in Na2B12H12 above its order–disorder phase transition,1 a rich variety of similarly superionic Li+, Na+, and Ag+ solid-state electrolytes have been identified based on the anhydrous salts of the large cluster-like polyhedral (carba)borate anions.2−8 The critical factor promoting the superionic state is the formation of an entropy-driven disordered phase of rapidly reorienting anions among translationally fluidic interstitial cations, which normally occurs somewhere above room temperature, below which the ordered salt is poorly conductive. For practical battery applications, strategies are required to stabilize the superionic disordered phases at room temperature and below. Ball-milling these salts to create nanosized domains9 and combining salts with different polyhedral anions9−13 are two methods that have proven to be successful for stabilizing the desired disordered phases down to subambient temperatures. Here, we exemplify a third viable method, that is, the nanodispersion of polyhedral (carba)borate salts within porous, high-surface-area silica (SiO2) via salt-solution infiltration with subsequent vacuum desolvation. Somewhat analogous melt-infiltration of pure and anion-substituted LiBH4 in nanostructured SiO2 and Al2O3 has been shown to yield highly Li+-conductive nanocomposites.14−16
In addition to these LiBH4-related examples, there have been at least two reported attempts to create similarly nanoconfined polyhedral (carba)borate salts, in particular, involving Li2B12H12. In one case, further reaction of SBA-15 SiO2-nanoconfined LiBH4 with an H2/B2H6 gas mixture at 433 K was found to produce Li2B12H12 (with ∼6% Li2B10H10) within the (5.9 nm average diameter) cylindrical nanopores.17 Moreover, despite the apparently successful formation of a nanoconfined Li2B12H12 reaction product, the resulting nanocomposite material displayed similarly low, ambient-temperature conductivities as bulk Li2B12H12, reflecting the observed dominance within the nanopores of the ordered α-Li2B12H12 phase that normally forms in the bulk at these temperatures. Despite this main ordered phase, the structural measurements could not rule out that a small fraction of the nanoconfined Li2B12H12 was in its highly conductive, disordered β-phase. 7Li nuclear magnetic resonance (NMR) also indicated the coexistence of temperature-independent fractions of more and less mobile Li+ cations, although it is not clear to what extent the more mobile fraction is related to the presence of some β-phase and/or is associated with a perturbed Li2B12H12 layer adjacent to the nanopore wall. In another subsequent study, it was found that solid crystalline adducts of Li2B12H12 with either acetonitrile (ACN) or tetrahydrofuran (THF) melt below 423 K during partial desolvation, and this allowed for the melt infiltration of Li2B12H12·xACN and Li2B12H12·xTHF into SBA-15 nanoporous SiO2.18 Further evacuation above ∼493 K was suggested by X-ray diffraction techniques to yield nanoconfined, solvent-free, solidified Li2B12H12, presumably with an α-phase signature. However, the resulting Li+ conductivity behavior of a Li2B12H12·xTHF-derived nanocomposite was found to be unremarkable and akin to that of the previously reported17 impure Li2B12H12@SiO2 nanocomposites.
Unfortunately, these latter results do not firmly resolve whether nanoconfinement can help stabilize favorable nonbulk-like properties with enhanced Li+ or other ion conductivities for any of the general class of polyhedral (carba)borate salts, as it has for LiBH4 and its derivatives. We address this in the current study, where we turn our attention away from Li-based polyhedral (carba)borate salts and toward Na-based ones. In particular, sodium monocarba-closo-dodecaborate, NaCB11H12, was chosen in the present case based on its superior conductivity in the disordered state3 and its propensity to form highly concentrated aqueous solutions, which facilitates higher salt loadings within the pores during the salt-solution infiltration step.
Experimental Details
NaCB11H12 was obtained from Katchem.19 Two morphologically distinct silica (SiO2) scaffolds, shown schematically in Figure 1, were tested: (1) SBA-15 (Sigma Aldrich) hexagonal honeycomb arrays of nominally 8 nm diameter tubular nanopores (with a reported pore volume of ∼0.8–1.0 cm3 g–1 and a surface area of 450–550 m2 g–1) and (2) KCC-1 (Strem) high-surface-area (700 m2 g–1) spherical fibrous SiO2 nanoparticles with interconnected nanoporous volume within the fiber network. Silica powders from the sealed vendor bottles were typically first evacuated at 473 K for 16 h to remove trace H2O, although the lack of this step before infiltration was found not to affect the ultimate results. These powders were wetted at room temperature with chosen amounts of saturated aqueous NaCB11H12 solution (approximately 5.5 H2O molecules per NaCB11H12 formula unit) using a micropipette. After stirring the slurry mixtures to ensure uniform infiltration via capillary action, H2O was removed by vacuum evacuation at 473 K for 16 h. Additional anhydrous NaCB11H12 for comparative bulk measurements was also generated using this drying procedure. After drying, all materials were handled in a He-filled glovebox.
Figure 1.

Schematic representation of the two nanostructures and the aqueous salt infiltration procedure.
Powder X-ray diffraction (PXRD) patterns were measured for each sample sealed in 1 mm diameter quartz capillaries at room temperature using a Rigaku Ultima III X-ray diffractometer with a Cu-Kα source (λ = 1.5418 Å). Differential scanning calorimetry (DSC) measurements with thermogravimetric analysis (TGA) were performed with a Netzsch (STA 449 F1 Jupiter) TGA–DSC under He flow using Al sample pans.
Low-field proton NMR measurements were performed on a pulse spectrometer described earlier20 at the frequencies ω/2π = 14 and 28 MHz. Typical values of the π/2 pulse length were 2–3 μs. High-field 23Na NMR measurements were performed with a Bruker AVANCE III 500 spectrometer at the frequency ω/2π = 132.3 MHz. Nuclear spin–lattice relaxation rates were measured using the saturation–recovery method. NMR spectra were recorded by Fourier-transforming the solid echo signals (pulse sequence π/2x – t – π/2y). NMR samples were flame-sealed in quartz tubes under vacuum.
Neutron scattering measurements were performed at the National Institute of Standards and Technology Center for Neutron Research using thin flat-plate-shaped samples to minimize neutron beam attenuation from the highly neutron-absorbing 10B that comprises 20% of natural boron. Neutron vibrational spectroscopy (NVS) measurements were performed with the Filter-Analyzer Neutron Spectrometer (FANS)21 using a Cu(220) monochromator with pre- and postcollimations of 20′ of arc, yielding a full-width-at-half-maximum (FWHM) energy resolution of about 3% of the neutron energy transfer. Neutron-elastic-scattering fixed-window scans (FWSs) were performed between 120 and 420 K in heating and cooling regimes at ±0.25 K min–1 with the High-Flux Backscattering Spectrometer (HFBS),22 which provides an energy resolution of 0.8 μeV FWHM using 6.27 Å wavelength incident neutrons. Quasielastic neutron scattering (QENS) measurements were performed with the DisKChopper Spectrometer (DCS),23 utilizing incident neutron wavelengths of 8 Å (1.278 meV) and 10 Å (0.818 meV), with resolutions of 29.8 and 17 μeV FWHM, respectively. QENS measurements below room temperature were performed using HFBS. The instrumental resolution functions on both instruments were obtained from the purely elastic QENS measurements at 4 K. Neutron data analyses were performed using the DAVE software package.24
Alternating current (AC) impedance measurements were performed under a He atmosphere. The electrolyte powders were pressed into free-standing pellets with a diameter of 5 mm and thicknesses of about 2 mm. The pellets were formed under 250 MPa uniaxial pressure using a miniature button compression load cell from OMEGA and loaded into an MTI stainless steel cell with Au electrodes on both sides of the pellet. Once loaded, the MTI cell applies a pressure of approximately 2.7 MPA on the pellet. The measurements were performed at temperatures from 225 to 420 K using a closed-cycle He refrigerator. The sample temperature was measured using a calibrated thermocouple. The AC impedance spectra were collected from 1 Hz to 1 MHz using a VersaSTAT 4 potentiostat.
All structural depictions were made using the VESTA (visualization for electronic and structural analysis) software.25 For all figures, standard uncertainties are commensurate with the observed scattering in the data, if not explicitly designated by vertical error bars.
Results and Discussion
Pore Loading and Structural Characterization
DSC was used for establishing the maximum amount of NaCB11H12 that could be incorporated into the nanoporous silica structures via solution-loading because of the different calorimetric behaviors found for bulk and nanoconfined NaCB11H12. While bulk NaCB11H12 exhibits a reversible DSC peak (near 380 and 354 K upon heating and cooling, respectively) that reflects the enthalpic change occurring during its transition back and forth between its poorly conductive, ordered orthorhombic and superionic, disordered phases,3 nanoconfined NaCB11H12 was found to manifest no such enthalpic feature over the entire probed temperature range (100 to 473 K).
Samples loaded with different solution volumes (cm3) per gram of both SBA-15 and KCC-1 silica were prepared. DSC temperature-cycling measurements of the resulting dried nanocomposites lacked any observable enthalpic features for samples with solution loadings at or below ∼0.9 and ∼1.2 cm3 g–1 for SBA-15 and KCC-1, respectively. In contrast, a bulk-like feature appeared for the higher-loading samples, with intensity increasing in a roughly linear fashion in proportion to the excess amount of solution added above the aforementioned values. An exemplary series of DSC scans for NaCB11H12@SBA-15 and NaCB11H12@KCC-1 in heating compared to that for bulk NaCB11H12 is shown in Figures 2 and S1, respectively. (Additional representative DSC cycling scans in both heating and cooling are shown in Figure S2.) These results suggest that all NaCB11H12 resides in the nanopores (exhibiting atypical NaCB11H12 calorimetric properties) after drying nanocomposites with solution loadings below these values. The cutoff at 0.9 cm3 g–1 for SBA-15 is in line with its reported accessible pore volume; the higher 1.2 cm3 g–1 cutoff for KCC-1 is also reasonable, considering its different morphology and associated 30–40% higher specific surface area compared to SBA-15, which is in agreement with the accessible KCC-1 pore volume reported by others.26,27 Henceforth, in subsequent discussion, we define 100% solution loading as 0.9 cm3 g–1 for SBA-15 and 1.2 cm3 g–1 for KCC-1.
Figure 2.
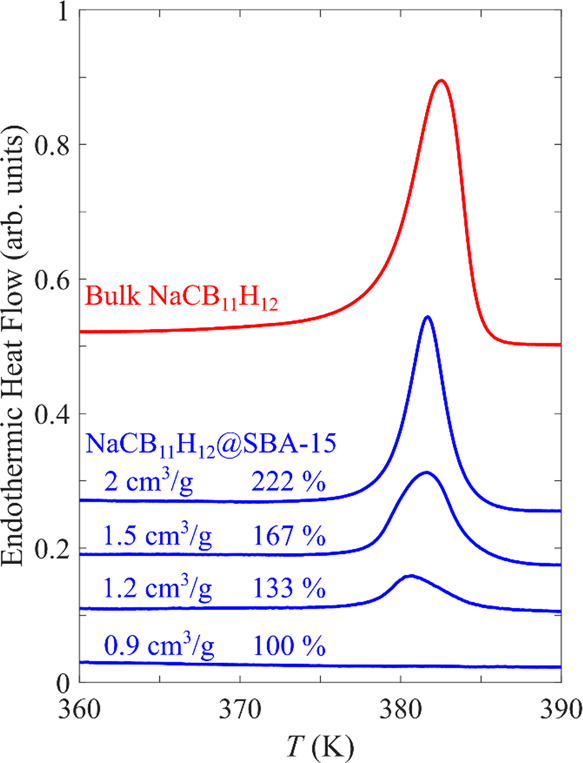
Exemplary DSC scans in heating (5 K min–1) of dried NaCB11H12@SBA-15 nanocomposite samples derived from different saturated NaCB11H12 solution loadings (cm3g–1 and corresponding percentage of available pore volume filled) of SBA-15, compared with that for bulk NaCB11H12. All nanocomposite scans are normalized with respect to the same mass of SBA-15.
Figure 3 shows the diffraction patterns for the ordered orthorhombic and disordered cubic and hexagonal phases of bulk NaCB11H12 compared with those for dried NaCB11H12@SiO2 nanocomposites corresponding to various NaCB11H12 solution loadings in SBA-15. At 100% solution loading, the room-temperature pattern for the resulting nanosequestered NaCB11H12 displays one predominant, considerably broadened Bragg feature centered near 15.3°, which is in line with the main Bragg peak of the high-temperature face-centered-cubic (fcc) phase of bulk NaCB11H12 that was found to dominate at 356 K (with some remnant ordered orthorhombic phase).3 Moreover, there are indications of minor broad sidebands near 14.3 and 16.1°, which is consistent with the Bragg peak positions of two other higher-temperature polymorphs of bulk NaCB11H12 (with hexagonal symmetries) that were found to dominate at 428 K.3 Even the nonsymmetric shape surrounding the peak maximum may be an indication of an additional minor feature at 15.6°, which would match the fourth higher-temperature polymorph of bulk NaCB11H12 (with body-centered-cubic symmetry) that was also observed at 428 K.3 We note that the broadening of the peaks implies that the crystallites of NaCB11H12 are indeed nanosized, as expected.
Figure 3.

PXRD patterns for dried NaCB11H12@SBA-15 nanocomposites for different solution loadings and measurement temperatures (100% loading, room temperature (RT): black; 100%, 400 K: red; 110%, RT: brown; 110%, 400 K: purple; and 140% RT: green) compared with bulk NaCB11H12 patterns (RT: blue, 356 K: maroon; and 428 K: gray) from a previous study.3 The Bragg positions of the bulk ordered orthorhombic phase are marked with black circles, whereas those for the various known disordered fcc, hcp, hexagonal, and bcc polymorphs are marked by black squares, diamonds, triangles, and stars, respectively.
For 110 and 140% loadings, on the top of the broadened Bragg feature, it is clear that additional sharp Bragg peaks representing the ordered orthorhombic phase of excess bulk NaCB11H12 outside the pores are present at room temperature and become more intense with increased loading. Moreover, as seen by the 400 K pattern for 110% loading, the sharp orthorhombic Bragg peaks for the excess bulk NaCB11H12 are replaced by the two expected peaks representing the high-temperature fcc phase, while little change is evident for the underlying broad Bragg feature because of the nanoconfined NaCB11H12. Analogous PXRD patterns for the KCC-1 infiltrated samples are exemplified in Figure S3. The results are similar, although the fraction of the fcc polymorph in the pores appears to be lower than that in SBA-15 at the expense of the other known disordered polymorphs for NaCB11H12 highlighted in Figure 3. This is possibly due to a crystallite-size effect because the average pore size (as well as the pore size distribution) in KCC-1 has been shown to be larger than the distinct tubular 8 nm pores of SBA-15. Indeed, in addition to a minor fraction of smaller nanopores (<4–5 nm), the majority of the KCC-1 pore volume typically exists as mesopores ranging from roughly 5 nm to 25–30 nm.26 This is consistent with the fact that the disordered polymorph PXRD features for NaCB11H12@KCC-1 appear to be slightly sharper than those for NaCB11H12@SBA-15, reflecting the larger average crystallite size for the former.
Neutron vibrational spectra at 4 K for bulk NaCB11H12 and both NaCB11H12@SBA-15 and NaCB11H12@KCC-1 (100% loadings) shown in Figure S4 indicate similar optical phonon densities of states characteristic of the various CB11H12– anion deformation modes.3 In short, the combined DSC, PXRD, and NVS results indicate that NaCB11H12 remains nanoconfined and undecomposed after drying the NaCB11H12-solution-infiltrated SiO2. Moreover, although not conclusive, PXRD suggests the stabilization of room-temperature nanostructures similar to that of the disordered structures seen only at higher temperatures for bulk NaCB11H12. Because PXRD is only sensitive to ordered structures, we cannot rule out the existence of additional “invisible” amounts of amorphous-like NaCB11H12 within the pores, although the relative intensities of the Bragg features for bulk NaCB11H12 and disordered polymorphs in overloaded NaCB11H12@SiO2 samples suggest that the amount of any such amorphous material is very minor at best. Moreover, the preferred formation of normally higher-temperature, bulk-like polymorphs for nanoconfined NaCB11H12 at room temperature and below is not unexpected, as evidenced by the similar structural transformation of coarsely crystalline NaCB11H12 upon entering the nanocrystalline regime via ball-milling.9 The lack of an obvious DSC enthalpic feature down to 100 K further suggests that these nanostructures remain stable down to cryogenic temperatures. Finally, at higher solution loadings exceeding the accessible SiO2 pore volume, both DSC and PXRD indicate that excess NaCB11H12 crystallizes outside the pore as bulk phase.
Anion and Cation Dynamics
The dynamical behaviors of the CB11H12– anions and Na+ cations of the (100% loading) NaCB11H12@SBA-15 SiO2 nanocomposite were probed by 1H and 23Na NMR measurements to understand better the effects of nanoconfinement. Figure 4 shows the proton spin–lattice relaxation rates, R1H, at ω/2π = 14 and 28 MHz as functions of the inverse temperature. As in other polyhedral hydro(carba)borate salts,28 the behavior of R1 in NaCB11H12@SBA-15 is governed by reorientations of the complex anions via the mechanism of motionally modulated dipole–dipole interactions between nuclear spins.29 For this mechanism, R1H(T) is expected to pass through a maximum at the temperature where the H jump rate τ –1 becomes nearly equal to the resonance frequency ω. For NaCB11H12@SBA-15, this occurs at 210 K (∼108 s–1). It should be noted that the progression of the relaxation rate curve at lower temperatures shown in Figure 4 suggests the coexistence of an additional faster reorientational jump process, not unexpected based on the molecular symmetry of the dipolar CB11H12– anion. Indeed, a similar relaxation rate behavior reflecting coexisting jump processes was also observed for superionic Na2(CB9H10)(CB11H12), with the maximum in R1 occurring near 220 K for the orientationally disordered CB9H10– and CB11H12– anions in the hexagonal structure.10,30 This behavior for nanoconfined NaCB11H12 is in sharp contrast to that for bulk NaCB11H12, where R1H(T) does not reach a maximum even upon heating to 376 K.31 Instead, the proton relaxation rate of bulk NaCB11H12 exhibits an abrupt two-orders-of-magnitude drop at 376 K, which relates to the order–disorder phase transition, leading to the strong acceleration of the reorientational motion.31 The lack of such a rapid change in the jump rate points to the stabilization of bulk-like disordered phases down to cryogenic temperatures, which is in agreement with the DSC and PXRD results. In particular, the order–disorder phase transition normally occurring for bulk NaCB11H12 appears to be suppressed so that high reorientational mobility is retained down to low temperatures.
Figure 4.

Proton spin–lattice relaxation rates measured at 14 and 28 MHz for NaCB11H12@SBA-15 (100% loading) as functions of the inverse temperature. The black solid lines show the results of the simultaneous fit of a two-peak model to the data in the range 80–426 K. The dashed lines show the contributions of the faster (blue) and slower (red) jump processes to the fit. For comparison, the magenta lines show the behavior of the proton spin–lattice relaxation rate at 28 MHz in bulk NaCB11H12 (from ref (31)).
Figure 5 shows the measured 23Na spin–lattice relaxation rate R1Na as a function of the inverse temperature. In the temperature range 150–320 K, R1 exhibits a behavior typical of the motionally induced spin–lattice relaxation with the characteristic peak near 270 K, indicating that the diffusive Na+ jump rate τd–1 reaches approximately ω ∼8 × 10⁸ s–1 at this temperature. An activation energy of 162(4) meV for the Na+ diffusive motion, Ea, was extracted by fitting the R1Na(T) data in the temperature range 150–270 K; see Figure 5. Further details are given in the Supporting Information. In addition to the R1(T) peak near 270 K, there is an increase in R1Na(T) above 330 K, suggesting that there may be a second high-temperature relaxation rate peak, and thus, a second (slower) Na+ jump process may coexist with the faster Na+ jump process responsible for the R1(T) peak near 270 K.
Figure 5.

23Na spin–lattice relaxation rate measured at 132 MHz for NaCB11H12@SBA-15 (100% loading) as a function of the inverse temperature. The solid line shows the model fit (eq. S2 in the Supporting Information) to the data in the range 150–270 K.
The evolution of the 1H and 23Na NMR line widths (ΔH and ΔNa) as a function of temperature for NaCB11H12@SBA-15 is shown in Figure 6. At low temperatures, ΔH is determined by dipole–dipole interactions in the “rigid” lattice and is similar to the “rigid–lattice” ΔH values (∼50 kHz) of other polyhedral hydro(carba)borate salts.20,31 With increasing temperature, ΔH starts to decrease because the dipole–dipole interactions between nuclear spins are partially averaged by the reorientational motion of the anions. A considerable decrease in ΔH is expected when τ–1 becomes comparable to the “rigid–lattice” linewidth,29 which can be seen to occur near 100 K for the NaCB11H12@SBA-15 nanocomposite. This indicates that the reorientational jump rate reaches ∼3 × 10⁵ s–1 at this temperature. A typical feature of complex hydrides with reorienting anions is that ΔH reaches a significant nonzero plateau value at higher temperatures.32 This indicates that the motion is a localized H motion (e.g., anion reorientations) because the dipole–dipole interactions of 1H spins are not fully averaged by such motions, which leads to an offset.
Figure 6.

Temperature dependences of the 1H and 23Na NMR line widths (FWHM) measured for NaCB11H12@SBA-15 (100% loading) at 28 MHz (1H) and 132 MHz (23Na).
For ΔNa, a strong narrowing near 180 K can be observed, indicating the onset of fast diffusive motion of Na+ cations with jump rates exceeding ∼104 s–1. While the ΔH high-temperature plateau value exhibits a significant offset, the ΔNa high-temperature plateau value is close to zero (∼ 0.95 kHz). This indicates that the Na+ cations participate in the long-range diffusion, which leads to an averaging out of both the dipole–dipole and quadrupole interactions of the 23Na nuclei.
QENS measurements were conducted on the nanocomposites to examine the CB11H12– anion dynamics in further detail. In line with the NMR results, the nonhysteretic neutron-elastic-scattering FWSs for NaCB11H12@SBA-15 (100% loading) using HFBS (shown in Figure 7) indicate that anion reorientational jump rates enter the lower edge of the HFBS frequency window of 107 jumps s–1 by ∼170 K, as signaled by the onset of a steeper drop in the elastic intensity above the more gradual Debye–Waller decay as the temperature is increased from 120 K. This steeper drop is a reflection of increasing quasielastic (Doppler-like) broadening of a portion of the elastic peak.33 At room temperature, this quasielastic component becomes too broad to further affect the elastic intensity, and the elastic intensity starts to reflatten out in the Debye–Waller fashion, indicating that the jump rates for the nanoconfined anions now well exceed the order of 1010 jumps s–1. Again, as hinted by the NMR results, the FWSs and underlying anion mobilities for NaCB11H12@SBA-15 are similar to those for the superionic Na2(CB9H10)(CB11H12) mixed-anion solid solution.10
Figure 7.

Neutron elastic-scattering FWS behavior for NaCB11H12@SBA-15 (100% loading) compared with that for bulk NaCB11H12.10 The gray lines indicate the decrease in the integrated FWS intensity related to the Debye–Waller factor summed over detectors covering a Q range of 0.87 to 1.68 Å–1. Arrows differentiate heating and cooling scans. For a reasonable qualitative comparison, the individual data sets were scaled so as to have similar minimum and maximum intensities. Inset: reorienting CB11H12– anion with C, B, and H atoms denoted by brown, green, and white spheres, respectively.
It is clear from the heating and subsequent cooling scans for NaCB11H12@SBA-15 shown in Figure 7 that the anion mobilities exhibit nonhysteretic temperature dependence, which is consistent with the lack of any significant structural changes. This is in contrast to the hysteretic and sharper FWS decrease and increase observed for bulk NaCB11H12, which reflect the abrupt hysteretic order–disorder phase transformations between the lower-temperature, ordered orthorhombic structure (with anion jump rates <107 jumps s–1) to the higher-temperature, disordered structures (with anion jump rates >1010 jumps s–1).
QENS spectra for both NaCB11H12@SBA-15 (100% loading) and NaCB11H12@KCC-1 (150% loading) typically consisted of a delta function (elastic scattering) and a Lorentzian function (quasielastic scattering), both convoluted with the instrumental resolution function above a flat baseline (Figure S6). The fundamental anion reorientational jump frequency τ1–1 inferred by the FWSs was extracted from the Lorentzian quasielastic linewidth (FWHM) Γ at low Q (≤0.8 Å–1) as a function of temperature via the relation τ1–1 = Γ/(2ℏ) and is shown in Figure 8 in comparison with that measured previously for bulk NaCB11H12.34 As seen, the reorientational jump frequencies of the anions in the high-temperature disordered phase of bulk NaCB11H12 (red) and both nanocomposites (blue and black) exhibit similar temperature-dependent behaviors above the bulk phase-transition temperature. This implies that SiO2-nanoconfined NaCB11H12 also possesses a bulk-like disordered structure in this temperature region. While the jump frequency decreases by two orders of magnitude for bulk NaCB11H12 upon cooling through the phase transition (indicated by the red arrows in Figure 8), the nanocomposite jump frequency, on the other hand, continues to extend its slower Arrhenius decrease to a low temperature, with a slope [−Ea/kB; based on the relationship τ1–1 = τ0–1 exp (−Ea/kBT), where τ0–1, Ea, and kB are the attempt frequency, activation energy, and Boltzmann constant, respectively] similar to the slope of the bulk NaCB11H12 jump frequency above its phase transition. In particular, the resulting activation energy for the combined NaCB11H12@SBA-15 and NaCB11H12@KCC-1 data over the broad temperature range of 235–410 K is 118(9) meV, which is in line with the 112 meV for bulk NaCB11H12 above the phase transition derived from previous QENS experiments.34
Figure 8.

Anion reorientational jump frequencies τ1–1 for NaCB11H12 nanoconfined in SBA-15 (100% loading) and KCC-1 (150% loading) compared with those for bulk NaCB11H12,34 as determined by QENS. The red line shows the reorientational frequencies for the low-temperature phase of bulk NaCB11H12 determined by NMR,31 while the red arrows indicate the low-to-high/high-to-low phase-transition temperatures.
We point out that the corresponding values of the activation energies obtained from proton NMR (as detailed in the Supporting Information) are 178 meV (the average activation energy for the faster reorientational jump process in NaCB11H12@SBA-15) and 177 meV (for the high-T disordered phase of bulk NaCB11H12).31 It should be noted that the activation energies derived from QENS measurements for a number of disordered phases of polyhedral hydro(carba)borates appear to be somewhat lower than those resulting from proton NMR experiments. This feature is not uncommon, as explained in a previous study;28 the most probable reason for such a systematic discrepancy is the presence of a certain distribution of H jump rates.
Figure 9 displays the Q-dependence of the elastic incoherent structure factor (EISF) for NaCB11H12@SBA-15 (100% loading) at two temperatures (400 and 325 K, which are, respectively, above and below the bulk-phase-transition temperature), compared with that reported previously for superionic disordered bulk NaCB11H12 at 480 K.34 The EISF is defined as the ratio of integrated neutron elastic scattering intensity to integrated total (elastic+quasielastic) scattering intensity (see Figure S6 in the Supporting Information for further details). The good agreement with the model curve shown in Figure 9 indicates that the CB11H12– anions in the disordered bulk NaCB11H12 preferentially undergo uniaxial fivefold (2π/5) reorientational jumps around the CB11H12– anion C5 symmetry axis. It is also apparent that the anions in the nanoconfined NaCB11H12 follow this same C5 model curve, both above and below the bulk order–disorder transition temperature. This not only further corroborates the dynamical similarities between the nanoconfined NaCB11H12 (over the entire temperature range probed) and bulk NaCB11H12 above its phase transition but also confirms that all CB11H12– anions in the nanoconfined NaCB11H12 remain highly mobile, even below the bulk phase-transition temperature. Indeed, any immobile, bulk-like fraction present in the nanopores would result in an anomalous increase in the measured EISF values at 325 K compared to those at 400 K and those for bulk NaCB11H12 at 480 K (Figure 9) because of an increased fraction of the elastic scattering intensity originating from such an immobile fraction.
Figure 9.

Comparison of the elastic incoherent structure factor (EISF) behavior for NaCB11H12@SBA-15 (100% loading) at 325 and 400 K with that previously reported for superionic disordered bulk NaCB11H12 at 480 K,34 all shown to exhibit aQ-dependence that matches the specific model curve (black line) expected for uniaxial fivefold (2π/5) reorientational jumps around the CB11H12– anion C5 symmetry axis35 (see inset). Further model details can be found in the Supporting Information.
The combined NMR and QENS dynamical results are in line with the PXRD structural results, all pointing to the stabilization of a disordered bulk-like phase for SiO2-nanoconfined NaCB11H12 over the entire studied temperature range, down to cryogenic temperatures.
Cationic Conductivity
The Na+ ionic conductivities for three nanocomposites, NaCB11H12@SBA-15 (100% and 133% loadings) and NaCB11H12@KCC-1 (125% loading), are compared with those for bulk NaCB11H12 (Figure 10). For the bulk (red), two regions can be observed: a high-temperature region, where the sample is in its dynamically disordered phase with superionic conductivity (∼1 × 10⁻¹ S cm–1), and a low-temperature region, where the ionic conductivity is poor (∼1 × 10⁻⁵–1 × 10⁻⁶ S cm–1) because of the sample being in its ordered orthorhombic phase. Separating these two regimes is a phase-transition region where the conductivity changes drastically. The behavior of the nanoconfined NaCB11H12 (green, blue, and black) is utterly different; while the materials exhibit lower conductivities at higher temperatures (∼2 × 10⁻³–6 × 10⁻³ S cm–1), there is no pronounced drop at lower temperatures, and the conductivities remain relatively high at room temperature (∼1 × 10⁻⁴–3 × 10⁻⁴ S cm–1). This suggests that a highly conductive, dynamically disordered phase of NaCB11H12 was stabilized by the formation of the nanocomposite. Based on a linear least-squares fit of the plot of ln(σT) vs T–1 shown in Figure S8 for the nanocomposite conductivity data (Figure 10) (133%-loaded SBA-15), a conductivity activation energy Ec of 216 meV was determined from the slope (−Ec/kB) in the temperature range 330–420 K. Below 285 K, a second linear region can be observed with an activation energy of 567 meV. Separating these two regimes is a temperature-transition region (∼285–300 K) where the slope gradually changes from the high-temperature value to the low-temperature value. This two-regime behavior and the corresponding temperature-transition region near the ambient temperature are similar to those observed previously for Na2(CB9H10)(CB11H12).10 Like the closo-anions in this latter mixed-anion compound, the reorientational jump rate frequencies of the CB11H12– anions in NaCB11H12@SiO2 in the temperature-transition region are of the order of 1010 jumps/s, which is only an order of magnitude or so higher than the translational jump frequencies of the Na+ cations.30,31,36 Thus, although still significantly higher than the cation translational jump frequencies in this region, it is likely that further below these temperatures, the anion reorientational jump frequencies become too low and will no longer have such a marked synergistic dynamical effect34 on the cation diffusion, as is the case at higher temperatures. This will ultimately lead to a change in the rate-limiting step, as reflected in the observed increase in Ec to 567 meV. It is worth pointing out that this activation energy for conductivity is significantly larger than that determined for Na+ diffusion by NMR (162 meV) for this corresponding temperature region. However, this is reasonable and commonplace2,4 because the NMR value reflects the local (microscopic) conditions, while Ec reflects the global (macroscopic) conditions that include such additional effects as grain boundaries, pore-filling factors, and nanoparticle/cluster connectivity. The discrepancy in barriers indicates that Ec could potentially be improved to approach more closely the NMR value by addressing and mitigating the abovementioned global conductivity bottlenecks.
Figure 10.

Na+ cationic conductivities extracted from impedance spectroscopy for NaCB11H12@SBA-15 (100 and 133% loading; green and black triangles) and NaCB11H12@KCC-1 (125% loading; blue circles) as compared with those for bulk NaCB11H12 (red squares). In contrast to the hysteresis in conductivity observed for bulk NaCB11H12, none is evident for the nanocomposites. Representative Nyquist plots are shown in the Supporting Information, along with details for extracting the conductivities.
It should be noted that, although solution loadings above 100% shown here lead to dried nanocomposites with a minor amount of bulk NaCB11H12 crystallites outside the nanopores, the threefold poorer conductivities for 100%-loaded SBA-15 compared to 133%-loaded SBA-15 shown in Figure 10 indicate that some excess bulk NaCB11H12 is desirable to improve the ultimate ionic conductivities by presumably acting as a relatively thin bridge for enhancing the connectivity between otherwise contiguous clusters of the nanoconfined NaCB11H12 material from different neighboring SiO2 scaffold particles. Such a strategy was successfully used previously for nanoconfined LiBH4 systems.15
In our studies, although increasing the loadings above the 100% level was found to benefit the conductivities above the bulk phase-transition temperature, above a certain point, it proved to be detrimental to the conductivities below the bulk-phase-transition temperature because of excessive amounts of poorly conductive bulk material separating neighboring SiO2 particles. For example, we observed that increasing the loading of NaCB11H12@KCC-1 from 125 to 150% led to a similar favorable conductivity at 410 K (above the bulk phase-transition temperature) but a sixfold lower conductivity compared to that for 125% loading at room temperature (below the bulk phase-transition temperature).
Although it appears that the highly conductive, disordered NaCB11H12 phase is stabilized within the SiO2 nanopores over a wide temperature range, it is also clear that various extraneous factors cause the ultimate conductivity of the pelletized nanocomposites to be more than an order of magnitude lower than that for bulk NaCB11H12 above its phase-transition temperature. In addition to the deleterious effect of incomplete conductive connectivity pathways that can occur between different infiltrated SiO2 particles, the mere presence of the insulating SiO2 scaffold material dilutes the otherwise conductive NaCB11H12, in effect, reducing the composite conductivity based on the overall cross-sectional area of the pellet. Also, because the infiltration method is solution-based instead of melt-based, the removal of the solvation water after 100% solution infiltration necessarily leaves about 40% void space in the dry-NaCB11H12-infused nanopores (based on saturated-solution and anhydrous NaCB11H12 densities), which likely causes further significant degradation in conductivity. Finally, the resulting pellet density after the compression of both SBA-15- and KCC-1-based samples is found to be roughly two times less than expected based on the densities of SiO2 and NaCB11H12, which means that there is a substantial amount of extra void space accumulated between the SiO2 scaffold particles, in addition to that formed within the nanopores from water removal. For example, assuming that the remaining nanopore void space stays intact after pellet compression, the 100%-loaded SBA-15 should have a theoretical pellet density of ∼1.20 g cm–3 (and 1.76 g cm–3, assuming that the nanopore voids collapse; see details in the Supporting Information), whereas its actual density was 0.71 g cm–3. This suggests that about 40% void space exists in the 100%-loaded SBA-15 sample. Assuming that the extra bulk NaCB11H12 in 133%-loaded SBA-15 fills some of these voids, the density is expected to increase to 0.80 g cm–3, which compares well with the actual density of 0.79 g cm–3 for the 133%-loaded SBA-15 sample.
Strategies that can increase NaCB11H12 connectivity and reduce the fraction of void space should lead to significant improvements in nanocomposite conductivities. These might include using nanoporous silica with different morphologies, larger pore volume fractions, and more favorable compaction properties, as well as performing multiple infiltration/drying treatments with saturated salt solution to minimize intrapore voids.
It is worth noting that the observed nanoconfinement behavior for NaCB11H12 is somewhat different from that found for LiBH4. In contrast to NaCB11H12, multiple studies of LiBH4 nanoconfined in carbon, silica, and alumina scaffolds14,15,37−43 down to subambient temperatures indicate that only a fraction of the infiltrated material near the nanopore walls behaves in a nonbulk-like fashion, with highly reorientationally mobile BH4– anions and highly diffusive Li+ cations, while the remaining fraction near the nanopore center displays more bulk-like behavior with much lower anion and cation mobilities. Moreover, unlike nanoconfined NaCB11H12, where no translational mobility of the otherwise rotationally liquid CB11H12– anions is observed by NMR, long-range diffusive motion of the BH4– anions is indeed observed for the fraction of nanoconfined, nonbulk-like LiBH4 residing near the nanopore wall,38 suggesting the presence of a relatively more fluidic LiBH4 interface layer and a possibly different conduction mechanism. It is thought that this highly conductive LiBH4 layer results from compound-altering interactions with the nanopore wall and may involve the formation of an interfacial space-charge region.44−46
In addition to the differences with nanoconfined LiBH4, the intriguing results shown here for NaCB11H12@SiO2 are also qualitatively dissimilar to the previously mentioned behavior for SiO2-nanoconfined Li2B12H12,17,18 where most, if not all, Li2B12H12 was in a bulk-like ordered α-phase at ambient temperatures, with only a very minor fraction possibly in a highly conductive disordered β-phase normally only stable at much higher temperatures. Based on the known pore-size-dependent bifurcated phase behavior for nanoconfined LiBH4 systems,40,41 it is reasonable to assume that Li2B12H12 might also form a thin disordered-phase layer at the Li2B12H12-SiO2 interface with a predominant core of bulk-like Li2B12H12, even if such bifurcation does not appear to be the case for NaCB11H12@SiO2 for similar nanopore sizes. Nonetheless, whether or not the apparently unremarkable nanoconfined-Li2B12H12 behavior is specific to particular (carba)borates and/or cations is a subject for further studies. Moreover, although the disordered NaCB11H12 polymorphs are superionic phases and are therefore clearly a major contributor to the favorable NaCB11H12@SiO2 nanocomposite conductivities found in this study, at this time, we still do not know to what extent NaCB11H12@SiO2 interface effects enable enhanced Na+ translational mobilities that may also be contributing.
Conclusions
Using a combination of techniques, we have shown that by depositing NaCB11H12 into nanoporous, high-surface-area silica via a simple aqueous salt infiltration method, it is possible to stabilize a bulk-like superionic phase down to cryogenic temperatures. This contrasts with bulk NaCB11H12, which can maintain its disordered superionic polymorphs only above ∼354 K. Even without any further optimization strategies, the nanocomposites presented here show a significantly higher cationic conductivity at room temperature (3 × 10⁻⁴ S cm–1) than for bulk NaCB11H12 (3 × 10⁻⁶ S cm–1) as well as for the best nanoconfined-LiBH4-based composites in SiO2 and Al2O3 (∼1 × 10⁻⁴ S cm–1).14−16 The conductivity of NaCB11H12@SiO2 can likely be further improved by a variety of factors, such as multiple solution loading/drying cycles and/or optimizing the choice of nanostructure used to stabilize the superionic phase. This could potentially solve two of the current issues: insufficient filling of salt in the nanocomposite, leading to less than full conductive connectivity, and the formation of excessive bulk NaCB11H12 coating the nanostructures and thus acting as a resistive layer at lower temperatures. We believe that fused nanoporous SiO2 macrostructures formed via sol–gel or similar synthesis processes to yield interconnecting porous channels, with no external nanoparticle surfaces, could ultimately prove to be better scaffold candidates. Finally, because ball-milling of NaCB11H12 and other polyhedral (carba)borate salts has been previously shown to promote the formation of high-temperature superionic disordered phases at ambient temperatures, a process that was further enhanced by ball-milling with other compounds,9 it may yet turn out to be worthwhile to ball-mill these types of salts together with either nanoporous or high-surface-area nonporous SiO2 or Al2O3, as has already been done successfully with LiBH4,15,45,46 instead of the current solution infiltration procedure. If intermixed finely enough and in the right proportions, the resulting compressed composites could have fully connective three-dimensional networks of superionic salt nanoconfined and stabilized among the oxide scaffold particles, with reduced void volume and thus improved overall conductivity.
Acknowledgments
We thank J. C. Gurowitz for his contributions with respect to the design of the impedance cell and E. E. Huang and Dr. W. S. Tang for their assistance with key measurements during the initial stages of this study. M. S. A. acknowledges the support from the Swedish Research Council (2017-06345). M. D. acknowledges the support from the US DOE Office of Energy Efficiency and Renewable Energy, Fuel Cell Technologies Office (Contract No. DE-AC36-08GO28308). M. T. P. acknowledges the support from the Center for High Resolution Neutron Scattering, a partnership between the National Institute of Standards and Technology and the National Science Foundation (Agreement No. DMR-2010792). M. K. acknowledges the support from the Barbro Osher Pro Suecia Foundation. This work utilized facilities supported by the National Science Foundation (Agreement No. DMR-1508249). This work was performed within the assignment of the Russian federal scientific program “Function” No. AAAA-A19-119012990095-0, supported in part by the Russian Foundation for Basic Research (Grant No. 19-03-00133). Sandia National Laboratories is a multimission laboratory managed and operated by the National Technology and Engineering Solutions of Sandia, LLC., a wholly owned subsidiary of Honeywell International, Inc., for the U.S. Department of Energy’s National Nuclear Security Administration (Contract No. DE-NA-0003525).
Supporting Information Available
The Supporting Information is available free of charge at https://pubs.acs.org/doi/10.1021/acs.jpcc.1c03589.
Complementary DSC, PXRD, NVS, NMR, QENS, and impedance data (PDF)
The authors declare no competing financial interest.
Supplementary Material
References
- Udovic T. J.; Matsuo M.; Unemoto A.; Verdal N.; Stavila V.; Skripov A. V.; Rush J. J.; Takamura H.; Orimo S. Sodium Superionic Conduction in Na2B12H12. Chem. Commun. 2014, 50, 3750–3752. 10.1039/C3CC49805K. [DOI] [PubMed] [Google Scholar]
- Udovic T. J.; Matsuo M.; Tang W. S.; Wu H.; Stavila V.; Soloninin A. V.; Skoryunov R. V.; Babanova O. A.; Skripov A. V.; Rush J. J.; et al. Exceptional Superionic Conductivity in Disordered Sodium Decahydro-Closo-Decaborate. Adv. Mater. 2014, 26, 7622–7626. 10.1002/adma.201403157. [DOI] [PubMed] [Google Scholar]
- Tang W. S.; Unemoto A.; Zhou W.; Stavila V.; Matsuo M.; Wu H.; Orimo S.; Udovic T. J. Unparalleled Lithium and Sodium Superionic Conduction in Solid Electrolytes with Large Monovalent Cage-like Anions. Energ. Environ. Sci. 2015, 8, 3637–3645. 10.1039/C5EE02941D. [DOI] [PMC free article] [PubMed] [Google Scholar]
- Tang W. S.; Matsuo M.; Wu H.; Stavila V.; Zhou W.; Talin A. A.; Soloninin A. V.; Skoryunov R. V.; Babanova O. A.; Skripov A. V.; et al. Liquid-like Ionic Conduction in Solid Lithium and Sodium Monocarba-Closo-Decaborates near or at Room Temperature. Adv. Energy Mater. 2016, 6, 1502237 10.1002/aenm.201502237. [DOI] [Google Scholar]
- Sadikin Y.; Schouwink P.; Brighi M.; Łodziana Z.; Černý R. Modified Anion Packing of Na2B12H12 in Close to Room Temperature Superionic Conductors. Inorg. Chem. 2017, 56, 5006–5016. 10.1021/acs.inorgchem.7b00013. [DOI] [PubMed] [Google Scholar]
- Hansen B. R. S.; Paskevicius M.; Jørgensen M.; Jensen T. R. Halogenated Sodium-Closo-Dodecaboranes as Solid-State Ion Conductors. Chem. Mater. 2017, 29, 3423–3430. 10.1021/acs.chemmater.6b04797. [DOI] [Google Scholar]
- Paskevicius M.; Hansen B. R. S.; Jørgensen M.; Richter B.; Jensen T. R. Multifunctionality of Silver Closo-Boranes. Nat. Commun. 2017, 8, 15136. 10.1038/ncomms15136. [DOI] [PMC free article] [PubMed] [Google Scholar]
- Tang W. S.; Dimitrievska M.; Stavila V.; Zhou W.; Wu H.; Talin A. A.; Udovic T. J. Order-Disorder Transitions and Superionic Conductivity in the Sodium Nido-Undeca(carba)borates. Chem. Mater. 2017, 29, 10496–10509. 10.1021/acs.chemmater.7b04332. [DOI] [Google Scholar]
- Tang W. S.; Matsuo M.; Wu H.; Stavila V.; Unemoto A.; Orimo S.; Udovic T. J. Stabilizing Lithium and Sodium Fast-Ion Conduction in Solid Polyhedral-Borate Salts at Device-Relevant Temperatures. Energy Storage Mater. 2016, 4, 79–83. 10.1016/j.ensm.2016.03.004. [DOI] [Google Scholar]
- Tang W. S.; Yoshida K.; Soloninin A. V.; Skoryunov R. V.; Babanova O. A.; Skripov A. V.; Dimitrievska M.; Stavila V.; Orimo S.; Udovic T. J. Stabilizing Superionic-Conducting Structures via Mixed-Anion Solid Solutions of Monocarba-Closo-Borate Salts. ACS Energy Lett. 2016, 1, 659–664. 10.1021/acsenergylett.6b00310. [DOI] [Google Scholar]
- Duchêne L.; Kühnel R.-S.; Rentsch D.; Remhof A.; Hagemann H.; Battaglia C. A Highly Stable Sodium Solid-State Electrolyte Based on a Dodeca/Deca-borate Equimolar Mixture. Chem. Commun. 2017, 53, 4195–4198. 10.1039/C7CC00794A. [DOI] [PubMed] [Google Scholar]
- Brighi M.; Murgia F.; Černý R. Closo-Hydroborate Sodium Salts as an Emerging Class of Room-Temperature Solid Electrolytes. Cell Rep. Phys. Sci. 2020, 1, 100217 10.1016/j.xcrp.2020.100217. [DOI] [Google Scholar]
- Payandeh S.; Rentsch D.; Łodziana Z.; Asakura R.; Bigler L.; Černý R.; Battaglia C.; Remhof A. Nido-Hydroborate-Based Electrolytes for All-Solid-State Lithium Batteries. Adv. Funct. Mater. 2021, 31, 2010046 10.1002/adfm.202010046. [DOI] [Google Scholar]
- Blanchard D.; Nale A.; Sveinbjörnsson D.; Eggenhuisen T. M.; Verkuijlen M. H. W.; Suwarno; Vegge T.; Kentgens A. P. M.; de Jongh P. E. Nanoconfined LiBH4 as a Fast Lithium Ion Conductor. Adv. Funct. Mater. 2015, 25, 184–192. 10.1002/adfm.201402538. [DOI] [Google Scholar]
- Choi Y. S.; Lee Y.-S.; Oh K. H.; Cho Y. W. Interface-Enhanced Li Ion Conduction in a LiBH4–SiO2 Solid Electrolyte. Phys. Chem. Chem. Phys. 2016, 18, 22540–22547. 10.1039/C6CP03563A. [DOI] [PubMed] [Google Scholar]
- Zettl R.; de Kort L.; Gombotz M.; Wilkening H. M. R.; de Jongh P. E.; Ngene P. Combined Effects of Anion Substitution and Nanoconfinement on the Ionic Conductivity of Li-Based Complex Hydrides. J. Phys. Chem. C 2020, 124, 2806–2816. 10.1021/acs.jpcc.9b10607. [DOI] [PMC free article] [PubMed] [Google Scholar]
- Yan Y.; Rentsch D.; Battaglia C.; Remhof A. Synthesis, Stability and Li-Ion Mobility of Nanoconfined Li2B12H12. Dalton Trans. 2017, 46, 12434–12437. 10.1039/C7DT02946B. [DOI] [PubMed] [Google Scholar]
- Møller K. T.; Paskevicius M.; Andreasen J. G.; Lee J.; Chen-Tan N.; Overgaard J.; Payandeh S. H.; Silvester D. S.; Buckley C. E.; Jensen T. R. Molten Metal Closo-Borate Solvates. Chem. Commun. 2019, 55, 3410–3413. 10.1039/C9CC00187E. [DOI] [PubMed] [Google Scholar]
- The mention of all commercial suppliers in this paper is for clarity and does not imply the recommendation or endorsement of these suppliers by NIST.
- Skripov A. V.; Babanova O. A.; Soloninin A. V.; Stavila V.; Verdal N.; Udovic T. J.; Rush J. J. Nuclear Magnetic Resonance Study of Atomic Motion in A2B12H12 (A = Na, K, Rb, Cs): Anion Reorientations and Na+ Mobility. J. Phys. Chem. C 2013, 117, 25961–25968. 10.1021/jp4106585. [DOI] [Google Scholar]
- Udovic T. J.; Brown C. M.; Leão J. B.; Brand P. C.; Jiggetts R. D.; Zeitoun R.; Pierce T. A.; Peral I.; Copley J. R. D.; Huang Q.; et al. The Design of a Bismuth-based Auxiliary Filter for the Removal of Spurious Background Scattering Associated with Filter-Analyzer Neutron Spectrometers. Nucl. Instr. and Meth. A 2008, 588, 406–413. 10.1016/j.nima.2008.02.006. [DOI] [Google Scholar]
- Meyer A.; Dimeo R. M.; Gehring P. M.; Neumann D. A. The High Flux Backscattering Spectrometer at the NIST Center for Neutron Research. Rev. Sci. Instrum. 2003, 74, 2759–2777. 10.1063/1.1568557. [DOI] [Google Scholar]
- Copley J. R. D.; Cook J. C. The Disk Chopper Spectrometer at NIST: A New Instrument for Quasielastic Neutron Scattering Studies. Chem. Phys. 2003, 292, 477–485. 10.1016/S0301-0104(03)00124-1. [DOI] [Google Scholar]
- Azuah R. T.; Kneller L. R.; Qiu Y.; Tregenna-Piggott P. L. W.; Brown C. M.; Copley J. R. D.; Dimeo R. M. DAVE: A Comprehensive Software Suite for the Reduction, Visualization, and Analysis of Low Energy Neutron Spectroscopic Data. J. Res. Natl. Inst. Stan. 2009, 114, 341–358. 10.6028/jres.114.025. [DOI] [PMC free article] [PubMed] [Google Scholar]
- Momma K.; Izumi F. VESTA 3 for Three-Dimensional Visualization of Crystal, Volumetric and Morphology Data. J. Appl. Cryst. 2011, 44, 1272–1276. 10.1107/S0021889811038970. [DOI] [Google Scholar]
- Bayal N.; Singh B.; Singh R.; Polshettiwar V. Size and Fiber Density Controlled Synthesis of Fibrous Nanosilica Spheres (KCC-1). Sci. Rep. 2016, 6, 24888. 10.1038/srep24888. [DOI] [PMC free article] [PubMed] [Google Scholar]
- Ouyang M.; Wang Y.; Zhang J.; Zhao Y.; Wang S.; Ma X. Three Dimensional Ag/KCC-1 Catalyst with a Hierarchical Fibrous Framework for the Hydrogenation of Dimethyl Oxalate. RSC Adv. 2016, 6, 12788–12791. 10.1039/C5RA26602E. [DOI] [Google Scholar]
- Skripov A. V.; Soloninin A. V.; Babanova O. A.; Skoryunov R. V. Anion and Cation Dynamics in Polyhydroborate Salts: NMR Studies. Molecules 2020, 25, 2940. 10.3390/molecules25122940. [DOI] [PMC free article] [PubMed] [Google Scholar]
- Abragam A.The Principles of Nuclear Magnetism, Clarendon Press: Oxford, 1961. [Google Scholar]
- Soloninin A. V.; Skoryunov R. V.; Babanova O. A.; Skripov A. V.; Dimitrievska M.; Udovic T. J. Comparison of Anion and Cation Dynamics in a Carbon-Substituted Closo-Hydroborate Salt: 1H and 23Na NMR Studies of Solid-Solution Na2(CB9H10)(CB11H12). J. Alloys Compd. 2019, 800, 247–253. 10.1016/j.jallcom.2019.06.019. [DOI] [PMC free article] [PubMed] [Google Scholar]
- Skripov A. V.; Skoryunov R. V.; Soloninin A. V.; Babanova O. A.; Tang W. S.; Stavila V.; Udovic T. J. Anion Reorientations and Cation Diffusion in LiCB11H12 and NaCB11H12: 1H, 7Li, and 23Na NMR Studies. J. Phys. Chem. C 2015, 119, 26912–26918. 10.1021/acs.jpcc.5b10055. [DOI] [Google Scholar]
- Skripov A. V.; Soloninin A. V.; Babanova O. A.; Skoryunov R. V. Nuclear Magnetic Resonance Studies of Atomic Motion in Borohydride-Based Materials: Fast Anion Reorientations and Cation Diffusion. J. Alloys Compd. 2015, 645, S428–S433. 10.1016/j.jallcom.2014.12.089. [DOI] [Google Scholar]
- Udovic T. J.; Verdal N.; Rush J. J.; De Vries D. J.; Hartman M. R.; Vajo J. J.; Gross A. F.; Skripov A. V. Mapping Trends in the Reorientational Mobilities of Tetrahydroborate Anions via Neutron-Scattering Fixed-Window Scans. J. Alloys Compd. 2013, 580, S47–S50. 10.1016/j.jallcom.2013.02.025. [DOI] [Google Scholar]
- Dimitrievska M.; Shea P.; Kweon K.; Bercx M.; Varley J. B.; Tang W. S.; Skripov A. V.; Stavila V.; Udovic T. J.; Wood B. C. Carbon Incorporation and Anion Dynamics as Synergistic Drivers for Ultrafast Diffusion in Superionic LiCB11H12 and NaCB11H12. Adv. Energy Mater. 2018, 8, 1703422 10.1002/aenm.201703422. [DOI] [Google Scholar]
- Verdal N.; Udovic T. J.; Rush J. J.; Cappelletti R.; Zhou W. Reorientational Dynamics of the Dodecahydro-Closo-Dodecaborate Anion in Cs2B12H12. J. Phys. Chem. A 2011, 115, 2933–2938. 10.1021/jp200627f. [DOI] [PubMed] [Google Scholar]
- Skripov A. V.; Majer G.; Babanova O. A.; Skoryunov R. V.; Soloninin A. V.; Dimitrievska M.; Udovic T. J. Na+ Diffusivity in Carbon-Substituted Nido- and Closo-hydroborate Salts: Pulsed-Field-Gradient NMR Studies of Na-7-CB10H13 and Na2(CB9H10)(CB11H12). J. Alloys Compd. 2021, 850, 156781 10.1016/j.jallcom.2020.156781. [DOI] [Google Scholar]
- Shane D. T.; Corey R. L.; McIntosh C.; Rayhel L. H.; Bowman R. C.; Vajo J. J.; Gross A. F.; Conradi M. S. LiBH4 in Carbon Aerogel Nanoscaffolds: An NMR Study of Atomic Motions. J. Phys. Chem. C 2010, 114, 4008–4014. 10.1021/jp9107365. [DOI] [Google Scholar]
- Verkuijlen M. H. W.; Ngene P.; de Kort D. W.; Barré C.; Nale A.; van Eck E. R. H.; van Bentum P. J. M.; de Jongh P. E.; Kentgens A. P. Nanoconfined LiBH4 and Enhanced Mobility of Li+ and BH4– Studied by Solid-State NMR. J. Phys. Chem. C 2012, 116, 22169–22178. 10.1021/jp306175b. [DOI] [Google Scholar]
- Liu X.; Majzoub E. H.; Stavila V.; Bhakta R. K.; Allendorf M. D.; Shane D. T.; Conradi M. S.; Verdal N.; Udovic T. J.; Hwang S.-J. Probing the Unusual Anion Mobility of LiBH4 Confined in Highly Ordered Nanoporous Carbon Frameworks via Solid State NMR and Quasielastic Neutron Scattering. J. Mater. Chem. A 2013, 1, 9935–9941. 10.1039/c3ta12051a. [DOI] [Google Scholar]
- Verdal N.; Udovic T. J.; Rush J. J.; Liu X.; Majzoub E. H.; Vajo J. J.; Gross A. F. Dynamical Perturbations of Tetrahydroborate Anions in LiBH4 due to Nanoconfinement in Controlled-pore Carbon Scaffolds. J. Phys. Chem. C 2013, 117, 17983–17995. 10.1021/jp4063737. [DOI] [Google Scholar]
- Suwarno; Ngene P.; Nale A.; Eggenhuisen T. M.; Oschatz M.; Embs J. P.; Remhof A.; de Jongh P. E. Confinement Effects for Lithium Borohydride: Comparing Silica and Carbon Scaffolds. J. Phys. Chem. C 2017, 121, 4197–4205. 10.1021/acs.jpcc.6b13094. [DOI] [PMC free article] [PubMed] [Google Scholar]
- Zou H.; Gradišek A.; Emery S. B.; Vajo J. J.; Conradi M. S. LiBH4 in Aerogel: Ionic Motions by NMR. J. Phys. Chem. C 2017, 121, 15114–15119. 10.1021/acs.jpcc.7b04520. [DOI] [Google Scholar]
- Lambregts S. F. H.; van Eck E. R. H.; Suwarno; Ngene P.; de Jongh P. E.; Kentgens A. P. M. Phase Behavior and Ion Dynamics of Nanoconfined LiBH4 in Silica. J. Phys. Chem. C 2019, 123, 25559–25569. 10.1021/acs.jpcc.9b06477. [DOI] [Google Scholar]
- Maier J. Ionic Conduction in Space Charge Regions. Prog. Solid State Chem. 1995, 23, 171–263. 10.1016/0079-6786(95)00004-E. [DOI] [Google Scholar]
- Choi Y. S.; Lee Y.-S.; Choi D.-J.; Chae K. H.; Oh K. H.; Cho Y. W. Enhanced Li Ion Conductivity in LiBH4–Al2O3 Mixture via Interface Engineering. J. Phys. Chem. C 2017, 121, 26209–26215. 10.1021/acs.jpcc.7b08862. [DOI] [Google Scholar]
- Lefevr J.; Cervini L.; Griffin J. M.; Blanchard D. Lithium Conductivity and Ion Dynamics in LiBH4/SiO2 Solid Electrolytes Studied by Solid-State NMR and Quasi-Elastic Neutron Scattering and Applied in Lithium-Sulfur Batteries. J. Phys. Chem. C 2018, 122, 15264–15275. 10.1021/acs.jpcc.8b01507. [DOI] [Google Scholar]
Associated Data
This section collects any data citations, data availability statements, or supplementary materials included in this article.