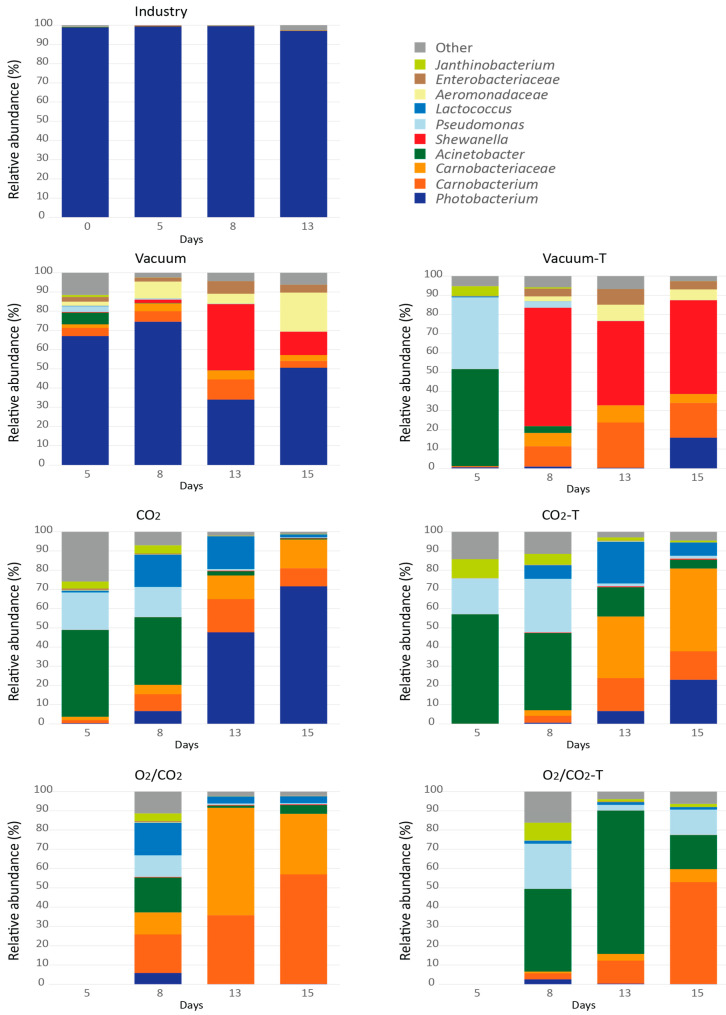
Figure 3.
The dominating bacteriota
(relative abundance) during storage with different packaging and processing. Each point is represented as an average of one to three parallels. Taxa with abundance above 1% across all samples is represented, the rest is presented as “Other”. Taxa is represented at either genus (g) or family (f) level by different colors:  Photobacterium;
  Carnobacterium;
  Carnobacteriaceae;
  Acinetobacter;
  Shewanella;
  Pseudomonas;
  Lactococcus;
  Aeromonadaceae;
  Enterobacteriaceae;
  Jantinobacterium;
  Other. Day 5 samples from O2/CO2 are missing from the MiSeq analysis and are marked with grey shading in the figure.

