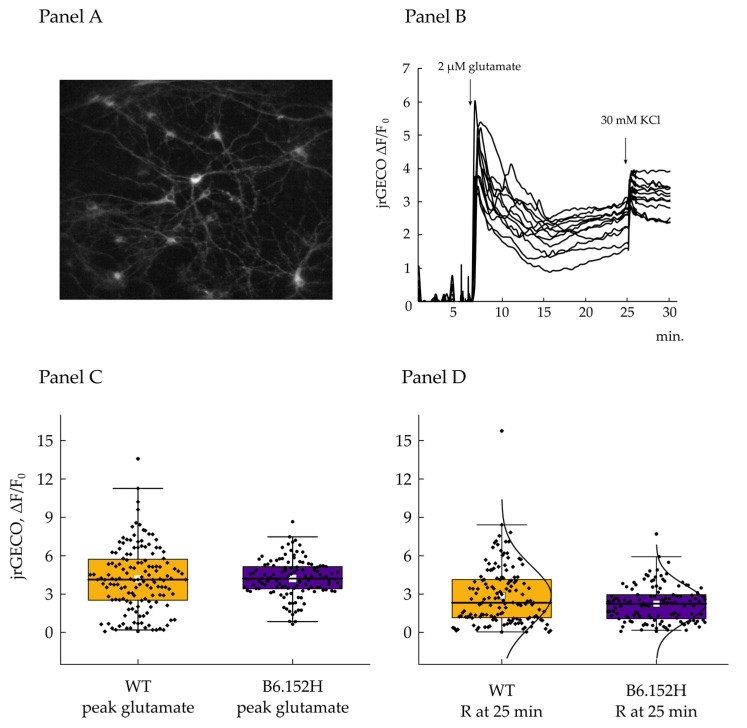
Figure 7.
Cytosolic Ca2+ transient in primary hippocampal neurons induced by glutamate. Panel (A), representative image of 14 div hippocampal neurons expressing cytoplasm-targeted jrGECO. Panel (B), representative traces of jrGECO fluorescence expressed as the normalized values of the difference between time point F minus the average of the initial 5 min of acquisition (F0); where indicated the cells were challenged with 2 μM glutamate and 30 mM KCl. Panel (C), quantification of the jrGECO fluorescence measured at the maximum peak reached after glutamate addition and expressed as normalized difference with initial fluorescence F0. WT n = 144 cells, median value = 4.13; B6.152H n = 121 cells, median value = 4.2. Two sample t-test prob. = 0.9; at the 0.05 level, the difference between the means is not significantly different from 0. Panel (D), jrGECO fluorescence measured 20 min after glutamate addition and expressed as before. WT n = 144, median value = 2.33; B6.152H n = 121 cells, median = 2.24; Mann–Whitney test Asymp prob = 0.1. At the 0.05 level, the two distributions are not significantly different. Box plot: Box height, 25–75%; whiskers, 1–99%; white square: Mean; transverse line: Median; curve: Normal distribution.

