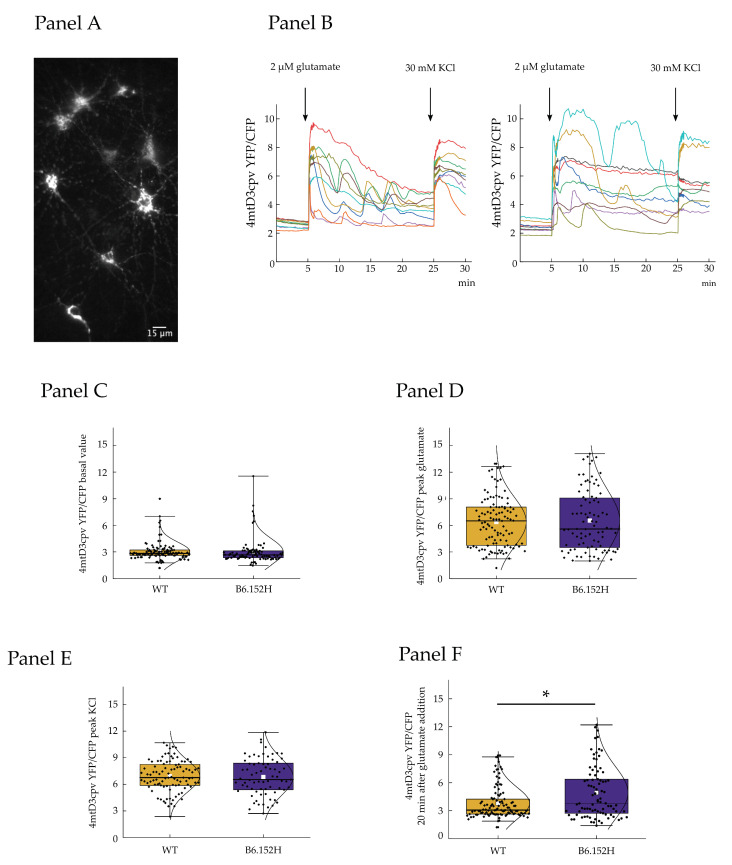
Figure 8.
Mitochondrial Ca2+ transients in hippocampal primary cultures induced by glutamate. Panel (A), representative image of 14 div hippocampal neurons expressing mitochondria-targeted cameleon probe 4mtD3cpv. Panel (B), representative traces of mitochondrial Ca2+ uptake in hippocampal neurons expressing 4mtD3cpv, left WT; right B6.152H cells. Where indicated the cells were challenged with 2 μM glutamate and 30 mM KCl addition. Panels (C–E), quantifications of 4mtD3cpv ratio fluorescence for, respectively: C basal values (WT n = 111 cells, median = 2.83; B6.152H n = 89 cells, median = 2.66, Mann–Whitney probability test, exact prob. = 0.063: at the 0.05 level, the two distributions are not significantly different); (D), peak glutamate (WT n = 111 cells, median = 6.5; B6.152H n = 89 cells, median = 5.6, Mann–Whitney probability test, exact prob. = 0.858: at the 0.05 level, the two distributions are not significantly different); (E) peak KCl (WT n = 95 cells, median = 6.76; B6.152H n = 71 cells, median = 6.54, Mann–Whitney probability test, exact prob. = 0.65: at the 0.05 level, the distributions are not significantly different). Panel (F), quantification of the 4mtD3cpv fluorescence ratio measured 20 min after the addition of 2 μM glutamate (WT n = 111, median = 3.07; B6.152H n = 85 median = 3.79, Mann–Whitney probability test, exact prob. = 0.029: at the 0.05 level, the distributions are significantly different). Box plot: Box height, 25–75%; whiskers, 1–99%; white square, mean; transverse line median; curve, normal distribution equation. The spontaneous movements of mitochondria during the acquisition were controlled for in off-line analysis to ensure the evaluated organelles rested within the boundary of the outlined roi. * p ≤ 0.05.

