

Abstract
Post-Traumatic Stress Disorder (PTSD) is a psychiatric condition resulting from threatening or horrifying events. We hypothesized that circadian rhythm changes, measured by a wrist-worn research watch are predictive of post-trauma outcomes. Approach: 1618 post-trauma patients were enrolled after admission to emergency departments (ED). Three standardized questionnaires were administered at week eight to measure post-trauma outcomes related to PTSD, sleep disturbance, and pain interference with daily life. Pulse activity and movement data were captured from a research watch for eight weeks. Standard and novel movement and cardiovascular metrics that reflect circadian rhythms were derived using this data. These features were used to train different classifiers to predict the three outcomes derived from week-eight surveys. Clinical surveys administered at ED were also used as features in the baseline models. Results: The highest cross-validated performance of research watch-based features was achieved for classifying participants with pain interference by a logistic regression model, with an area under the receiver operating characteristic curve (AUC) of 0.70. The ED survey-based model achieved an AUC of 0.77, and the fusion of research watch and ED survey metrics improved the AUC to 0.79. Significance: This work represents the first attempt to predict and classify post-trauma symptoms from passive wearable data using machine learning approaches that leverage the circadian desynchrony in a potential PTSD population.
Keywords: Actigraphy, Circadian rhythms, mHealth, Photoplethysmography, Post-traumatic stress disorder, Wearables
I. Introduction
POST-traumatic stress disorder (PTSD) is a psychiatric condition that can develop after exposure to threatening or horrifying events. Significant symptoms consistent with the eventual development of PTSD may manifest within days, weeks or months, and more rarely, a year or two after the traumatic event [1]. Symptoms may include persistent intrusive memories of trauma, sleep disturbances, avoidance of stimuli related to the trauma, hyperarousal, and negative changes in mood and cognition. PTSD can result from events such as violent personal assaults, natural or human-caused disasters, motor vehicle collisions, combat, and other forms of violence [2]. It has been shown that patients with PTSD experience sleep disturbance, particularly in terms of nightmares and panicked awakenings from sleep [3]. In addition, various studies suggest a significant comorbidity of pain with PTSD [4]. Many models have been developed to explain this co-occurrence of pain and PTSD, including the mutual maintenance model [5]. According to this model, pain acts as a reminder of the traumatic event and maintains PTSD symptoms. Then, these symptoms reduce the ability to cope with pain effectively. Although approximately 90% of all U.S. adults report exposure to at least one traumatic event in their lifetime, most do not develop PTSD [6]. It has been shown in previous studies that the majority of individuals experience PTSD onset within the first three months after trauma, while “delayed expression” PTSD (after six months) was observed on average for 15.3% of the cases [7].
Accurate prediction of PTSD in the early aftermath of trauma would enable early preventive interventions [8]. Rothbaum et al. [9] showed that trauma survivors receiving an early modified prolonged exposure intervention reported significantly less PTSD severity compared to the assessment group. It has also been shown in a preliminary study that administering an early single high-dose hydrocortisone could reduce the risk of PTSD development [10]. Unfortunately, PTSD prediction using standard survey data remains a challenge, since potential risk factors (such as age, gender, previous trauma) did not show a strong association with PTSD [10, 11, 12]. In a previous study, Schultebraucks et al. [13] combined biomarker data with clinical assessments from the emergency department (ED) to build a cross-validated prediction algorithm. By fusing these two modalities, the model’s AUC for classifying participants with non-remitting PTSD symptoms from participants with resilient trajectories was 0.83 on a validation dataset. They also tested the use of electronic medical records alone and achieved an AUC of 0.72, which outperformed the baseline classifier (AUC=0.62). In another work, video and audio-based features were used with a deep learning classifier and achieved an AUC of 0.90 for predicting PTSD one month after ED enrollment [14].
The exponential increase in consumer wearables, and in wearable technology generally, has created an exciting opportunity to predict adverse mental health outcomes using wrist-wearable data [15, 16]. Two key outputs of wrist-wearable data are heart rate variability (HRV) and actigraphic data. Individual differences in a various time- and frequency-domain HRV measures have been found to predict a range of mental and physical health outcomes, including depression, anxiety, and poorer cardiovascular health [17, 18]. On the other hand, individuals with established PTSD have been shown to have HRV profiles consistent with increased sympathetic nervous system activity during sleep [19, 20]. In a previous pilot study, by using a dataset of 23 subjects with current PTSD and 25 control subjects, the authors found that HRV features derived from time periods with the lowest heart rate in 24-hour periods classify PTSD with an AUC of 0.86 [21]. Actigraphy data can be used to estimate sleep disturbance using derived sleep/wake estimates and the rest/activity patterns [22]. Many studies utilized actigraphy as an objective tool to characterize disturbances in sleep and circadian rhythm in PTSD [23, 24]. However, analyses were confined to identifying statistically significant differences in populations and cross-validated classification analysis was not performed.
In this study, the extent to which the PTSD outcome can be predicted from circadian rhythm changes was investigated, using longitudinal data passively collected from a research watch. A novel approach to distinguishing between people that will and will not develop PTSD after exposure to a trauma is presented. At its core, the method is based on a classification algorithm fed by a set of actigraphy-based features and HRV metrics.
Data were analyzed using cosinor-based rhythmometry method [25] to completely automate the detection of rest/activity periods without the need for subjective information such as sleeping diaries or time zone information in the setting of both complete and missing data (the latter resulting from non-compliance or dead batteries). HRV metrics were extracted together with actigraphy features to quantify rest and activity states and examined the effect of varying the duration of data used to predict PTSD outcome. In this study, we passively collected longitudinal data from a research watch, assessed circadian rhythm changes, and trained a classifier to distinguish people that develop PTSD after exposure to trauma from those that do not develop PTSD.
II. METHODS
A. Participants and overview of data collection
The AURORA dataset, used in this work, consisted of individuals who present to participating emergency departments within 72 hours of a traumatic event. Traumatic events that qualified automatically for study enrollment were motor vehicle collision, physical assault, sexual assault, fall >10 feet, or mass casualty incidents. The patients ranged in age from 18 to 75 years [26]. Although the AURORA study’s aim is to collect data from 5000 individuals, the data is being analyzed in a series of tranches (or ‘freezes’) to report results to the scientific community. This approach also allows future data to act as a truly independent test set. For the current study, we present the analysis of the first set of participants (N=1618) enrolled between July 31, 2017, and July 31, 2019. There were 2312 subjects enrolled until July 31, 2019. Participants who were deceased, those who dropped, who were pregnant or incarcerated, or anyone for whom the medical data extraction form was not available were not included in the released analyzable cohort, making the final dataset size 1618 participants. These 1618 participants are referred to as ‘Freeze 2’ dataset. Demographics (age, sex, BMI, and employment status) of the participants are shown in Table I. The number of participants in the outcome classes depended on compliance to the outcome surveys (administered at week eight), research watch data, and the ED surveys as illustrated in Fig. 1 and described in detail in Section II-B.
TABLE I:
Freeze 2 dataset participant demographics. p values calculated using Wilcoxon rank sum test (age, BMI) or Fisher exact test (sex, employment) between PCL-5 ≥ 31and PCL-5 < 31 participants. Age and BMI are shown as Mean (SD).
| Total | Week 8 PCL-5 ≥ 31 |
Week 8 PCL-5 < 31 |
P val. |
||
|---|---|---|---|---|---|
|
| |||||
| Sex | M | 581 | 156 | 194 | 0.57 |
| F | 1037 | 409 | 471 | ||
|
| |||||
| Age | 35 (13) | 36 (12) | 35 (13) | 0.31 | |
|
| |||||
| BMI | 30.4 (8.7) | 30.7 (9.2) | 30.3 (8.4) | 0.53 | |
|
| |||||
| Emp. Status | Employed | 1064 | 374 | 545 | 0.05 |
| Other | 554 | 191 | 220 | ||
|
| |||||
SD: Standard deviation
Fig. 1.

AURORA Freeze 2 Dataset overview and number of participants in each outcome group that is used in this research. Outcome surveys applied at week eight (PCL-5, PSQIA-PanicSleep, and PROM-Pain4a) were used to create the outcome groups. ED surveys included PDI, MCEPS and PCL-5 administrated at ED department following trauma. Top row of the tables indicates the number of participants that answered the outcome surveys, which is the maximum number available for the analysis. The rows below the first row indicate if the participants shared other modalities in addition to the outcome surveys.
The AURORA study protocol was ethically approved by the central Institutional Review Board (IRB #17–0703) at the University of North Carolina Chapel Hill. Participants were asked to wear a research watch (Verily Life Sciences, San Francisco) at least 21 hours a day for the eight-week period and at subsequent times that vary by the study participant, as shown in Fig. 2. This research watch collected accelerometry and the photoplethysmogram (PPG) data at 30 Hz for this period.
Fig. 2.

Percentage of hours with actigraphy and derived heart rate (HR) data in the eight-week study period. If no samples are captured in a given clock hour, that hour is marked as empty.
B. Patient class labels and survey tools
Three clinical surveys were administrated in the ED – the Peritraumatic Distress Inventory (PDI), PCL-5, and Michigan Critical Events Perception Scale (MCEPS) [27, 28], as shown in Fig. 3. The PCL-5 administered at the ED solicited information on symptoms 30 days prior to the traumatic event. The raw scores of these surveys were used as features to the models to determine if prediction of the outcomes is feasible without using the research watch data.
Fig. 3:
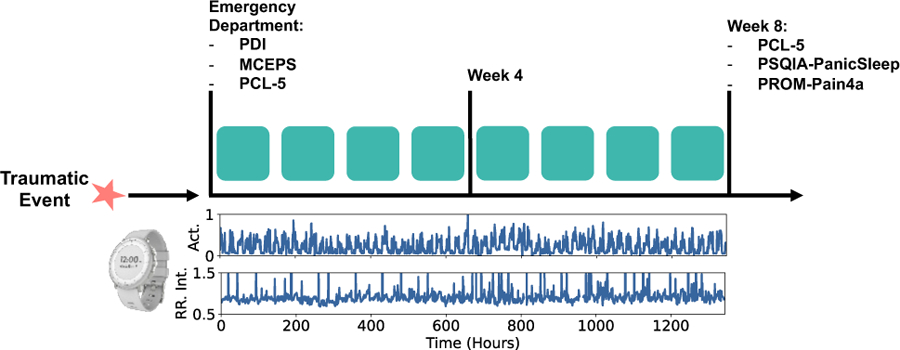
Timeline of data collection and clinical surveys. In the bottom plots, actigraphy and RR Interval data collected with the research watch is illustrated.
Three clinical surveys administered at the eighth week of the study were used to create the binary outcome classes. These outcomes could potentially be used to identify subjects who require intervention to prevent or reduce the severity of PTSD. Firstly, the PCL-5 survey scores were used to capture PTSD symptoms outlined by DSM-5 criteria [2]. The score PCL-5=31 was used as the threshold, following the recommendation of the developers of the PCL-5 survey [29].
Secondly, since patients with PTSD report sleep disturbance, the PCL-5 questionnaire was combined with one item from Pittsburgh Sleep Quality Index Addendum (PSQIA-PanicSleep) in order to measure sleep anxiety and panic [23, 30, 31, 32]. The question and response categories were modified as follows to assess the difficulty of staying asleep: “In the ‘reference period’, how often did you awaken from sleep with severe anxiety or panic?’’ so that 0 = “never’’, 1 = “less than once a week’’, 2 = “1–2 nights a week’’, 3 = “3–4 nights a week’’ and 4 = “every or nearly every night’’. The cut-off for the survey was selected in order to separate participants with severe sleep disturbance. In this outcome, participants with PSQIA-PanicSleep ≥ 3 and PCL-5 ≥ 31 were assigned to the first class while PSQIA-PanicSleep < 3 and PCL-5 < 31 were assigned to the second class. This outcome is referred to as PTSD-Sleep Panic/Anx. outcome.
It has been shown in previous studies that chronic pain could accompany PTSD [5]. For the third outcome, the PCL-5 survey was combined with PROMIS Pain Interference Short Form 4a (PROM-Pain4a) [33]. In this survey, the participant was asked to rate how much pain interfered with different areas of life on a 5-point scale (1 = “not at all,” 2 = “a little,” 3 = “some,” 4 = “a lot,” and 5 = “extremely.”). The same scoring rules as the PROMIS Pain Interference Short Form 4a scale was used; the response values were summed and converted to a T-score. The T-score rescales the raw score into a standardized score with a mean of 50 and a standard deviation of 10. A higher PROMIS T-score represents more of the concept being measured and the T-scores help in interpreting the PROMIS scores in a clinically meaningful way (More information about the T-scores could be found in www.healthmeasures.net). By using the PROMIS T-score guidelines, the cut-offs were selected for mild and severe pain interference following the guidelines for T-score interpretation. Participants with PROM-Pain4a ≥ 66.6 (corresponding to a raw score of 16) and PCL-5 ≥ 31 were assigned to first class while PROM-Pain4a < 55.6 (corresponding to a raw score of 8) and PCL-5 < 31 were assigned to second. This outcome is referred to as PTSD-Pain Int. outcome. Fig. 1 illustrates the number of participants in each class, determined by week eight outcome surveys.
C. Preprocessing of research watch data
1). Cardiac data preprocessing
The cardiac activity of each subject was captured from the photoplethysmogram (PPG) signal, a 30 Hz pulsatile waveform derived from the reflected light on the back of the wrist in contact with the sensor. The PPG was converted to a normal-to-normal (NN) sinus beat interval time series using the PhysioNet Cardiovascular Signal Toolbox, implemented in the MATLAB programming language [34, 35]. First, peak detection of each pulsatile beat was performed using a previously described method based on gradient thresholding [36]. The first difference of the times of each beat was used to form the inter-beat interval time series. Then, non-sinus intervals were detected and removed by measuring the relative change in the current inter-beat interval from the previous inter-beat interval. Intervals that changed by more than 20% were excluded. Inter-beat intervals outside of the physiologically possible range were also removed. The NN beat interval time series is commonly thought to reflect autonomic influences on cardiac function [37].
2). Accelerometer data preprocessing
The accelerometer data was converted to actigraphy counts before the feature extraction step, using the Actigraphy Toolbox which was implemented in the MATLAB programming language [38]. Borazio et al. describe the conversion of the raw 3D accelerometer data to activity counts [39]. Activity counts are the output format of most commercial actigraphy devices; data are summarized over 30-second epochs or time intervals. This conversion reduces required the memory for storing data and eliminates artifacts and noise. Z-axis actigraphy data were bandpass filtered 0.25–11 Hz to eliminate extremely slow or fast movements [22]. The maximum values inside 1-second windows were summed for each 30-second epoch of data. These summations were scaled to obtain activity counts for each epoch [40]. Actigraphy data are commonly represented as a “double plot”, which shows activity levels (measured via accelerometry in this case). Fig. 4 illustrates this for one participant using eight weeks of actigraphy data. Each column is created by stacking two consecutive days of data. The first column shows activity levels on days 1–2, the second column shows days 2–3, and so on. Darker colors indicate lower levels of activity.
Fig. 4.

Detection of rest and activity regions from actigraphy data. Lighter colors indicate higher intensity movements. Deviations from the typical pattern are seen on days 40–56 in this example participant.
3). Cosinor-based rest and activity region identification
Single-component cosinor models were used to detect 24-hour rest and activity regions without any time-zone or sleep diary information [25]. Actigraphy data of each participant were split into 48-hour windows with an overlap of 24-hours. The cosinor model with the following form was then fit to the data
| (1) |
where M is known as the mesor, K is the amplitude, and φ is the phase of the circadian rhythm. By identifying the times at which the cosine fit crossed the mesor baseline, the start and end of rest and active segments of the day were determined. Each of these segments were 12-hour length.
D. Feature extraction from research watch data
After preprocessing, the actigraphy signal in each 30-second epoch, together with the NN interval time series of each participant, was used for feature extraction. Table II describes the features extracted from these preprocessed signals. Features derived from actigraphy included Interdaily Stability (IS), Intradaily Variability (IV), the mean and standard deviation of movement in the detected rest and activity regions, and cosinor-based rhythmometry metrics (Mesor, Amplitude, Phase) [25]. IS quantifies invariability between days while IV quantifies within 24-hour day fragmentation [41]. Cosinor-based rhythmometry metrics can provide information about the participants’ circadian rest-activity cycle. IS and IV were extracted from rest and activity regions by concatenating the days in the window, as indicated by the subscripts. CRS, RSI, and cosinor-based rhythmometry metrics were extracted from each day within the window and then the mean and standard deviation of the metric were calculated. Similarly, for MV metrics, the mean and standard deviation of 12-hour rest and activity regions across the window were extracted.
TABLE II:
Feature Set
| Feature Name | Abbr. | Description | Interpretation |
|---|---|---|---|
| Interdaily Stability | ISrest, ISact | The ratio between the variance of the average actigraphy pattern around the mean and the overall variance. | Quantifies the invariability between the days of study. |
| Intradaily Variability | IVrest, IVact | The ratio of the mean squares of the difference between all successive hours of actigraphy and the mean squares around the grand mean. | Indication of the fragmentation of the actigraphy rhythm. |
| Movement | MVrest,µ, MVrest,σ, MVact,µ, MVact,σ | Mean and standard deviation of movement in the rest and active parts of the day. | Level of activity in given time period. |
| Circadian Rhythm Strength | CRSµ, CRSσ | Average movement in active part of the day divided by average movement in rest region. | Strength of the rest/activity cycle. |
| Rest Start Index | RSIµ, RSIσ | Hour index of the start of rest region. | Approximate start of sleep period of the day |
| Cosinor-based Rhythmometry | Mesorµ, Mesorσ, Amplitudeσ, Amplitudeµ, Phase µ, Phaseσ | Cosine fit to the data (described in Eq. 1), where is known as the mesor, is the amplitude, and is the phase of the circadian rhythm. | Quantifies the circadian rhythm of the participant. |
| Avg. Normal-to-Normal Intervals | NNmeanµ, NNmeanσ | Mean of Normal-to-Normal (NN) intervals | Average heart rate without abnormal beats/arrhythmias |
| IQR of Normal-to-Normal Intervals | NNiqrµ, NNiqrσ | IQR of NN intervals | Statistical dispersion of the NN intervals |
| Kurtosis of Normal-to-Normal Intervals | NNkurtµ, NNkurtσ | Kurtosis of NN intervals | Measures how peaked or flat the distribution of NN intervals is relative to a Gaussian. |
| Skewness of Normal-to-Normal Intervals | NNskewµ, NNskewσ | Skewness of NN intervals | Quantifies the asymmetry of NN interval distribution. Strong asymmetries can be driven by rapid accelerations. |
| SDNN | SDNNµ, SDNNσ | Standard deviation of NN intervals | Reflects all the cyclic components responsible for variability. |
| RMSSD | RMSSDµ, RMSSDσ | Root-mean square differences of successive NN intervals. | Associated with short-term, rapid changes in heart rate, and is correlated with vagusmediated components of HRV. |
| pNN50 | pNN50µ, pNN50σ | Mean number of times per hour in which the change in consecutive NN intervals exceeds 50 milliseconds. | Assesses parasympathetic (vagal) activity. |
| Acceleration and Deceleration Capacity of Heart | ACµ, ACσ, DCµ, DCσ | Acceleration and deceleration capacity of heart, calculated with Phase-rectified signal averaging method. | AC and DC represent an indirect integrated quantification of the activities of the sympathetic and parasympathetic autonomic systems. |
| High Frequency Spectral Content | HFμ, HFσ | Spectral content in high frequency band (0.15 Hz ≤ LF ≤ 0.4 Hz) | Reflects modulation of vagal tone, primarily by breathing. |
| Low Frequency Spectral Content | LFμ, LFσ | Spectral content in low frequency band (0.04 Hz ≤ LF ≤ 0.15 Hz) | Reflects modulation of sympathetic or parasympathetic tone by baroreflex activity. |
| Total Power | ttlpwrµ, ttlpwrσ | Sum of energy in all bands. | Equivalent to variance |
| LF/HF Ratio | LFHFµ, LFHFσ | Ration of LF and HF power. | Indicator of sympathovagal balance. |
| Sample Entropy | SampEnµ, SampEnσ | Sample entropy of NN intervals | Quantifies the likelihood that two sequences similar for points remain similar at the next point (i.e., match within a tolerance of ), not taking into account self-matches |
| Approximate Entropy of Heart Rate | ApEnµ, ApEnσ | Approximate entropy of NN intervals | Quantifies the amount of regularity and the unpredictability of fluctuations over time-series data |
| Signal Quality Index | avgSQIµ, avgSQIσ | Morphology-based quality of each beat | Proportion of unreadable cardiovascular data |
rest, act: Label indicating feature calculated during rest or activity periods.
µ, σ: Mean and standard deviation across the days analyzed.
IQR: Interquartile range.
The HRV feature set was derived using PhysioNet Cardiovascular Signal Toolbox and included time domain, frequency domain and entropy metrics [34]. More details about the HRV features used can be found in Table II. All HRV metrics were calculated in 5-minute segments with a 30-second overlap using the toolbox. Then 5-minute segments from the rest regions, detected by the cosinor method were selected in order to obtain the segments with the fewest movement artifacts and highest signal quality. The mean and standard deviation across the windows were calculated and used as features. Feature extraction was performed on a virtual computer in AWS, (48 vCPUs, 3.6 GHz, 96 GiB memory) and it took about three days for processing monthly data (~700 participant’s data on average).
E. Data organization for model training
As the first step in the pipeline, the data were adjusted by randomly undersampling the majority class in order to address the problem of class imbalance. This imbalance can be seen for PTSD-Sleep Panic/Anx. outcome, where the number of participants was 153 for the first class (PanicSleep ≥ 3 and PCL-5week-8 ≥ 31) and was 613 for the second class (PSQIA-PanicSleep < 3 and PCL-5week-8 < 31). Specifically, all participants from the minority class were used, and the same number of participants from majority class were randomly selected to obtain balanced classes. Undersampling of majority class subjects was repeated in an external cross-validation fold, where n1 was defined as the number of majority class participants and n2 was the number of minority class participants. The external repeats were implemented n1/n2 times, and this ratio was rounded to the nearest integer.
F. Machine learning models
The mapping of the data or derived features into outcome classes is a supervised binary classification problem. All the models were written in the Python 3 language and the programming code is based on Scikit-learn [42]. Three different binary classifiers were trained for each experiment category as follows:
1). Support Vector Machine (SVM):
An SVM is a supervised model that is designed to find the optimal separating hyperplane with the maximum margin within the classes. Linear and radial basis function kernels were used.
2). Logistic Regression:
A logistic regression classifier uses a logistic function to model the probabilities of the outcomes. L2 regularization was used with the logistic regression classifier to achieve a robust model, minimize overfitting and reduce any effect of codependences without reducing the number of features. The regularization strength was set to the default level (1) of the Scikit-Learn logistic regression classifier.
3). Multilayer Perceptron:
A multilayer perceptron (MLP) is a type of supervised classifier with a feedforward architecture, with one or more hidden layers between input and the output. A one-layer MLP with 100 neurons and L2 regularization was used, and these parameters were set at the default values for the Scikit classifier.
A five-fold cross-validation procedure was used for parameter tuning and model assessment and the class prevalence was adjusted to be identical in each fold. The model was trained on the data from all participants except one held-out fold, and the participants in the remaining fold were then used as the test data. This process was repeated to ensure testing on all participants. Performance metrics were calculated for each test fold, and the mean and standard deviation of each metric were calculated across the five folds. After extracting the features, the training phase of the classifier took an average of 0.57 seconds on a 2.3 GHz i5 intel chipset.
G. Overview of Experiments
Three categories of experiments were performed as follows and all models were tested for the full dataset and for the subset of participants whose PTSD outcome at week eight is different from baseline PTSD status assessed in the ED (ex: PCL-5ED < 31 and PCL-5week-8 ≥ 31):
Experiment 1 (survey model):
Prediction of eight-week outcome from ED survey data. The PCL-5ED solicits information on symptoms 30 days prior to the traumatic event. The raw scores of these surveys were used as features to the models.
Experiment 2 (research watch model):
Prediction of eight-week outcome from the data. HRV and actigraphy features described in the previous sections were combined to obtain a feature matrix of 50 columns and models were trained to predict or classify the single corresponding eight-week outcome:
Using all participants and using a 56-day window.
Prediction of eight-week outcome using 7, 14, …, 56 days of HRV and actigraphy features, using participants who contributed data on all days. When an analysis window shorter than 49 days was used, the classifier was “predicting” the outcome at day 56 “ahead-of-time”. However, when the analysis window size was 56 days for example, it reduced to a “classification” task.
Analysis of feature trajectories (daily averages of each feature in the 56-day window): Participants who report as non-PTSD (PCL-5ED < 31) in ED were isolated. Two subgroups were then created by looking at week eight surveys; participants who develop new-onset PTSD and those who remain non-PTSD. Then, the significance of each feature for these subgroups was tested using the Wilcoxon rank sum test.
Experiment 3 (fusion model):
Fusion of research watch and survey models by concatenating the feature sets. Experiment 3 was implemented on participants who contributed both the research watch data and the ED survey data. Survey model and research watch model from previous experiments were also trained on this subset of participants to ensure results are directly comparable and the contribution of fusing modalities could be tested accurately.
III. Experimental Results
A. Results of Experiment 1
The cross-validation performance of different types of classification models using ED survey-based features is shown in Table III. Logistic regression classifier has achieved the highest AUC for all outcome types. Table IV shows all metrics including accuracy, TPR, TNR, and PPV for the logistic regression classifier. Models showed high performance for all outcome types; 0.67, 0.70, and 0.70 accuracies for PTSD, PTSD-Sleep Anx./Panic, and PTSD-Pain Int. outcomes respectively.
TABLE III:
AUC comparison of different classifiers using ED surveys as features for eight-week outcome prediction. Results are reported as mean ± standard deviation.
| Outcome | Log. Reg | MLP | RBF SVM |
Linear SVM |
|---|---|---|---|---|
| PTSD | 0.73±0.03 | 0.73±0.03 | 0.72±0.03 | 0.73±0.03 |
| PTSD, Sleep Anx./Panic | 0.79±0.04 | 0.79±0.05 | 0.76±0.07 | 0.78±0.07 |
| PTSD, Pain Int. | 0.77±0.04 | 0.77±0.04 | 0.74±0.04 | 0.76±0.04 |
TABLE IV:
Performance of logistic regression model using ED surveys as features for eight-week outcome prediction (N=739 for PTSD outcome analysis, N=468 for PTSD-Sleep Anx./Panic outcome analysis, N=326 for PTSD-Pain Int. outcome analysis). Results are reported as mean ± standard deviation.
| Outcome | Acc. | AUC | TPR | TNR | PPV |
|---|---|---|---|---|---|
| PTSD | 0.67±0.01 | 0.73±0.03 | 0.64±0.05 | 0.70±0.05 | 0.69±0.06 |
| PTSD, Sleep Anx./Panic | 0.70±0.06 | 0.79±0.04 | 0.67±0.11 | 0.74±0.07 | 0.72±0.07 |
| PTSD, Pain Int. | 0.70±0.04 | 0.77±0.04 | 0.68±0.03 | 0.73±0.09 | 0.72±0.09 |
The performance was evaluated for the participants for whom PTSD outcome changed from admission to week eight (N=270 for PTSD outcome, N=150 for PTSD-Sleep Anx./Panic outcome, N=110 for PTSD-Pain Int. outcome) without retraining the model. For these subsets of the participants, accuracies of 0.33, 0.32, and 0.34 was achieved for PTSD, PTSD-Sleep Anx./Panic, and PTSD-Pain Int. outcomes respectively.
B. Results of Experiment 2
Table V shows the performance of different classifiers when HRV and actigraphy features were used. It can be seen that similar to Exp. 1, logistic regression classifier performed the best for all outcome types. Models achieved the highest AUC of 0.70 and accuracy of 0.65 when the outcome is PTSD-Pain Int. However, the performance was lower for other outcome types; accuracy was 0.56 for PTSD outcome and 0.58 for PTSD-Sleep Anx./Panic. Table VI shows the logistic regression classifier performance in detail for the research watch models. The model performance was similar for participants undergoing a change in the clinical status. The accuracies were 0.55, 0.59, 0.64 for PTSD, PTSD-Sleep Anx./Panic, and PTSD-Pain Int. outcomes respectively for this subset. For each outcome type, Fig. 5 shows the feature importance determined by the absolute value of the logistic regression coefficients, averaged over folds. Fig. 6 illustrates the AUC from each window size when participants with data contribution from all 56 days are considered. The best performance was achieved when all 56 days were used as the analysis window.
TABLE V:
AUC comparison of different classifiers using HRV and actigraphy features for eight-week outcome prediction. Results are reported as mean ± standard deviation.
| Outcome | Log. Reg | MLP | RBF SVM |
Linear SVM |
|---|---|---|---|---|
| PTSD | 0.56±0.05 | 0.55±0.04 | 0.54±0.03 | 0.56±0.05 |
| PTSD, Sleep Anx./Panic | 0.61±0.06 | 0.60±0.06 | 0.61±0.07 | 0.59±0.06 |
| PTSD, Pain Int. | 0.70±0.02 | 0.69±0.04 | 0.69±0.03 | 0.69±0.02 |
TABLE VI:
Performance of logistic regression model using HRV and actigraphy features for eight-week outcome prediction. Results are reported as mean ± standard deviation.
| Outcome | Acc. | AUC | TPR | TNR | PPV |
|---|---|---|---|---|---|
| PTSD | 0.56±0.03 | 0.56±0.05 | 0.58±0.06 | 0.53±0.06 | 0.55±0.02 |
| PTSD, Sleep Anx./Panic | 0.58±0.05 | 0.61±0.06 | 0.64±0.07 | 0.53±0.08 | 0.58±0.08 |
| PTSD, Pain Int. | 0.65±0.04 | 0.70±0.02 | 0.69±0.04 | 0.63±0.08 | 0.65±0.08 |
Fig. 5.

Feature importance for logistic regression models (window size=56 days). Highest five average absolute feature coefficients across folds are illustrated for each outcome.
Fig. 6.

AUC of the logistic regression models with different window size selection. Subplot (a) shows the AUC for the PTSD outcome, subplot (b) shows PTSD-Panic Sleep/Anx. outcome, and subplot (c) shows PTSD-Pain. Int. outcome over the days.
For the HRV and actigraphy features, the feature trajectories were also investigated. RMSSD, HF and pnn50 features were significantly different between the groups for the highest number of days (N>19) among all features. Fig. 7 illustrates the trajectory of these features over the window.
Fig. 7.

Trajectories of pnn50, HF, and RMSSD features for participants who develop PTSD and who do not, as determined by PCL-5 survey at week eight. Mean of features are shown with solid lines and 95% confidence intervals are shown with the shaded regions.
C. Results of Experiment 3
For comparison with the fusion models, experiments were repeated on the participants who contributed both research watch and survey data. The AUC was improved for participants whose PTSD status has changed, in all outcome types compared to the ED survey only models. For PTSD outcome AUC improvement was two percentage points. For PTSD-Sleep Panic/Anxiety outcome, improvement was six percentage points, and for PTSD-Pain Int. outcome improvement was 26 percentage points. The AUC of the overall model (including all participants) was also improved to 0.79 for PTSD-Pain Int. outcome type as shown in Table VII. However, for all outcome types, AUC of survey and fusion models were not significantly different as determined by Hanley and McNeil two-tailed test.
TABLE VII:
AUC comparison of different model types. Results are reported as mean ± standard deviation.
| Model | PTSD | PTSD-Sleep Anx./Panic | PTSD-Pain Int. |
|---|---|---|---|
| Survey | 0.74±0.03 | 0.77±0.07 | 0.75±0.09 |
| Research watch | 0.54±0.04 | 0.70±0.09 | 0.68±0.04 |
| Fusion | 0.73±0.04 | 0.75±0.09 | 0.79±0.04 |
IV. DISCUSSION
In this work, features and patterns related to circadian rhythmicity derived from data recorded on a research watch were used to predict or detect post-trauma outcomes. Patients with PTSD have previously reported sleep disturbance symptoms including insomnia and nightmares [23]. It has also been shown in previous studies that PTSD has a high co-occurrence with chronic pain, which could interfere with patients’ daily lives [4, 5]. Moreover, PTSD could also result in decreased interest in activities, as stated by the DSM-5 criteria [2]. Therefore, we hypothesized that PTSD may lead to changes in the circadian rhythm that could be captured by the actigraphy and HRV data.
As a baseline, three clinical surveys administered in the ED were used as features to train a logistic regression model to predict eight-week PTSD. By using these ED surveys, the models achieved AUCs of 0.73 for PTSD outcome, 0.79 for PTSD-Panic Sleep/Anx. outcome, and 0.77 for PTSD-Pain. Int. outcome. These results indicate that previous PTSD status and stress experienced immediately following the traumatic event are a significant predictor of PTSD in the following months. However, in general, these models simply predicted that the PTSD status is unlikely to change.
Then, the use of various types of machine learning models with HRV and actigraphy features was investigated. The logistic regression model achieved the highest cross-validated accuracy for predicting the PTSD label at week eight post-trauma when the data from the enrollment until the end of week eight was considered. The weights of the logistic regression model were analyzed to identify the contribution of each feature (Fig 5). NNiqrσ, avgSQIµ, LFµ and LFHFµ had the highest relative importance amongst the HRV features. LF power, in particular, was lower in the population with eight-week PTSD (a mean of 1178 ms2 vs 1562 ms2). Since the LF power is dominantly associated with baroreflex activity, it can be interpreted as blunted baroreflex activity over this period [37], which is consistent with the literature on PTSD [43]. Previous studies have also shown that LF power is significantly different in stressful conditions compared to the resting conditions [44, 45]. Therefore, this metric could be reflecting the stress the participants are experiencing following the traumatic event. From the actigraphy based metrics, the movement during the rest and the active parts of the day, IVact, ISrest, ISact and CRSσ, metrics were the most important. IV measures the fragmentation of rest/activity rhythm and the transitions between rest and activity and IVact shows irregular activity during the daytime. IS is a measure of variability between days [41]. ISrest and ISact were informative when the outcome is PTSD-Sleep Anx./Panic. This could indicate that anxiety resulting from trauma could lead to decoupling from zeitgebers in both rest and activity regions. The feature trajectories over time could help to identify the individuals that may benefit from specialized interventions such as biofeedback therapies for HRV. Fig. 7 shows a significant difference for the mean values of pnn50, HF, and RMSSD between participants who developed PTSD and those who did not.
It is debatable whether collecting data from surveys or a wearable (such as our research watch) represent a lower burden for subjects who develop PTSD. Wearable technologies such as smartwatches (and even mobile phones) are now commonplace and provide the opportunity to collect data without user intervention, while survey-based assessments are active data collection techniques requiring effort and input from the user. However, wearables also require frequent device charging at regular intervals, which is unsustainable in the long term unless a user already is in the habit of doing so. It may not be an either/or proposition though, and these two approaches could complement each other. For example, participants who were not able or willing to fill in the survey at admission could benefit from passive data collection. In our study N=533 participants did not fill the ED surveys, but they wore research watches. For these participants, watch-based models could become the prime monitoring method. However, compliance could also be affected by diagnostic status. Research watch data compliance was calculated as the hours with data divided by total hours in the eight-week window, and it was significantly different in PTSD-Sleep Panic/Anx. groups as determined by Wilcoxon rank sum test. Average compliance was 83% for the first group (PanicSleep ≥ 3 and PCL-5week-8 ≥ 31) and was 86% for the second group (PSQIA-PanicSleep < 3 and PCL-5week-8 < 31). The compliance to ED surveys (PDI, MCEPS, PCL-5ED) was higher for PCL-5week-8 ≥ 31 group (69%) compared to PCL-5week-8 < 31 group (48%), and this difference was statistically significant as determined by the Fisher exact test. The research watch models could be more useful for participants undergoing a change in clinical status since the data analysis is windowed and can provide a daily or weekly output which may be interpreted as the severity of illness. This could facilitate evaluation of response to intervention, for example. Therefore, watch-based models have potential for passive monitoring over long study periods.
We note several limitations to our study. First, the outcomes (PTSD status at week eight) may reflect the appearance of PTSD at any time over the intervening eight weeks. The high variability in the speed of development of PTSD is likely to create high class confusion in any machine learning paradigm. Moreover, there is the potential for individuals’ PTSD symptoms to wax and wane over the eight-week period, further confusing any algorithm trained on such data. Second, due to the use of self-report surveys from week eight for constructing outcome classes, our cohort is a subset of the original AURORA Freeze 2 dataset, albeit a rather large cohort. As more data are collected in the AURORA study in the coming years, we will address this limitation by re-evaluating the methods with more participants. Lastly, time zone information was not available for our participants. Circadian (mis)alignment may have provided additional information for adjusting features. While the cosinor-based rest-activity detection might compensate for this lack of information, it cannot fully address the issue.
Despite these limitations, the methods for classifying or predicting outcomes (for window sizes smaller than 49 days) could be useful in passively monitoring changes in symptom severity in large populations and in low-resource settings. Without the prior knowledge of which patients to administer treatment, smartwatch-based monitoring could be used to identify the subset of patients to prioritize. By using 56 days of data, an AUC of 0.56 for PTSD, 0.61 for PTSD-Panic Sleep/Anx., and 0.70 for PTSD-Pain. Int was achieved. Notably, the model for participants with a combined PTSD and pain outcome combined provides the highest performance. Identifying and treating these particular types of individuals is extremely important. Previous studies report that patients with both chronic pain and PTSD combined use healthcare services more than the patients with PTSD or chronic pain alone, increasing healthcare costs [5]. Moreover, PTSD treatment for these patients could be more beneficial than for other groups, since they also report a reduction in pain symptoms after treatment [46].
The cosinor method described in this work for determining the rest and activity regions could be useful for the studies in which participants cross different time zones, and in situations when obtaining sleep diary and time zone information would be highly burdensome for the participant. Addressing adherence and wearability of the device is likely to boost performance of the approach described here in the complete dataset yet to be collected (another 3000 patients). Also, additional features related to sleep may enhance the model performance. In particular, it is possible to estimate the sleep periods within the detected rest regions by adapting sleep staging algorithms from pulse and activity metrics, for the research watch used in this study and this will be implemented in our future work [47, 48].
V. Conclusion
As far as we are aware, this research represents the first attempt to predict outcomes following a traumatic event from a wearable (or more specifically, a watch). We both classified and predicted outcomes using non-invasive physiological features derived from a research quality watch, using a logistic regression model. We also developed a method to automatically detect rest and activity periods of the day using the cosinor analysis.
Acknowledgment
The funding for the study was provided by NIMH U01MH110925, the US Army Medical Research and Material Command, The One Mind Foundation, and The Mayday Fund. Verily Life Sciences and Mindstrong Health provided some of the hardware and software used to perform study assessments.
Footnotes
DISCLOSURE
In the past three years Dr. Clifford has received research support from Otsuka and unrestricted donations from AliveCor Inc. Dr. Clifford is CTO of Mindchild Medical Inc and has financial interest in the company. He is also Chief Scientific Officer of LifeBell AI Inc. and has financial interest in the company. Dr. Clifford is a consultant to AliveCor Inc and has financial interest in the company. No funding, technology owned or licensed by these companies was used in this research. Over the past three years, Dr. Pizzagalli has received consulting fees from Akili Interactive Labs, BlackThorn Therapeutics, Boehringer Ingelheim, Compass Pathway, Otsuka Pharmaceuticals, and Takeda Pharmaceuticals; one honorarium from Alkermes, and research funding from NIMH, Dana Foundation, Brain and Behavior Research Foundation, Millennium Pharmaceuticals. In addition, he has received stock options from BlackThorn Therapeutics. No funding from these entities was used to support the current work, and all views expressed are solely those of the authors. In the past three years, Dr. Kessler received support for his epidemiological studies from Sanofi Aventis; was a consultant for Datastat, Inc., Sage Pharmaceuticals, and Takeda. Dr. Jones reports no direct conflicts related to this paper, and no ongoing conflicts. Dr. Jones has been an investigator on studies funded by Roche Diagnostics, AstraZeneca, Janssen, and Hologic Inc. Dr. Sheikh has received funding from the Florida Medical Malpractice Joint Underwriter’s Association.
Contributor Information
Ayse S. Cakmak, Georgia Institute of Technology
Erick A. Perez Alday, Emory Univ. School of Medicine
Giulia Da Poian, ETH Zurich.
Ali Bahrami Rad, Emory Univ. School of Medicine.
Thomas J. Metzler, Univ. of California
Thomas C. Neylan, Univ. of California
Stacey L. House, Washington Univ. School of Medicine
Francesca L. Beaudoin, The Alpert Medical School of Brown Univ.
Xinming An, Univ. of North Carolina at Chapel Hill.
Jennifer S. Stevens, Emory Univ. School of Medicine
Donglin Zeng, Univ. of North Carolina.
Sarah D. Linnstaedt, Univ. of North Carolina at Chapel Hill
Tanja Jovanovic, Wayne State Univ..
Laura T. Germine, McLean Hospital
Kenneth A. Bollen, Univ. of North Carolina
Scott L. Rauch, McLean Hospital
Christopher A. Lewandowski, Henry Ford Health Syst.
Phyllis L. Hendry, Univ. of Florida College of Medicine-Jacksonville
Sophia Sheikh, Univ. of Florida College of Medicine-Jacksonville.
Alan B. Storrow, Vanderbilt Univ. Medical Center
Paul I. Musey, Jr., Indiana Univ. School of Medicine
John P. Haran, Univ. of Massachusetts Medical School
Christopher W. Jones, Cooper Medical School of Rowan Univ.
Brittany E. Punches, Univ. of Cincinnati College of Medicine
Robert A. Swor, Oakland Univ. William Beaumont Sch. of Medicine
Nina T. Gentile, Lewis Katz Sch. of Medicine at Temple Univ.
Meghan E. McGrath, Boston Medical Center
Mark J. Seamon, Surgical Crit. Care & Emergency Surgery, Univ. of Pennsylvania
Kamran Mohiuddin, Einstein Medical Center.
Anna M. Chang, Jefferson Univ. Hospitals
Claire Pearson, Wayne State Univ., Ascension St. John Hospital.
Robert M. Domeier, Saint Joseph Mercy Hospital
Steven E. Bruce, Univ. of Missouri - St. Louis
Brian J. O’Neil, Wayne State Univ., Ascension St. John Hospital
Niels K. Rathlev, Univ. of Massachusetts Med. Sch.-Baystate
Leon D. Sanchez, Beth Israel Deaconess Medical Center
Robert H. Pietrzak, Yale School of Medicine
Jutta Joormann, Yale Univ..
Deanna M. Barch, College of Arts a Sci.s, Washington Univ. in St. Louis
Diego A. Pizzagalli, Harvard Medical School
Steven E. Harte, Univ. of Michigan Medical School
James M. Elliott, Northwestern Univ.
Ronald C. Kessler, Harvard Medical School
Karestan C. Koenen, Harvard Medical School
Kerry J. Ressler, Harvard T. H. Chan School of Public Health
Samuel A. Mclean, Univ. of North Carolina at Chapel Hill
Qiao Li, Emory Univ. School of Medicine.
Gari D. Clifford, Emory Univ. School of Medicine
References
- 1.Bisson IJ, “Post-traumatic stress disorder,” BMJ, vol. 334, no. 7597, pp. 789–793, 2007. [DOI] [PMC free article] [PubMed] [Google Scholar]
- 2.American Psychiatric Association and others, Diagnostic and statistical manual of mental disorders DSM-5, American Psychiatric Pub, 2013. [Google Scholar]
- 3.Richards A, Kanady JC and Neylan TC, “Sleep disturbance in PTSD and other anxiety-related disorders: an updated review of clinical features, physiological characteristics, and psychological and neurobiological mechanisms,” Neuropsychopharmacology, vol. 45, no. 1, pp. 55–73, 2020. [DOI] [PMC free article] [PubMed] [Google Scholar]
- 4.Sharp TJ and Harvey AG, “Chronic pain and posttraumatic stress disorder: mutual maintenance?,” Clinical Psychology Review, vol. 21, no. 6, pp. 857–877, 2001. [DOI] [PubMed] [Google Scholar]
- 5.Fishbain DA, Pulikal A, Lewis JE and Gao J, “Chronic pain types differ in their reported prevalence of post-traumatic stress disorder (PTSD) and there is consistent evidence that chronic pain is associated with PTSD: an evidence-based structured systematic review,” Pain Medicine, vol. 18, no. 4, pp. 711–735, 2017. [DOI] [PubMed] [Google Scholar]
- 6.Kilpatrick DG, Resnick HS, Milanak ME, Miller MW, Keyes KM and Friedman MJ, “National estimates of exposure to traumatic events and PTSD prevalence using DSM-IV and DSM-5 criteria,” Journal of Traumatic Stress, vol. 26, no. 5, pp. 537–547, 2013. [DOI] [PMC free article] [PubMed] [Google Scholar]
- 7.Andrews B , Brewin CR, Philpott R and Stewart L, “Delayed-onset posttraumatic stress disorder: a systematic review of the evidence,” American Journal of Psychiatry, vol. 164, no. 9, pp. 1319–1326, 2007. [DOI] [PubMed] [Google Scholar]
- 8.Kearns MC, Ressler KJ, Zatzick D and Rothbaum BO, “Early interventions for PTSD: a review,” Depression and Anxiety, vol. 29, no. 10, pp. 833–842, 2012. [DOI] [PMC free article] [PubMed] [Google Scholar]
- 9.Rothbaum BO, Kearns MC, Price M, Malcoun E, Davis M, Ressler KJ, Lang D and Houry D, “Early intervention may prevent the development of posttraumatic stress disorder: a randomized pilot civilian study with modified prolonged exposure,” Biological Psychiatry, vol. 72, no. 11, pp. 957–963, 2012. [DOI] [PMC free article] [PubMed] [Google Scholar]
- 10.Ozer EJ, Best SR, Lipsey TL and Weiss DS, “Predictors of posttraumatic stress disorder and symptoms in adults: a meta-analysis.,” Psychological Bulletin, vol. 129, no. 1, p. 52, 2003. [DOI] [PubMed] [Google Scholar]
- 11.National Collaborating Centre for Mental Health (UK and others), “Predictors of PTSD and screening for the disorder,” in Post-Traumatic Stress Disorder: The Management of PTSD in Adults and Children in Primary and Secondary Care, Gaskell, 2005. [PubMed] [Google Scholar]
- 12.Brewin CR, Andrews B and Valentine JD, “Meta-analysis of risk factors for posttraumatic stress disorder in trauma-exposed adults.,” Journal of Consulting and Clinical Psychology, vol. 68, no. 5, p. 748, 2000. [DOI] [PubMed] [Google Scholar]
- 13.Schultebraucks K, Shalev AY, Michopoulos V, Grudzen CR, Shin S-M, Stevens JS, Maples-Keller JL, Jovanovic T, Bonnano GA and Rothbaum BO, “A validated predictive algorithm of post-traumatic stress course following emergency department admission after a traumatic stressor,” Nature Medicine, vol. 26, no. 7, pp. 1084–1088, 2020. [DOI] [PubMed] [Google Scholar]
- 14.Schultebraucks K, Yadav V, Shalev AY, Bonnano GA and Galatzer-Levy IR, “Deep learning-based classification of posttraumatic stress disorder and depression following trauma utilizing visual and auditory markers of arousal and mood,” Psychological Medicine, pp. 1–11, 2020. [DOI] [PubMed] [Google Scholar]
- 15.Reinertsen E and Clifford GD, “A review of physiological and behavioral monitoring with digital sensors for neuropsychiatric illnesses,” Physiological Measurement, vol. 39, no. 5, 2018. [DOI] [PMC free article] [PubMed] [Google Scholar]
- 16.Valenza G, Nardelli M, Lanata A, Gentili C, Bertschy G, Paradiso R and Scilingo EP, “Wearable monitoring for mood recognition in bipolar disorder based on history-dependent long-term heart rate variability analysis,” IEEE Journal of Biomedical and Health Informatics, vol. 18, no. 5, pp. 1625–1635, 2013. [DOI] [PubMed] [Google Scholar]
- 17.Carney RM, Freedland KE, Stein PK, Miller GE, Steinmeyer B, Rich ME and Duntley SP, “Heart rate variability and markers of inflammation and coagulation in depressed patients with coronary heart disease,” Journal of Psychosomatic Research, vol. 62, no. 4, pp. 463–467, 2007. [DOI] [PMC free article] [PubMed] [Google Scholar]
- 18.Dekker JM, Crow RS, Folsom AR, Hannan PJ, Liao D, Swenne CA and Schouten EG, “Low heart rate variability in a 2-minute rhythm strip predicts risk of coronary heart disease and mortality from several causes: the ARIC Study,” Circulation, vol. 102, no. 11, pp. 1239–1244, 2000. [DOI] [PubMed] [Google Scholar]
- 19.Mellman TA, Knorr BR, Pigeon WR, Leiter J and Akay M, “Heart rate variability during sleep and the early development of posttraumatic stress disorder,” Biological Psychiatry, vol. 55, no. 9, pp. 953–956, 2004. [DOI] [PubMed] [Google Scholar]
- 20.van Boxtel GJ, Cluitmans PJ, Raymann RJ, Ouwerkerk M, Denissen AJ, Dekker MK and Sitskoorn MM, “Heart rate variability, sleep, and the early detection of post-traumatic stress disorder,” in Sleep and Combat-Related Post Traumatic Stress Disorder, Springer, 2018, pp. 253–263. [Google Scholar]
- 21.Reinertsen E, Nemati S, Vest AN, Vaccarino V, Lampert R, Shah AJ and Clifford GD, “Heart rate-based window segmentation improves accuracy of classifying posttraumatic stress disorder using heart rate variability measures,” Physiological Measurement, vol. 38, no. 6, p. 1061, 2017. [DOI] [PMC free article] [PubMed] [Google Scholar]
- 22.Ancoli-Israel S, Cole R, Alessi C, Chambers M, Moorcroft W and Pollak CP, “The role of actigraphy in the study of sleep and circadian rhythms,” SLEEP, vol. 26, no. 3, pp. 342–392, 2003. [DOI] [PubMed] [Google Scholar]
- 23.Inman DJ, Silver SM and Doghramji K, “Sleep disturbance in post-traumatic stress disorder: a comparison with non-PTSD insomnia,” Journal of Traumatic Stress, vol. 3, no. 3, pp. 429–437, 1990. [Google Scholar]
- 24.Khajawa IS, Westermeyer JJ and Hurwitz TD, “Actigraphy and PTSD,” in Sleep and Combat-Related Post Traumatic Stress Disorder, Springer, 2018, pp. 209–213. [Google Scholar]
- 25.Cornelissen G, “Cosinor-based rhythmometry,” Theoretical Biology and Medical Modelling, vol. 11, no. 1, p. 16, 2014. [DOI] [PMC free article] [PubMed] [Google Scholar]
- 26.McLean SA, Ressler K, Koenen KC, Neylan T, Germine L, Jovanovic T, Clifford GD, Zeng D, An X, Linnstaedt S and and others, “The AURORA Study: a longitudinal, multimodal library of brain biology and function after traumatic stress exposure,” Molecular Psychiatry, pp. 1–14, 2019. [DOI] [PMC free article] [PubMed] [Google Scholar]
- 27.Michaels A, Michaels C, Moon C, Zimmerman MA, Peterson C and Rodriguez JL, “Psychosocial factors limit outcomes after trauma,” Journal of Trauma and Acute Care Surgery, vol. 44, no. 4, pp. 644–648, 1998. [DOI] [PubMed] [Google Scholar]
- 28.Brunet A, Weiss DS, Metzler TJ, Best SR, Neylan TC, Rogers C, Fagan J and Marmar CR, “The Peritraumatic Distress Inventory: a proposed measure of PTSD criterion A2,” American Journal of Psychiatry, vol. 158, no. 9, pp. 1480–1485, 2001. [DOI] [PubMed] [Google Scholar]
- 29.Bovin MJ, Marx BP, Weathers FW, Gallagher MW, Rodriguez P, Schnurr PP and Keane TM, “Psychometric properties of the PTSD checklist for diagnostic and statistical manual of mental disorders--fifth edition (PCL-5) in veterans.,” Psychological Assessment, vol. 28, no. 11, p. 1379, 2016. [DOI] [PubMed] [Google Scholar]
- 30.Weathers FW, Litz BT, Keana TM, Palmieri PA, Marx BP and Schnurr PP, “The PTSD checklist for DSM-5 (PCL-5),” Scale available from the National Center for PTSD at www.ptsd.va.gov, vol. 10, p. 2013. [Google Scholar]
- 31.Germain A, Hall M, Krakow B, Shear KM and Buysse DJ, “A brief sleep scale for posttraumatic stress disorder: Pittsburgh Sleep Quality Index Addendum for PTSD,” Journal of Anxiety Disorders, vol. 19, no. 2, pp. 233–244, 2005. [DOI] [PubMed] [Google Scholar]
- 32.Insana SP, Hall M, Buysse DJ and Germain A, “Validation of the Pittsburgh Sleep Quality Index Addendum for Posttraumatic Stress Disorder (PSQI-A) in US Male Military Veterans,” Journal of Traumatic Stress, vol. 26, no. 2, pp. 192–200, 2013. [DOI] [PMC free article] [PubMed] [Google Scholar]
- 33.Teresi AJ, Ocepek-Welikson K, Cook KF, Kleinman M, Ramirez M, Reid MC and Siu A, “Measurement equivalence of the Patient Reported Outcomes Measurement Information System (PROMIS) Pain Interference Short Form items: Application to ethnically diverse cancer and palliative care populations,” Psychological Test and Assessment Modeling, vol. 58, no. 2, p. 309, 2016. [PMC free article] [PubMed] [Google Scholar]
- 34.Vest AN, Da Poian G, Li Q, Liu C, Nemati S, Shah AJ and Clifford GD, “An open source benchmarked toolbox for cardiovascular waveform and interval analysis,” Physiological Measurement, vol. 39, no. 10, p. 105004, 2018. [DOI] [PMC free article] [PubMed] [Google Scholar]
- 35.Vest AN, Poian GD, Li Q, Liu C, Nemati S, Shah AJ and Clifford GD, PhysioNet Cardiovascular Signal Toolbox, 10.5281/zenodo.1243111, 2018. [DOI] [Google Scholar]
- 36.Li Q and Clifford GD, “Dynamic time warping and machine learning for signal quality assessment of pulsatile signals,” Physiological Measurement, vol. 33, no. 9, p. 1491, 2012. [DOI] [PubMed] [Google Scholar]
- 37.Akselrod S, Gordon D, Ubel AF, Shannon DC, Berger A and Cohen RJ, “Power spectrum analysis of heart rate fluctuation: a quantitative probe of beat-to-beat cardiovascular control,” Science, vol. 213, no. 4504, pp. 220–22, 1981. [DOI] [PubMed] [Google Scholar]
- 38.Cakmak AS, Suresha PB and Clifford GD, Open Source Actigraphy Toolbox, 10.5281/zenodo.4287769, 2020. [DOI] [Google Scholar]
- 39.Borazio M, Berlin E, Kucukyildiz N, Scholl P and Van Laerhoven K, “Towards benchmarked sleep detection with wrist-worn sensing units,” in IEEE International Conference on Healthcare Informatics, 2014. [Google Scholar]
- 40.Virkkala J, “Using accelerometers as actographs,” Journal of Sleep Research, vol. 21, no. 1, pp. 198–199, 2012. [Google Scholar]
- 41.Van Someren EJ, Swaab DF, Colenda CC, Cohen W, McCall WV and Rosenquist PB, “Bright light therapy: improved sensitivity to its effects on rest-activity rhythms in Alzheimer patients by application of nonparametric methods,” Chronobiology International, vol. 16, no. 4, pp. 505–518, 1999. [DOI] [PubMed] [Google Scholar]
- 42.Pedregosa F, Varoquaux G, Gramfort A, Michel V, Thirion B, Grisel O, Blondel M, Prettenhofer P, Weiss R, Dubourg V, Vanderplas J, Passos A, Cornapeau D, Brucher M, Perrot M and Duchesnay E, “Scikit-learn: Machine Learning in Python,” Journal of Machine Learning Research, vol. 12, pp. 2825–2830, 2011. [Google Scholar]
- 43.Dennis PA, Watkins L, Calhoun PS, Oddone A, Sherwood A, Dennis MF, Rissling MB and Beckham JC, “osttraumatic stress, heart-rate variability, and the mediating role of behavioral health risks,” Psychosomatic Medicine, vol. 76, no. 8, p. 629, 2014. [DOI] [PMC free article] [PubMed] [Google Scholar]
- 44.McDuff D, Gontarek S and Picard R, “Remote measurement of cognitive stress via heart rate variability,” in 36th Annual International Conference of the IEEE Engineering in Medicine and Biology Society, 2014. [DOI] [PubMed] [Google Scholar]
- 45.Hernando A, Lazaro J, Gil E, Arza A, Garzon JM, Lopez-Anton R, de la Camara C, Laguna P, Aguilo J and Bailon R, “Inclusion of respiratory frequency information in heart rate variability analysis for stress assessment,” IEEE Journal of Biomedical and Health Informatics, vol. 20, no. 4, pp. 1016–1025, 2016. [DOI] [PubMed] [Google Scholar]
- 46.Shipherd JC, Keyes M, Jovanovic T, Ready DJ, Baltzell D, Worley V, Gordon-Brown V, Hayslett C and Duncan E, “Veterans seeking treatment for posttraumatic stress disorder: What about comorbid chronic pain?,” Journal of Rehabilitation Research & Development, vol. 44, no. 2, 2007. [DOI] [PubMed] [Google Scholar]
- 47.Li Q, Qichen L, Liu C, Shashikumar SP, Nemati S and Clifford GD, “Deep learning in the cross-time frequency domain for sleep staging from a single-lead electrocardiogram,” Physiological Measurement, vol. 39, no. 12, p. 124005, 2018. [DOI] [PMC free article] [PubMed] [Google Scholar]
- 48.Cakmak AS, Da Poian G, Willats A, Haffar A, Abdulbaki R, Ko Y-A, Shah AJ, Vaccarino V, Bliwise DJ, Rozell C and Clifford GD, “An unbiased, efficient sleep--wake detection algorithm for a population with sleep disorders: change point decoder,” SLEEP, 2020. [DOI] [PMC free article] [PubMed] [Google Scholar]