Abstract
We regularly touch soft, compliant fruits and tissues. To help us discriminate them, we rely upon cues embedded in spatial and temporal deformation of finger pad skin. However, we do not yet understand, in touching objects of various compliance, how such patterns evolve over time, and drive perception. Using a 3-D stereo imaging technique in passive touch, we develop metrics for quantifying skin deformation, across compliance, displacement, and time. The metrics map 2-D estimates of terminal contact area to 3-D metrics that represent spatial and temporal changes in penetration depth, surface curvature, and force. To do this, clouds of thousands of 3-D points are reduced in dimensionality into stacks of ellipses, to be more readily comparable between participants and trials. To evaluate the robustness of the derived 3-D metrics, human subjects experiments are performed with stimulus pairs varying in compliance and discriminability. The results indicate that metrics such as penetration depth and surface curvature can distinguish compliances earlier, at less displacement. Observed also are distinct modes of skin deformation, for contact with stiffer objects, versus softer objects that approach the skin’s compliance. These observations of the skin’s deformation may guide the design and control of haptic actuation.
I. INTRODUCTION
Of the various dimensions that underlie our sense of touch – e.g., roughness, stickiness, and spatial curvature – compliance is particularly important in our daily lives [1]. We routinely inspect the ripeness of fruit [2] as well as physically interact with other people in conveying social expressions [3]. In judging an object’s compliance, we rely upon both cutaneous and proprioceptive cues [4], [5]. Recent work suggests that force-related cues facilitate compliance discrimination [6]. Force-rate cues, in particular, have been shown to be very efficient in reducing object deformation necessary to discriminate compliances [7] and in illusion cases whereby radius of curvature and compliance are co-varied [8], [9].
The utility of particular cues may be tied to the magnitude of compliance of the stimulus. For example, in prior work, Srinivasan and LaMotte noted that compliances near the modulus of skin tissue or less may be perceived differently than those stiffer [5]. Likewise, subsequent work shows that force-related cues are optimal for the range stiffer (~160 kPa), but not softer (~30 kPa) [7]. In interacting with softer materials, the cutaneous cues – in particular the pattern of deformation of the skin’s surface, as well as the propagation of stresses and strains through the skin to mechanosensitive afferents – are thought to be particularly vital. However, both the surface of the skin in contact with a stimulus, as well as its interior layers, are difficult to directly observe.
To identify cues that evoke a percept of compliance, we need to understand how the skin’s surface deforms in space and time, while in contact with an object. Along these lines, one prior effort used an ink-based technique to measure contact area [10], though it only yields a terminal measure and is not able to account for the skin’s viscoelasticity. As well, high-resolution visual imaging has been applied to the case of flat plates and very stiff compliances (~2 MPa) [11]. For more compliant materials, others have visually tracked embedded beads to back out surface deflections [12], [13]. To directly observe the skin’s surface while in contact with a compliant substrate, our group recently developed a 3-D stereo imaging technique that can visualize the deformation of the skin’s surface as flat, compliant, and transparent substrates are indented into the finger pad [14]. This technique generates 3-D point clouds at about 60–120 micron resolution, and can visualize the skin’s temporal dynamics over the evolving course of a displacement.
The present work seeks to use this stereo imaging technique to take 3-D point cloud data that represent skin deformation and build higher-level metrics. At present, there is a gap between the cues and metrics of the psychophysical literature, based on 2-D, terminal contact area, and the ability of 3-D imaging to interpret cues in the deformation of the skin’s surface. Thereby, this effort transitions the analysis of contact with compliant surfaces from 2-D to 3-D, and considers how such cues progressively develop over time. One focus is upon skin deformation patterns evoked in interacting with compliances near the modulus of skin tissue versus stiffer.
II. Methods
Herein, we develop new metrics to quantify the patterns of deformation of the skin’s surface as evoked across a range of stimulus compliances, displacement, and time scales. Low-level, point cloud data is mapped onto new high-level metrics tied to the penetration depth, surface curvature, and force at stimulus-finger pad contact. These metrics reflect changes in both the 3-D depth and curvature of the skin’s spatial extent, as well as how it develops progressively over time. To do so, we developed a method for fitting ellipses to discrete image planes within the point cloud data. Then, in a series of human subjects experiments, a range of stimulus compliances (45 – 184 kPa) are employed, which vary in pairwise discriminability, with rates from 50–100%. In this context, the new metrics are compared in effort to determine which might most significantly aid in the discrimination of particular combinations of compliant substrates, considering both discriminability and compliance absolute magnitude.
A. Experimental Apparatus and Stimuli
A custom-built, stereo imaging device is used to obtain 3-D point cloud data for contact of the finger pad with compliant stimuli, explained in depth elsewhere [14]. Briefly, it includes a load cell, a cantilever of a vertically moving indenter, a 3-D printed housing upon which five stimuli can be mounted and rotated in and out of position for vertical displacement, and two cameras for direct stereo visualization with the finger pad beneath, Figure 1A.
Figure 1. Procedure to obtain 3-D point cloud data representing the deformed surface of the finger pad.

A) Left camera image from stereo pair of an example participant’s finger pad beneath a 121 kPa stimulus at 5 mm displacement. B) raw data of the 3-D point cloud, C) selection of the finger pad outline at the surface image plane, and masking of peripheral noise in the image. D) 3-D point cloud of finger pad contact with the stimulus, post-masking.
For the work herein, five stimuli were freshly constructed and poured into custom-built aluminum rings, 60 mm diameter by 15 mm tall, with flat glass plates at the surface opposite the finger pad. Compared to those previously reported that were cured under room temperature in plastic petri-dishes, this approach improves their visual transparency. To fill them, silicone-elastomer (Sylgard 184, Dow Corning, Midland, MI, USA) was mixed with various ratios of silicone oil (ALPA-OIL-50, Silicone oil V50, Modulor, Berlin, Germany) and pressurized at controlled times and temperatures until fully cured. The control of these factors yields a range of unique moduli. The substrates then sat at room temperature for at least 24 hours. Additional samples per unique silicone-elastomer batch were poured to measure elastic modulus [15]. This process resulted in five substrates with moduli of 45, 54, 75, 121, and 184 kPa.
B. Participants
The human subjects studies were approved by the Institutional Review Board at the University of Virginia. Five participants were included in the psychophysical and biomechanical experiments (mean age = 22, SD = 0.67, 3 male, 2 female). Informed consent was obtained, and all participants fully completed the planned experiments. The two experiments were run on the same day with durations of about 45 min and 30 min, respectively, with a break between. The cognitive nature of the experiments was complete within the first 45 minutes, the latter 30 minutes required less effort.
C. Psychophysical Evaluation of Stimulus Discriminability
To determine if the stimuli covered a sufficient range of discriminability, they were evaluated psychophysically in a pairwise fashion. The method of constant stimuli was used, in randomized order. The seven paired sets evaluated (units kPa) were 184/75, 184/121, 121/75, 121/54, 75/54, 75/45, and 54/45. Other pairs deemed readily discriminable, e.g., 184/45, and were omitted to fit a reasonable experimental duration.
The experimental procedure was to indent, via displacement control, each stimulus into the participant’s index finger at a velocity of 1 mm/s to 5 mm displacement, to be retracted with a symmetric ramp. Thereafter, a second stimulus was presented likewise. Participants were blindfolded to eliminate visual cues. Participants were asked to report the more compliant of the two stimuli. Each of the five participants completed a total of 49 trials, 7 trials per pairwise set, which consisted of 5 trials of different stimuli and two trials of the same stimulus presented twice.
The findings are shown in Figure 2. The rate of discriminability spans a range from about 50% (chance) to 100%. The error bar shows the standard deviation. The detection rate was low for the stimuli with smaller compliance differences and low modulus magnitude, 60% for both 75/45 and 75/54 kPa pairs, and near 50% for 54/45 kPa. Based upon the findings, three compliance pairs, 184/75 kPa, 184/121 kPa, and 75/45 kPa, became the focus of subsequent biomechanical analysis. These stimulus comparisons, respectively, spanned a large range of compliance and were readily discriminable, were detectable at about 85% and less compliant, and were not readily detectable at about 60% and of the lowest modulus, nearing that of finger pad skin.
Figure 2. Results of psychophysical evaluation of pairwise comparisons of stimulus compliances.
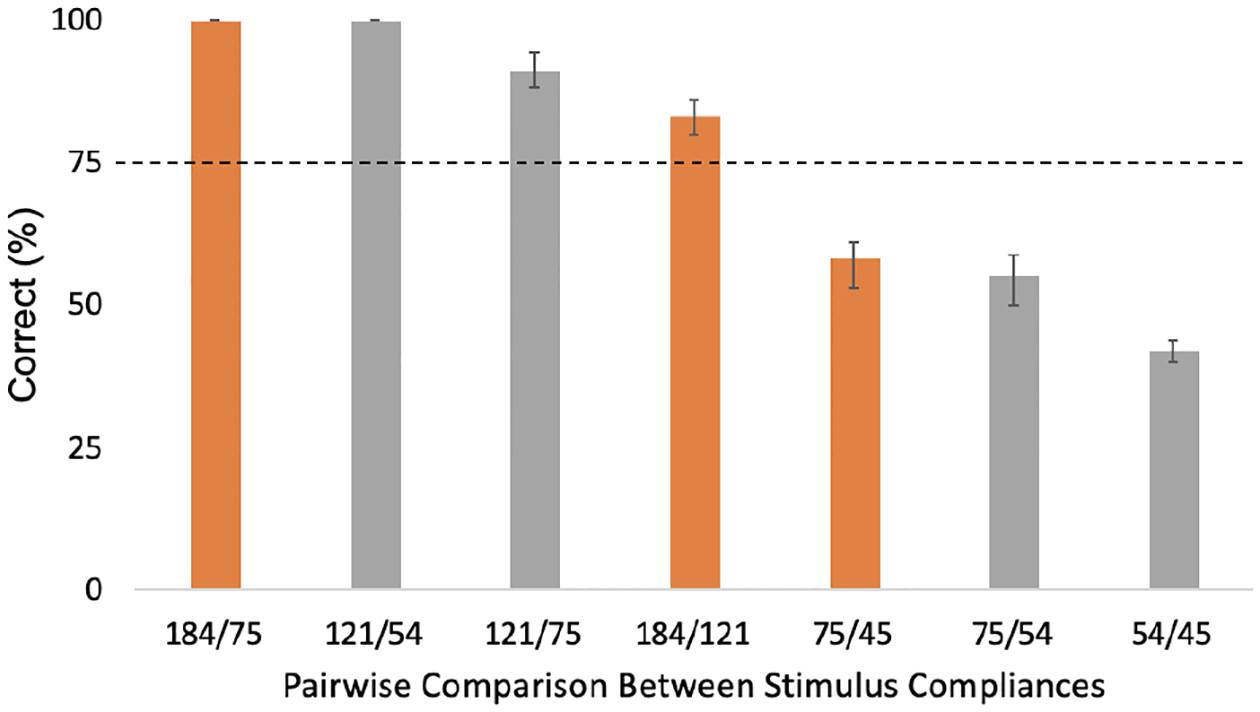
For example, the 184 and 75 kPa stimuli were compared. Data set includes five subjects with five repetitions per compliance pair, for 175 total trials. Three colored bars represent comparisons of focus in subsequent biomechanical analysis.
C. 3-D surface reconstruction and image processing
Using a disparity-mapping approach, previously defined [14], to obtain point cloud data representing the surface deformation of finger pad, Figure 1B, we further cleaned noise from the data. Briefly, the point cloud data are generated by co-locating ink points on the skin surface captured by left and right cameras (MATLAB Computer Vision Toolbox). The identified pixel brightness values between left and right images are the 3-D coordinates of each point in the point cloud. Since we are only interested in the area that the skin and the stimulus making contact, we extract this area by masking the remaining areas below the surface contact plane, Figure 1C, yielding a clearer data, Figure 1D.
D. Ellipse Method and Image Planes
To characterize how the 3-D point cloud changes over the course of a displacement, we developed a method to fit stacked ellipses to discrete, vertically oriented image planes. The point clouds represent about 80,000 points and it is difficult to compare one person or stimulus to another with such a complicated surface. Another benefit is to eliminate noise due in a few cases to points not being correctly matched, or the stimulus surface smudged, etc. In this way, the ellipse fit helps both dimensionality reduction and data denoising. Likewise, others have used ellipse fitting in 2-D to compare finger pad contact with flat plates [16].
With the procedure, a point cloud is divided into image planes at increments of 0.25 mm, starting from the plane representing surface contact to the deepest penetration. The selected increment of 0.25 mm is conservative at twice the resolution of the stereo images in the vertical dimension of 0.12 mm [14]. One ellipse is fit per image plane, by including all points from the point cloud above that vertical point in space. For example, in Figure 3A, the ellipse at the 6th image plane was formed from all points above −90 mm displacement, while the 3rd image plane was formed from all points above −89.25 mm displacement. All ellipses in a stack are oriented with their major axis in the same horizontal direction. With this fitting approach [17], each ellipse contains 98% of points per image plane with 95% confidence.
Figure 3. Comparison of finger pad deformation between two compliant substrates, each indented to 5 mm depth.
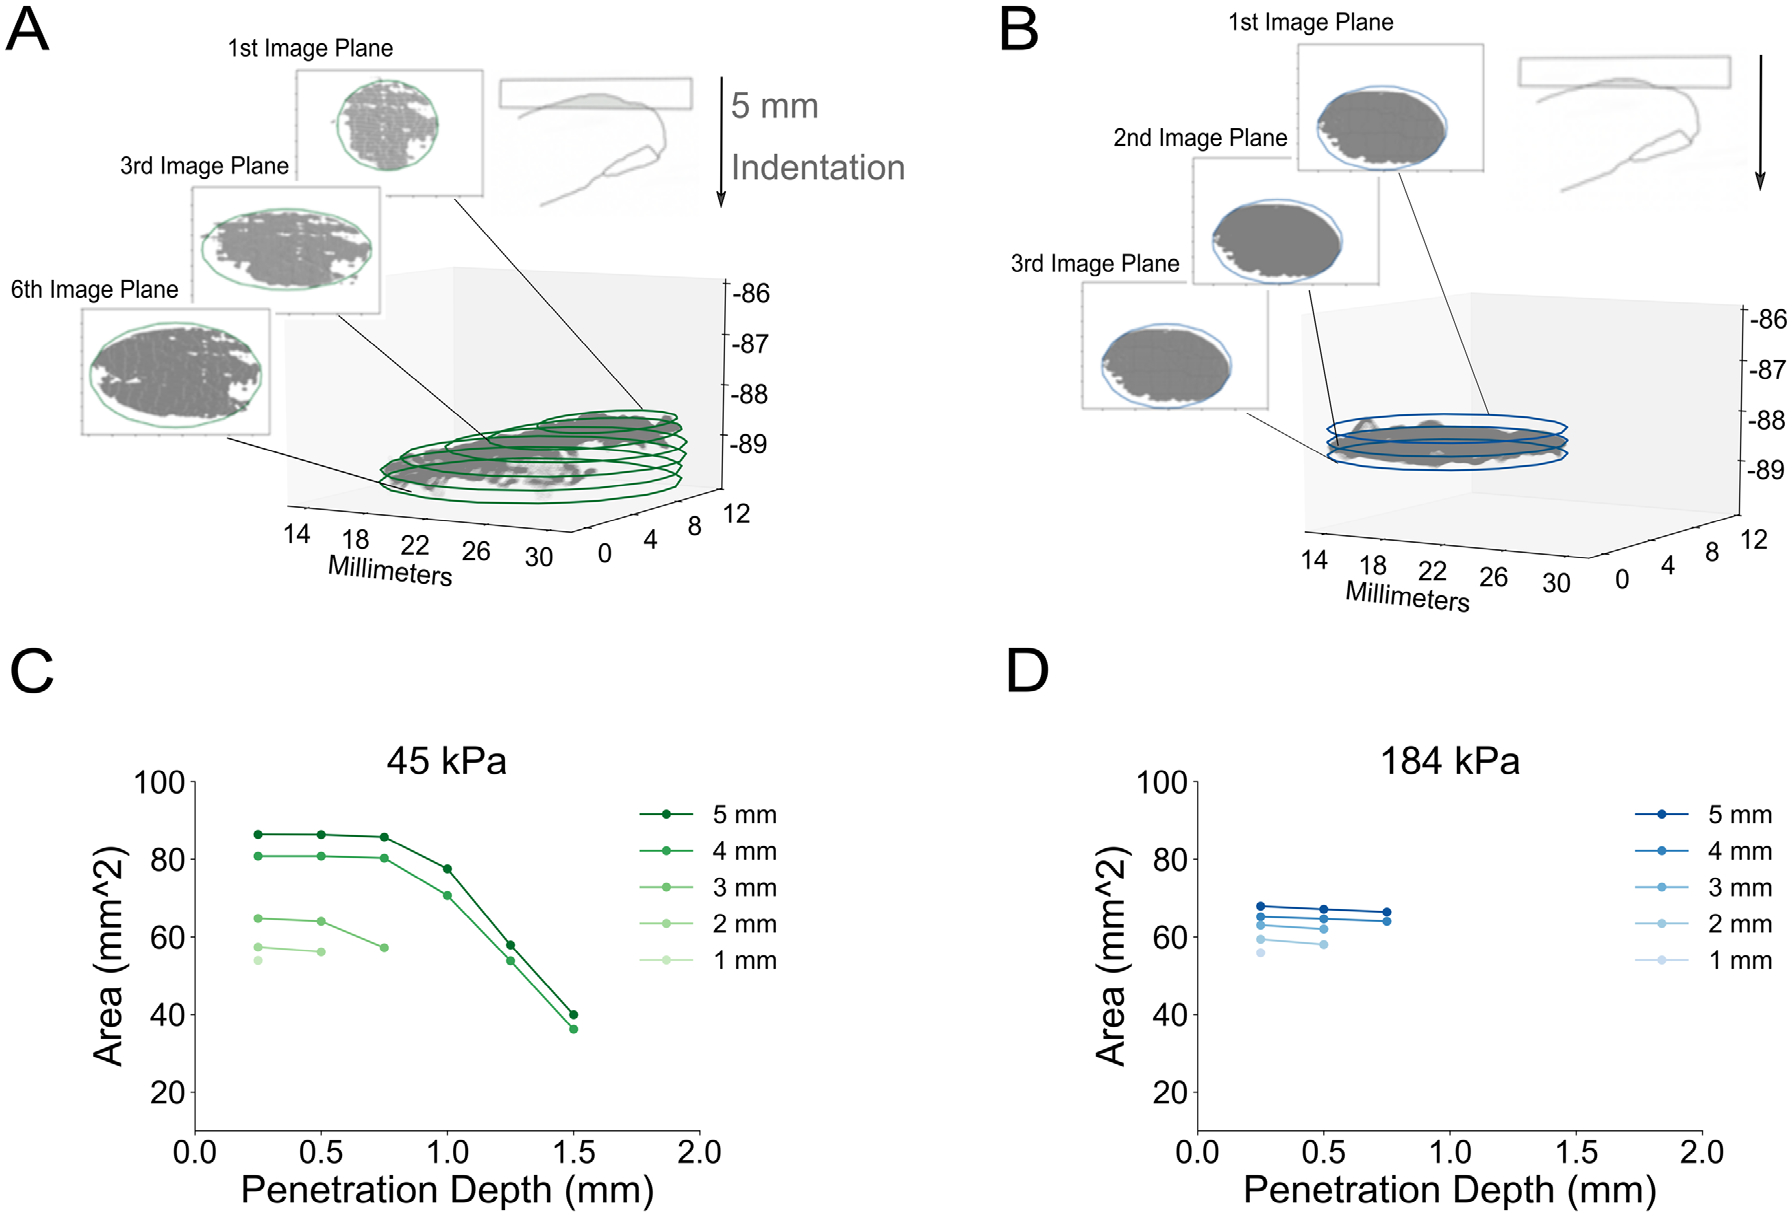
A) 3-D point cloud of an example participant’s finger pad indented by the 45 kPa stimulus to a terminal depth of 5 mm. Overlaid are 6 ellipses fitted to this point cloud at imaging planes of 0.25 mm increments. B) Similarly, 3 ellipses are fitted for the case of a stiffer substrate, a 184 kPa stimulus indented to 5 mm. C) For the 5 mm line, the area of each of the 6 image planes from A) are plotted against the penetration depth of the finger pad into the substrate’s surface, depicting their relationship for the 45 kPa stimulus. Shown as well are the relationships imaged at intermediate points from 1 to 4 mm into the displacement, which terminates at 5 mm. D) As in C, the area versus the penetration depth relationship is shown for the 184 kPa stimulus. For the more compliant 45 kPa stimulus, we observe greater penetration depth and area change over the course of the displacement, as compared to the less compliant 184 kPa stimulus.
E. Dependent Metrics
Several dependent metrics were defined to characterize the deformation of the skin’s surface, described from a spatial standpoint. We also consider their temporal change rates, or how they vary from 0 to 1 second, 1 to 2 s, etc. over the course of 5 mm displacement which lasts 5 s duration.
Penetration Depth is calculated in terms of the number of discrete image planes. Since the ellipse fitting method approximates the point cloud and the distance between ellipses is constant (0.25 mm), the penetration depth (P), in units mm, is calculated as follows, where N is number of image planes. The reference is the surface contact plane.
Average Curvature is estimated by the slope between two adjacent ellipses using their radius and the distance between them, with the resultant discrete slope values averaged across all ellipses for that point cloud, as follows, where r is the radius and i is the image plane. The radius represents the major axis of the ellipse, where as noted in Methods D, all ellipses are oriented in the same direction.
The average slope approximates the 3-D curvature change of the point cloud. To gauge its accuracy, we superimposed the image planes obtained by the ellipse fitting method onto cross-sectional contour lines of the corresponding point cloud of an example participant, Figure 4. Shown are three selected compliance pairs at 1 mm and 2 mm into a 5 mm displacement. At 1 mm displacement the penetration depth and curvature differences are small when the compliance difference between two stimuli is small, and increase with displacement.
Figure 4. A cross-sectional contour representing an example participant’s deformed skin surface is overlaid with points of intersection obtained separately via the ellipse method fitted to the 3-D point cloud.
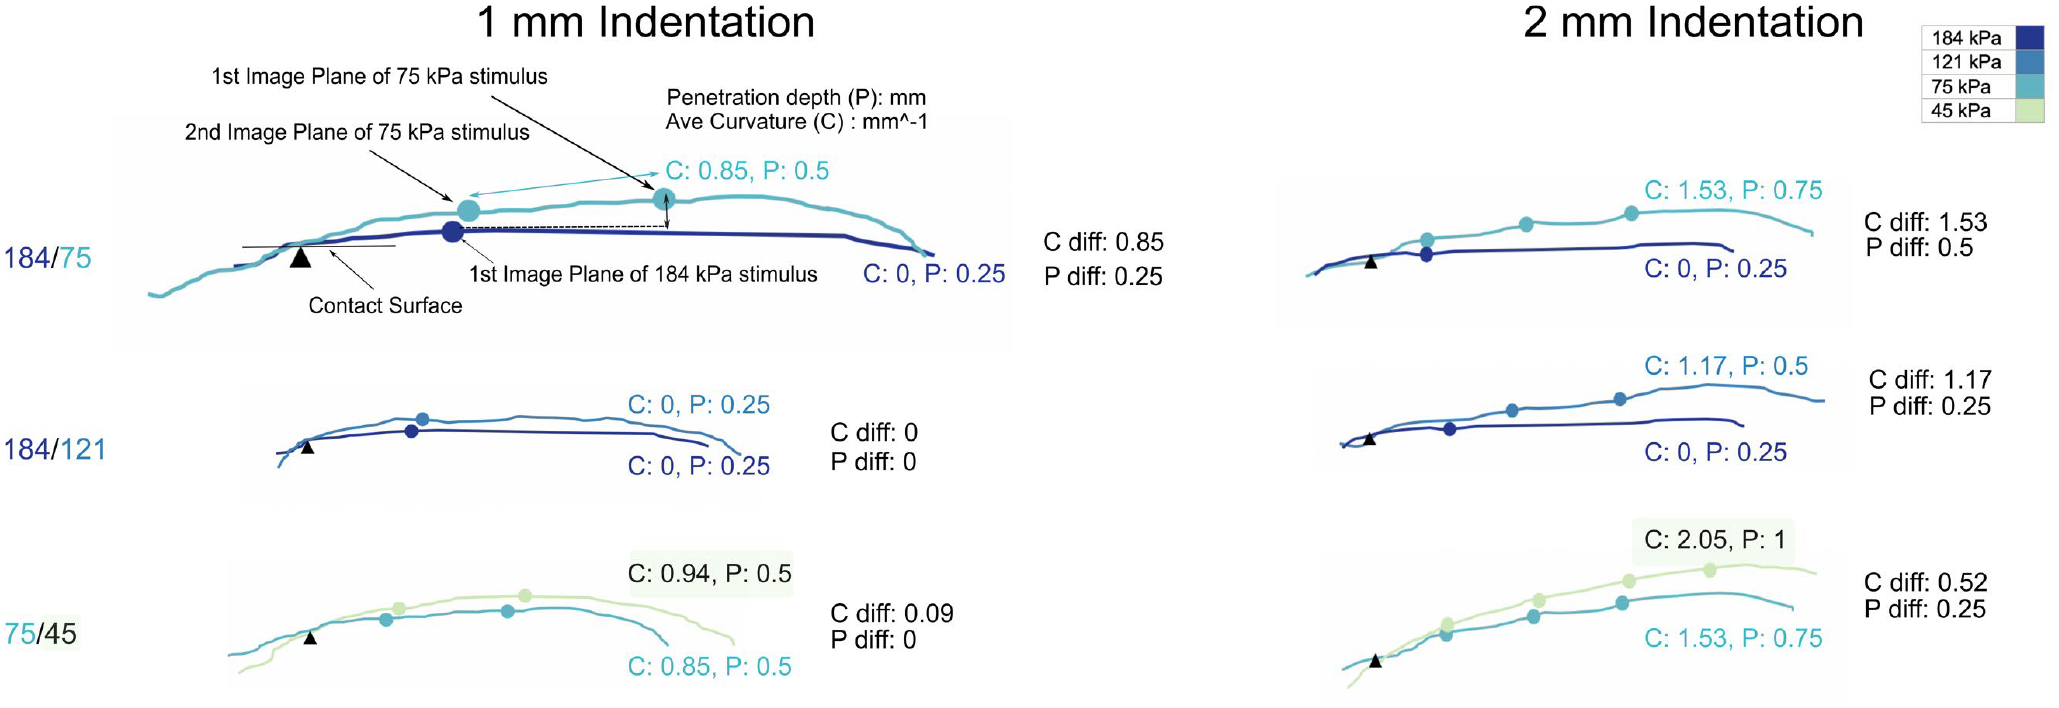
Cross-sectional contours of the deformed skin surface are combined with image planes at points both 1 mm and 2 mm into the 5 mm displacement for three different pairs of compliances. Dots on each contour line represent corresponding image planes at that cross-sectional position. The rightmost dot is the first image plane in all subplots, representing the image plane at the deepest penetration depth. For each stimulus is shown its maximum penetration depth (P) and average curvature (C). The difference between these metrics, for stimulus pairs, are shown as P diff and C diff. For stimuli readily differentiable, e.g., 184 and 75 kPa, P diff and C diff values are distinct almost immediately into the displacement at 1 mm, and become more distinct with greater displacement.
Maximum Area Change and Contact Area represent two additional metrics, with the latter tied historically to the terminal 2-D plane. Here, the former represents the largest difference in area between two sequential (adjacent) image planes, divided by the distance between two image planes. The latter, contact area, represents the last formed ellipse, at the surface contact plane. This is always the largest ellipse. As observable in Figure 3C, as compared to Figure 3D, a substrate’s compliance impacts how the skin flattens against its surface.
G. Experimental Procedure for Biomechanics Experiments
A second set of human subjects experiments to extract the biomechanical interaction of the stimulus and skin was conducted, on the same day as the psychophysical experiment, as noted, after a short break. These experiments sought to capture only the deformation of the skin’s surface. As with the psychophysical experiments, the hand and index finger were stabilized on a steel panel that included a plastic armrest and another index finger rest, together angled at ~30 degrees with respect to the stimulus plane of displacement. An elastic band was positioned, not overly tight, at the second digit of the finger. The index finger pad was covered in colored ink dots using paintbrushes in order to increase the efficacy of point co-location. Light purple ink (Hampton Art Pigment Ink Pads) was used, as it is captured by the cameras better than blue ink, used previously. Before each trial with a new stimulus, participants were asked to adjust their finger to make sure the pad was at the center of the stimulus, as aided by the experimenter. Also, the participant was asked if the stimulus was in slight contact before displacement, based on self-report. The force on the load cell was simultaneously checked to ensure it was at zero. This was done to ensure very subtle contact, and also to ensure participants were not pushing up into the stimulus.
This experiment itself was done by displacement control, indenting the stimulus in a ramp to 5 mm into the finger pad at the velocity of 1 mm/s, before symmetric retraction. Displacement and force were recorded simultaneously. A total of 125 indentations were conducted, with five stimuli, five replications, and five participants.
III. Results
Using the defined spatial and temporal metrics, the biomechanical data for the all human subjects, per compliant surface, are shown in Figures 5A–E and 6A–E. Note that the stimulus displacement was always 5 mm, and each x-axis label shows the displacement step toward that terminal position.
Figure 5. Comparison of five spatial biomechanical metrics between five compliant substrates.
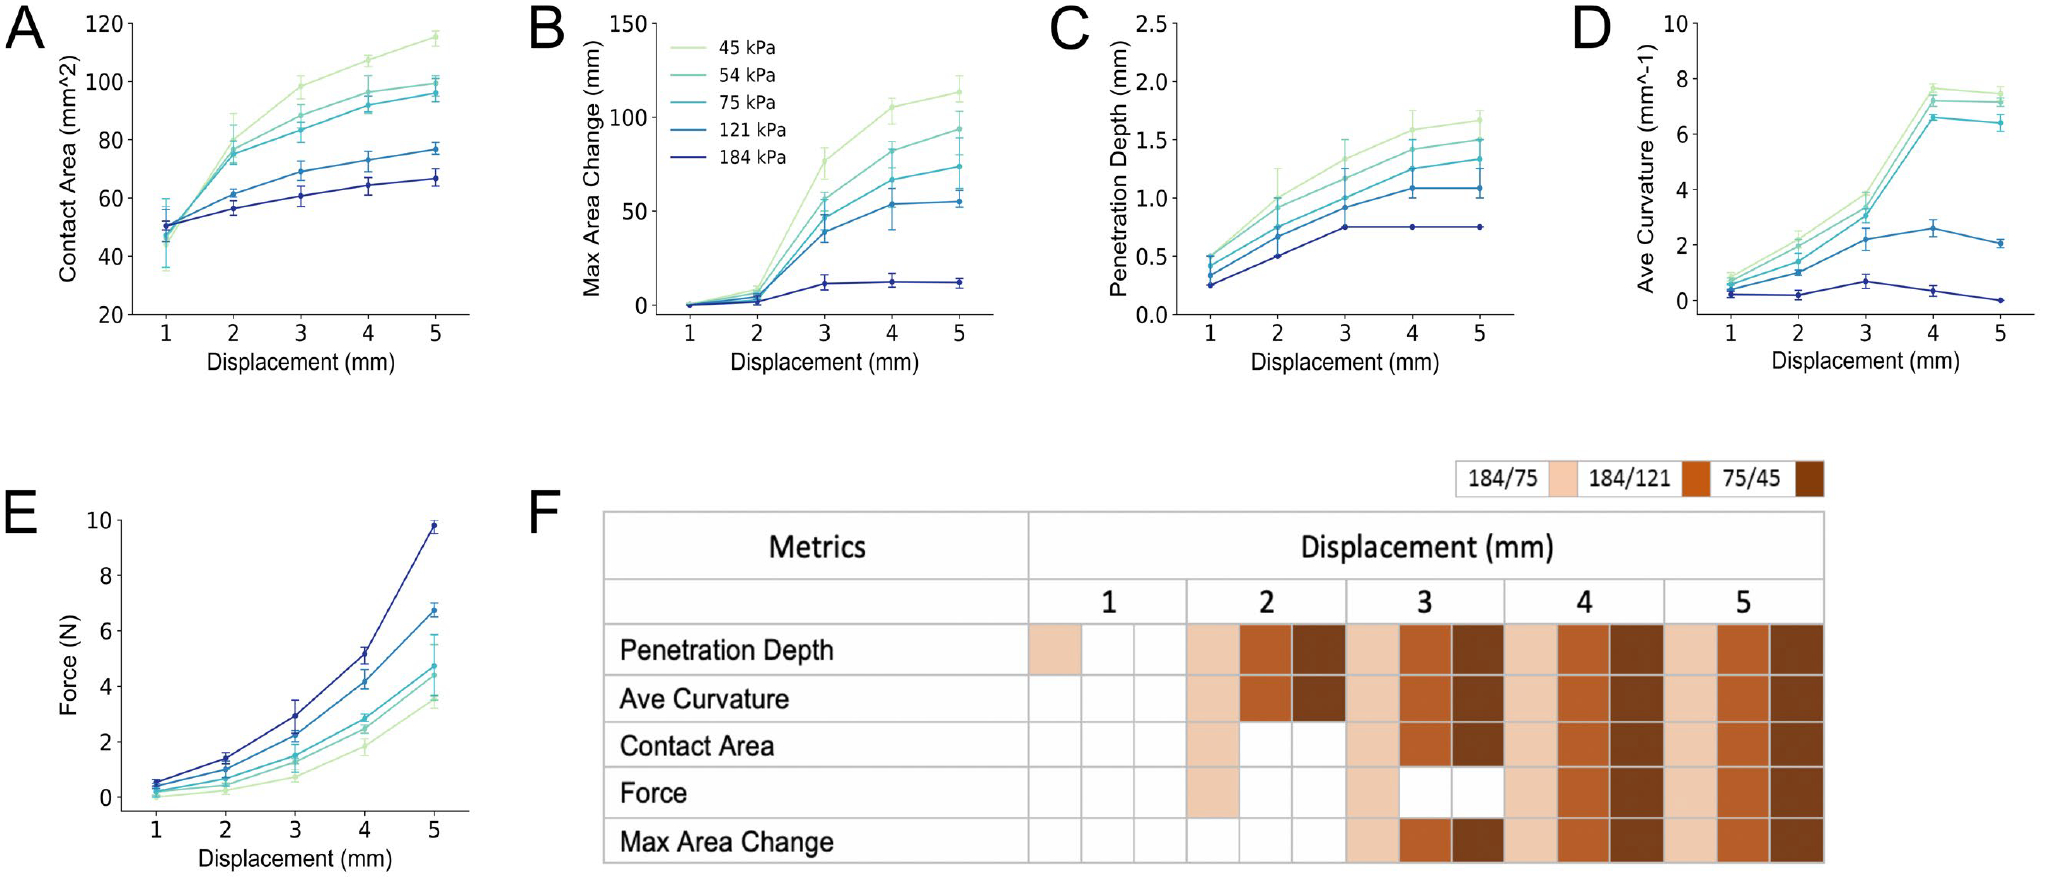
Each metric is defined in Methods. The metrics are each plotted at points from 1–5 mm into the 5 mm terminal displacement. A) The contact area is represented by the last formed ellipse, at the initial surface contact plane, which is always the largest ellipse. B) The maximum area change is the largest difference in area between two sequential (adjacent) image planes, divided by the distance between the two image planes. C) The penetration depth of the finger pad into the stimulus. D) The average curvature is average of all slope values between adjacent image planes. E) The force as measured at the stimulus. In panel F), the metrics are statistically compared (via t-test, significance shown as filled box if more than one standard deviation) across three pairs of stimuli, which vary in discriminability (see Figure 2). As can be observed, penetration depth is distinct at 1 mm into the 5 mm displacement for the 184 to 75 kPa comparison. At 2 mm, additional metrics of contact area, average curvature and force are now distinct. For each stimulus comparisons, even that of 75 to 45 kPa that is difficult to discriminate, penetration depth and average curvature are distinct by 2 mm.
Figure 6. Comparison of five temporal biomechanical metrics between five compliant substrates.
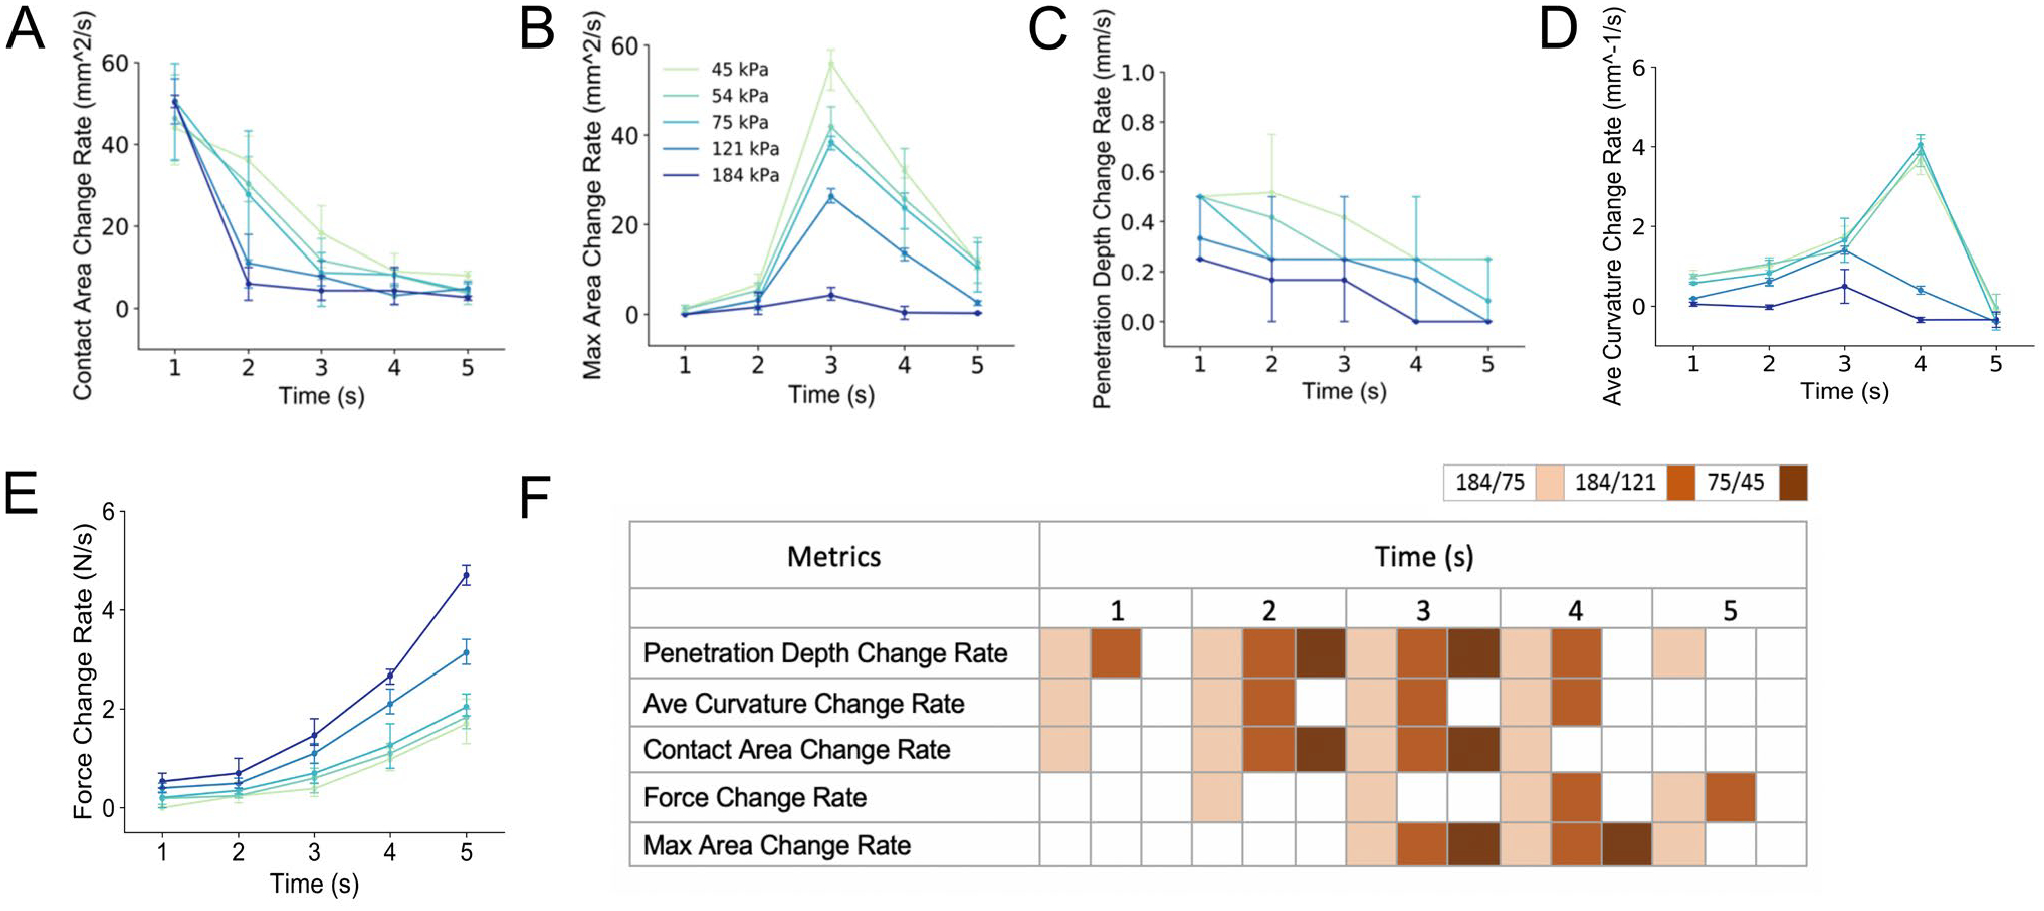
Each metric is defined in Methods. The metrics are each plotted at points from 1–5 sec (i.e., comparing 0 to 1 sec, 1 to 2 sec, etc.) into the 5 mm terminal displacement, and include the A) contact area change-rate, B) maximum area change rate, C) penetration depth change-rate, D) average curvature change-rate, and E) force change rate. In panel F), the metrics are statistically compared across three pairs of stimuli, which vary in discriminability. As can be observed, at 1 s, or perhaps even before, the 184 and 75 kPa compliances are differentiable with the first three metrics, and penetration depth rate change is also differentiable for the 184 and 121 kPa comparison which is less discriminable and represents two of the stiffer stimuli.
Furthermore, the biomechanical data for three compliant pairs, selected from the psychophysical experiments, are statistically compared, both spatially and temporally, in Figures 5F and 6F, respectively. Filled-in boxes represent t-test significance at more than one standard deviation. Overall, penetration depth and average curvature are shown to be the most efficient metrics. By 2 s or 2 mm into the 5 mm displacement, all of the compliance pairs are distinct by either metric, even the case of 75/45 kPa, which was not discriminable above 75% in the psychophysical experiments, Figure 2. Other metrics, in contrast, require greater displacement or time to distinguish the compliances.
A. Area-based Metrics
The traditionally used metric, contact area, exhibits more rapid growth for the three compliant stimuli (45, 54, 75 kPa), over the course of the displacement, with clear divergence before 2 mm displacement as compared to the less compliant stimuli (121, 184 kPa), Figure 5A. Thereafter, two groupings of stimuli emerge, which in themselves are not differentiable until later into the displacement. Likewise, maximum area change, i.e., the largest difference area between adjacent image planes, grows more rapidly with greater compliance, though diverging only after 2 mm displacement, Figure 5B.
B. Penetration Depth, Average Curvature, Force Metrics
At all points into the 5 mm displacement, the finger pad penetrates more deeply into the soft stimuli than the hard stimuli, Figure 5C. Differences between compliant stimuli appear at very early at 1 mm displacement, the first point of observation after 0 mm. The stiffer stimuli (e.g., 184 kPa) see no further penetration after 3 mm displacement, while more compliant stimuli (e.g., 45 kPa) increase through 5 mm. Likewise, average curvature is differentiable between compliance before 2 mm displacement, Figure 5D. Finally, the force- displacement relationship depicts the non-linearity for elastic objects, with force over displacement growing faster for less compliance stimuli. Between stimulus differences appear more obvious for the stiffer compliances.
IV. Discussion
The work develops new 3-D metrics to quantify the deformation of the skin’s surface, as observed in human subjects experiments, across a range of stimulus compliances with various pairwise discriminability. These metrics reflect changes in both depth and curvature of the skin’s spatial extent, and its temporal progression over a displacement. Up to now, cutaneous cues have been synonymous with 2-D contact area. The results indicate that skin deformation metrics such penetration depth and average curvature are distinguishable early in the displacement. In particular, by 2 s or 2 mm, all compliance pairs are distinct by either metric, even for the case of 75/45 kPa, which is not readily discriminable in psychophysical experiments.
The absolute values of time points such as 2 s or displacement depths of 2 mm are only preliminary, and are tied to passive touch. In particular, the analysis was done on a millimeter and second basis, and greater resolution will be required to understand precise points of discriminability. For instance, prior work has shown that stimuli at the stiffer end of this range are discriminable around 1 mm in passive touch [7]. Related compliances are differentiable here at 2 mm, but not 1 mm, and the exact position could be just past 1 mm. Furthermore, prior work has highlighted the utility of force-rate cues. Herein, force cues are of lesser utility overall, but like the prior work may be sufficient to discriminate stiffer stimuli. Average curvature and penetration depth may be more useful for stimuli nearer the modulus of the skin itself. Additionally, this initial work was done in passive touch, but the metrics, or cues, will likely see quite different levels of distinguishability in active touch. For instance, prior work has observed that stimuli can be distinguished in active touch earlier, but force rates in the present work (~1 N/s) are lower than in active touch (~4–6 N/s) [8].
Finally, the metrics of penetration depth and average curvature might be tied, at least preliminarily, to how the nervous system might encode compliance. One potential hypothesis is that penetration depth might be encoded by single afferents via change in firing frequency while skin curvature might be encoded in the recruitment of a population of afferents, in a complementary way.
Acknowledgments
This work was supported in part by grants from the National Science Foundation (IIS-1908115) and National Institutes of Health (NINDS R01NS105241). The content is solely the responsibility of the authors and does not necessarily represent the official views of the NSF or the NIH.
References
- [1].Jones LA and Lederman SJ, Human Hand Function. Oxford University Press, 2007. [Google Scholar]
- [2].Xu C, He H, Hauser SC, and Gerling GJ, “Tactile Exploration Strategies with Natural Compliant Objects Elicit Virtual Stiffness Cues,” IEEE Trans. Haptics, pp. 1–1, 2019. [DOI] [PMC free article] [PubMed] [Google Scholar]
- [3].Hauser SC, McIntyre S, Israr A, Olausson H, and Gerling GJ, “Uncovering Human-to-Human Physical Interactions that Underlie Emotional and Affective Touch Communication,” in IEEE World Haptics Conference (WHC), 2019, pp. 407–412. [DOI] [PMC free article] [PubMed] [Google Scholar]
- [4].Bergmann Tiest WM and Kappers AML, “Cues for haptic perception of compliance,” IEEE Trans. Haptics, vol. 2, no. 4, pp. 189–199, October. 2009. [DOI] [PubMed] [Google Scholar]
- [5].Srinivasan MA and LaMotte RH, “Tactual discrimination of softness,” J. Neurophysiol, vol. 73, no. 1, pp. 88–101, 1995. [DOI] [PubMed] [Google Scholar]
- [6].Kaim L and Drewing K, “Exploratory Strategies in Haptic Softness Discrimination Are Tuned to Achieve High Levels of Task Performance,” IEEE Trans. Haptics, vol. 4, no. 4, pp. 242–252, 2011. [DOI] [PubMed] [Google Scholar]
- [7].Hauser SC and Gerling GJ, “Force-Rate Cues Reduce Object Deformation Necessary to Discriminate Compliances Harder than the Skin,” IEEE Trans. Haptics, vol. 11, no. 2, pp. 232–240, April. 2018. [DOI] [PMC free article] [PubMed] [Google Scholar]
- [8].Xu C, Hauser SC, Wang Y, and Gerling GJ, “Roles of Force Cues and Proprioceptive Joint Angles in Active Exploration of Compliant Objects,” IEEE World Haptics Conference (WHC), 2019, pp. 353–358. [DOI] [PMC free article] [PubMed] [Google Scholar]
- [9].Xu C, Wang Y, Hauser SC, and Gerling GJ, “In the Tactile Discrimination of Compliance, Perceptual Cues in Addition to Contact Area Are Required,” Proc. Hum. Factors Ergon. Soc. Annu. Meet, vol. 62, no. 1, pp. 1535–1539, September. 2018. [DOI] [PMC free article] [PubMed] [Google Scholar]
- [10].Hauser SC and Gerling GJ, “Measuring tactile cues at the fingerpad for object compliances harder and softer than the skin,” in IEEE Haptics Symposium, HAPTICS, 2016, pp. 247–252. [DOI] [PMC free article] [PubMed] [Google Scholar]
- [11].Dzidek B, Bochereau S, Johnson SA, Hayward V, and Adams MJ, “Why pens have rubbery grips,” Proc. Natl. Acad. Sci. U. S. A, vol. 114, no. 41, pp. 10864–10869, October. 2017. [DOI] [PMC free article] [PubMed] [Google Scholar]
- [12].Peine WJ and Howe RD, “Do Humans Sense Finger Deformation or Distributed Pressure to Detect Lumps in Soft Tissue?” [Google Scholar]
- [13].Sato K, Kamiyama K, Kawakami N, and Tachi S, “Finger-shaped GelForce: Sensor for measuring surface traction fields for robotic hand,” IEEE Trans. Haptics, vol. 3, no. 1, pp. 37–47, 2010. [DOI] [PubMed] [Google Scholar]
- [14].Hauser SC and Gerling GJ, “Imaging the 3-D deformation of the finger pad when interacting with compliant materials,” in IEEE Haptics Symposium, HAPTICS, 2018, vol. 2018-March, pp. 7–13. [DOI] [PMC free article] [PubMed] [Google Scholar]
- [15].Gerling GJ, Hauser SC, Soltis BR, Bowen AK, Fanta KD, and Wang Y, “A Standard Methodology to Characterize the Intrinsic Material Properties of Compliant Test Stimuli,” IEEE Trans. Haptics, vol. 11, no. 4, pp. 498–508, October. 2018. [DOI] [PMC free article] [PubMed] [Google Scholar]
- [16].Delhaye B, Lefèvre P, and Thonnard JL, “Dynamics of fingertip contact during the onset of tangential slip,” J. R. Soc. Interface, vol. 11, no. 100, November. 2014. [DOI] [PMC free article] [PubMed] [Google Scholar]
- [17].Fitzgibbon AW, Pilu M, and Fisher RB, “Direct least squares fitting of ellipses,” in Proceedings - International Conference on Pattern Recognition, 1996, vol. 1, pp. 253–257. [Google Scholar]


