

Abstract
DFT calculations have been carried out for coordinatively saturated neutral and charged carbonyl complexes [M(CO)n]q where M is a metal atom of groups 2–10. The model compounds M(CO)2 (M = Ca, Sr, Ba) and the experimentally observed [Ba(CO)]+ were also studied. The bonding situation has been analyzed with a variety of charge and energy partitioning approaches. It is shown that the Dewar–Chatt–Duncanson model in terms of M ← CO σ-donation and M → CO π-backdonation is a valid approach to explain the M–CO bonds and the trend of the CO stretching frequencies. The carbonyl ligands of the neutral complexes carry a negative charge, and the polarity of the M–CO bonds increases for the less electronegative metals, which is particularly strong for the group 4 and group 2 atoms. The NBO method delivers an unrealistic charge distribution in the carbonyl complexes, while the AIM approach gives physically reasonable partial charges that are consistent with the EDA-NOCV calculations and with the trend of the C–O stretching frequencies. The AdNDP method provides delocalized MOs which are very useful models for the carbonyl complexes. Deep insight into the nature of the metal–CO bonds and quantitative information about the strength of the [M] ← (CO)8 σ-donation and [M(d)] → (CO)8 π-backdonation visualized by the deformation densities are provided by the EDA-NOCV method. The large polarity of the M–CO π orbitals toward the CO end in the alkaline earth octacarbonyls M(CO)8 (M = Ca, Sr, Ba) leads to small values for the delocalization indices δ(M–C) and δ(M···O) and significant overlap between adjacent CO groups, but the origin of the charge migration and the associated red-shift of the C–O stretching frequencies is the [M(d)] → (CO)8 π-backdonation. The heavier alkaline earth metals calcium, strontium and barium use their s/d valence orbitals for covalent bonding. They are therefore to be assigned to the transition metals.
Keywords: Carbonyl complexes, transition metals, bonding analysis, Dewar−Chatt−Duncanson model, EDA-NOCV calculations
Introduction
Carbonyl complexes are arguably the most versatile and diversified transition metal compounds, which may be considered as parent systems in transition metal chemistry.1,2 The still-growing family3−7 includes mononuclear, binuclear, and polynuclear complexes up to large cluster compounds with terminal and bridging CO ligands. There are neutral as well as positively8−12 and negatively13,14 charged metal carbonyls, which not only have academic interest but also are important for a wide range of application in catalysis,15−17 industrial application,18 and numerous biochemical processes.19 The metal–CO bonds are frequently discussed using the traditional Dewar–Chatt–Duncanson (DCD) model20,21 of σ-donation M ← CO and π-backdonation M → CO into the vacant degenerate π* orbitals of the carbonyl ligand.22,23 The latter interaction weakens the C–O bond and leads to a red-shift of the carbonyl stretching frequency toward lower wavenumbers, which can conveniently be studied with IR spectroscopy. Most carbonyl complexes exhibit a red-shift of the CO stretching mode, but some positively charged metal carbonyls have a blue-shift toward higher wavenumber and have been termed “nonclassical”24,25 or “predominantly σ-bound”8 carbonyls. It is generally assumed that the σ-donation and π-backdonation constitute the driving force behind the shift of the C–O stretching mode. The π-backdonation M → CO leads to a partial occupation of the antibonding π* orbital of CO weakening the bond, while the σ-donation M ← CO lowers the polarity and shortens the CO bond.26,27
A useful guide for the maximum number of CO ligands in transition metal carbonyl complexes is provided by the 18-electron rule, which states that the s/p/d valence orbitals of the metal are completely filled in adducts where the ligands are directly bound to the metal. The 18-electron rule for transition metals was first proposed by Langmuir in 1921 along with the 8-electron rule for main-group atoms and the 32-electron rule for the lanthanides and actinides.28 The physical basis for the electron counting rules was later provided by quantum chemistry in terms of filling the valence orbitals of the atoms. There are formal exceptions to the rules that can be explained by the symmetry of the molecular orbitals (MOs) of the complexes and the nature of the atomic orbitals (AOs) of the atomic valence shells,29−34 but they are still a very useful guide for understanding molecular structures and designing new experiments.
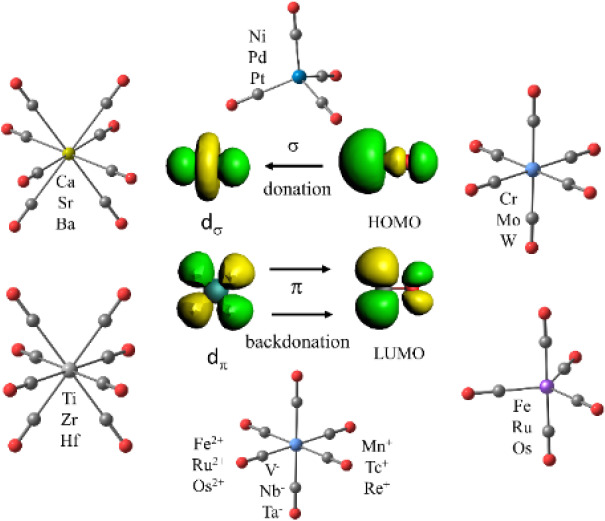
Mononuclear transition metal complexes M(CO)n with a saturated valence shell of atoms possessing an even number of electrons are classical textbook examples for the 18-electron rule. The metals of group 10 (Ni, Pd, Pt) form tetracarbonyls M(CO)4, the atoms of group 8 (Fe, Ru, Os) yield pentacarbonyls M(CO)5 and the atoms of group 6 (Cr, Mo, W) give hexacarbonyls M(CO)6.1,2 The saturated complexes of the group 4 atoms Ti, Zr, Hf were unknown until recently, despite numerous experimental attempts and theoretical calculations predicting that the putative heptacarbonyls M(CO)7 should be stable.35 The recent work on the first observation of coordinatively saturated carbonyl complexes of group 4 reported the surprising finding of octacarbonyls M(CO)8 for M = Zr, Hf instead of heptacarbonyls.36 In the case of Ti only the heptacarbonyl Ti(CO)7 was observed. Note that stable salts of the isoelectronic cations [M’(CO)7]+ (M’ = Nb, Ta) were recently synthesized.4 Theoretical calculations showed that the coordinatively saturated Ti(CO)8 is a minimum on the potential energy surface, but it is thermodynamically unstable for the loss of one CO.36 This is likely due to the release of interligand repulsion in the titanium octacarbonyl, which has significantly shorter metal–CO bonds than the heavier group 4 homologues.36 The analysis of the electronic structure of the octacarbonyls M(CO)8, which are formally 20-electron species, showed that one (a2u) occupied valence orbital of the complexes having cubic (Oh) symmetry has only coefficients at the CO ligands. The s/p/d valence AOs of the metals do not have proper symmetry to mix with the a2u MO of (CO)8 (Oh). The 20-electron complexes M(CO)8 thus fulfill the 18-electron rule, because only those electrons that can mix with the valence AOs of the metal must be considered. The same argument holds for “hypervalent” main-group compounds, where the formal 10-electron compound PF5 and the 12-electron molecule SF5 fulfill the 8-electron rule when the symmetry of the MOs is considered.37,38 The quantum theoretical foundation of the chemical bond and the symmetry considerations of the wave function were not known in 1921 when Langmuir suggested the electron-counting rules.28
Another surprising result was recently reported with the observation of the octacarbonyl complexes M(CO)8 of the group 2 metals M = Ca, Sr, Ba, which are generally classified as main-group atoms.39 A bonding analysis showed that the metal–CO bonds of the group 2 complexes are similar to those of the group 4 adducts, which can be straightforwardly discussed with the DCD model where the d AOs are the dominant orbitals of the metals for the covalent interactions. The metal–CO bonds of the alkaline earth complexes are more polar than those of the group 4 adducts, because the group 2 atoms Ca, Sr, Ba are significantly more electropositive than the group 4 atoms Ti, Zr, Hf. The equilibrium geometries of the 18-electron species of the group 2 complexes exhibit also cubic (Oh) symmetry but have an electronic triplet (3A1g) ground state, where the degenerate eg HOMO has two singly occupied orbitals above a doubly occupied a2u MO.39 Thus, the 18-electron complexes M(CO)8 (M = Ca, Sr, Ba) are effective 16-electron species, which still fulfill the 18-electron rule, because all s/p/d valence AOs of the metal are doubly or singly occupied.
The ability of the heavier alkaline earth atoms M = Ca, Sr, Ba to form typical transition metal complexes was further proven by the experimental observation of the complexes M(N2)840 and M(Bz)3 (Bz = benzene; M = Sr, Ba).41 The bonding analysis of the molecules suggested that the heavier group 2 atoms bind like classical transition metals of the d-shell block of the periodic system of the elements via donor–acceptor interactions as described by the DCD model. Similar unsupported binding modes were recently observed in the structurally characterized M(arene)2+ salts (M = Ca, Sr, Ba; arene = hexamethylbenzene and dixyline).42,43 The electrostatic contribution to the metal–ligand bonds is higher than in classical transition metal complexes of the more electronegative metals but the bonds are otherwise very similar. The transition-metal-like behavior of the heavier alkaline earth metals was supported by a theoretical study of N2 activation by M = Ca, Sr, Ba.44 A recent thorough investigation of the valence orbitals of the alkaline earth atoms concluded that Be and Mg use their (n)s and (n)p AOs for covalent bonding, whereas Ca, Sr, and Ba use their (n)s and (n – 1)d AOs like typical transition metals.45
The proposal of transition-metal-like bonds of Ca, Sr, Ba, which challenges traditional viewpoints of chemical bonds of the alkaline earth atoms, is not undisputed and was criticized by several authors. Landis and co-workers questioned the method of bonding analysis and suggested that the alkaline earth octacarbonyls are mainly bonded by ionic interactions between M2+ and [(CO)8]2–.46,47 Koch and co-workers challenged the interpretation of the red-shift of the CO stretching frequencies of Ca(CO)8 in terms of π-backbonding from the d AOs of calcium, because calculations of the complex without d AOs of Ca reproduce the stretching frequencies quite well.48−50 Van der Maelen also disputed the relevance of the d AOs of Ca, Sr, Ba for the M → (CO)8 π-backdonation and suggests that the red-shift of the CO stretching frequencies is instead due to interligand interactions between the CO ligands.51 The arguments of the author are based on real-space partitioning methods,52−57 which had previously been used for analyzing the nature of metal–CO interactions in transition metal complexes.58−61 An earlier study by Pendás and co-workers using the IQA (Interacting Quantum Atoms) method55,56,62 showed that the results of the IQA calculations basically support the DCD model concerning the relevance of π-backdonation for the red-shift of the C–O stretching frequencies in carbonyl complexes, but the calculated values of the delocalization indices (DI) suggest a possible multicenter bonding among the ligands in some carbonyl complexes such as [V(CO)6]−, Cr(CO)6, and [Fe(CO)6]2+.58−60 Since the DI values of the alkaline earth octacarbonyls deviate even stronger from those of classical carbonyl complexes, Van der Maelen concluded that the DCD model is not valid for the M–CO interactions in M(CO)8 (M = Ca, Sr, Ba).51
We think that part of the controversy about the nature of the metal–CO bond in the alkaline earth octacarbonyls stems from a different perspective. Most studies analyzed the fully formed M–CO bonds in M(CO)8 (M = Ca, Sr, Ba), which possess a large polarity toward the CO ligands. The charge distributions suggest that these complexes should be discussed in terms of interactions between ionic species M+ and [(CO)8]− or even M2+ and [(CO)8]2–, although the dissociation products are neutral M and 8 CO. The energy decomposition analysis (EDA), which was used in our work, makes it possible to analyze not only the eventually formed bond, but also to inspect the interatomic interactions that are taking place between the initial fragments during bond formation.63 The focus of the EDA is the process of bond formation whereas methods like AIM or the DI analyze the electronic structure after the bond has been formed. This becomes particularly important when polar bonds are involved. For example, the chemical bond in diatomic LiF comes from the interactions between neutral atoms Li and F, but the eventually formed molecule is better described in terms of ionic fragments Li+ and F–. The EDA method may use either neutral or charged fragments as interacting species in the calculations.64 The results will be very different and provide answers to two different questions referring to (a) the changes during bond formation and (b) the description of the final bond. Another reason for the controversy may come from a misunderstanding of ionic bonds, which exist only in solids or solvent-stabilized species, but not in molecules. Molecules have covalent bonds, polar or nonpolar, the former having a higher degree of electrostatic interactions. The chemical bonds in molecules always come from the mixing (interference) of the wave function, which may be enhanced by dispersion forces,65 but not from ionic interactions.
The controversy about the nature of the bonding in carbonyl complexes of the transition metals and the heavier alkaline earth atoms prompted us to carry out a systematic study of neutral and charged species [M(CO)n]q where Mq has an even number of electrons. The study comprises the neutral complexes of group 10 M(CO)4 (M = Ni, Pd, Pt), group 8 M(CO)5 (M = Fe, Ru, Os), group 6 M(CO)6 (M = Cr, Mo, W), group 4 M(CO)8 (M = Ti, Zr, Hf), and group 2 M(CO)8 (M = Ca, Sr, Ba). We also analyzed the bonding in the recently observed group 3 anions [M(CO)8]− (M = Sc, Y, La)66 as well as the group 7 cations [M(CO)6]+ (M = Mn, Tc, Re) and group 8 dications [M(CO)6]2+ (M = Fe, Ru, Os). Additionally, we calculated the series of isoelectronic complexes [M(CO)6]q (Mq = Hf2–, Ta–, W, Re+, Os2+, Ir3+). We also calculated the model compounds M(CO)2 (M = Ca, Sr, Ba) and the experimentally observed [Ba(CO)]+. Some of these systems have been computationally studied before.67−69 The present work provides a comprehensive analysis of the metal–CO bonding in neutral and charged mononuclear carbonyl complexes.
Theoretical Methods
The geometrical optimizations followed by harmonic vibrational frequency computations of the molecules were done at the M06-D370,71/def2-TZVPP72,73 level. The M06 functional was chosen because the calculated frequency shifts are in very good agreement with the experimental values. This basis set uses quasi-relativistic effective core potentials (ECPs) for 28 and 60 core electrons for the metal atoms of the fifth and sixth row of the periodic system,74 with the exception for Ba, and all-electron basis sets for the other atoms. In case of Ba, an ECP is used for 46 core electrons.75 The computations were carried out using the Gaussian 16 program package.76 Superfine integration grid was used for the computations. The NBO77 calculations were carried out with the version 6.0.78 The AIM79 calculations were carried out with the program AIMALL.80 All AIM results described in this work correspond to calculations performed at the M06-D3/def2-TZVPP for compounds having metals of the fourth period. For systems having metals of periods 5 and 6, the M06-D3/def2-TZVPP/WTBS (for metals) level on the optimized geometries obtained at the M06-D3/def2-TZVPP level was used. The all-electron basis set, WTBS (well-tempered basis sets)81,82 has been recommended for AIM calculations involving transition metals to avoid the ambiguities originated from the use of ECPs.83 The adaptive natural density partitioning (AdNDP) calculations were carried out with the program Multiwfn.84
The bonding situation was further studied via energy decomposition analysis (EDA)85 together with the natural orbitals for chemical valence (NOCV)86,87 method by using the ADF 2017.01 program package.88,89 The EDA-NOCV90 calculations were performed at the M06/TZ2P91 level using the M06-D3/def2-TZVPP optimized geometries where the scalar relativistic effects were included by adopting the zeroth-order regular approximation (ZORA).92 In the EDA method, the intrinsic interaction energy (ΔΕint) between two fragments is decomposed into three energy components (eq 1).
| 1 |
The ΔEelstat term represents the quasiclassical electrostatic interaction between the unperturbed charge distributions of the prepared fragments. The Pauli repulsion ΔEPauli is the energy change associated with the transformation from the superposition of the unperturbed electron densities of the isolated fragments to the wave function, which properly obeys the Pauli principle through explicit antisymmetrization and renormalization of the product wave function. The term ΔEorb is originated from the mixing of orbitals, charge transfer and polarization between the isolated fragments. Because of the use of the metahybrid functional in EDA-NOCV calculations, it gives additional metahybrid correction, ΔEmetahybrid. This comes from the use of Hartree–Fock exchange in the functional that cannot be assigned to the three energy terms in eq 1.
The combination of EDA with the NOCV method allows us to partition the total ΔEorb term into pairwise contributions of the orbital interactions. The electron density deformation Δρk(r), which originates from the mixing of the orbital pairs ρk(r) and ρ–k(r) of the interacting fragments in the complex, represents the amount and the shape of the charge flow due to the orbital interactions (eq 2), whereas the associated orbital energy term reflects the strength of such orbital interactions (eq 3). The eigenvalues υk give the amount of charge migration of the individual orbital interaction.
| 2 |
| 3 |
Therefore, both qualitative (Δρorb) and quantitative (ΔEorb) information on the strength of individual pairs of orbital interactions can be obtained from an EDA-NOCV analysis. For further details on the EDA-NOCV method and its application to the analysis of the chemical bond, some recent reviews are recommended.93−98
Results
Table 1 shows the calculated and experimental values of the M–C and C–O bond lengths and frequency shifts of the IR active carbonyl stretching modes with respect to free CO for the coordinatively saturated complexes of group 2–10 metal atoms. We also present the calculated values for the model group 2 dicarbonyls M(CO)2 (M = Ca, Sr, Ba), which are important for the present work. All molecules have an electronic singlet ground state except for the alkaline earth octacarbonyls M(CO)8 (M = Ca, Sr, Ba), which have a triplet ground state and the radical cation [Ba(CO)]•+ which has an electronic doublet state. The general agreement between the calculated and observed values is quite good, considering that some of the experimental values were obtained in the condensed phase or in solution. In particular, the calculated and experimental red- or blue-shifts are in perfect agreement.
Table 1. Calculated (M06-D3/def2-TZVPP) and Experimental M–C and C–O Distances [Å] and Vibrational Shifts of the IR Active C–O Stretching Frequencies Δυ wrt Free CO [cm–1]a.
| calcd |
exptl |
|||||
|---|---|---|---|---|---|---|
| M(CO)n | r(M–C) | r(C–O) | Δυ | r(M–C) | r(C–O) | Δυ |
| Ni(CO)4 (Td) | 1.848 | 1.132 | –84 | 1.838n | 1.141n | –86o |
| Pd(CO)4 (Td) | 2.064 | 1.129 | –72 | –73p | ||
| Pt(CO)4 (Td) | 2.014 | 1.132 | –95 | –95q | ||
| Fe(CO)5 (D3h)b | 1.819/1.820 | 1.134/1.137 | –101/–122 | 1.811/1.803d | 1.117/1.133d | –108/–130o |
| Ru(CO)5 (D3h)b | 1.958/1.971 | 1.133/1.137 | –108/–133 | 1.941/1.961e | 1.126/1.127e | –107/–144o |
| Os(CO)5 (D3h)b | 1.979/1.970 | 1.134/1.139 | –105/–145 | 1.982/1.987f | 1.130/1.131f | –108/–152o |
| Fe(CO)62+ (Oh) | 1.936 | 1.112 | 107 | 1.903–1.917j | 1.097–1.114j | 62j |
| Ru(CO)62+ (Oh) | 2.041 | 1.113 | 67 | 2.019–2.033j | 1.091–1.108j | 55j |
| Os(CO)62+ (Oh) | 2.054 | 1.114 | 58 | 2.013–2.034j | 1.090–1.125j | 46j |
| Mn(CO)6+ (Oh) | 1.911 | 1.122 | –11 | 1.899–1.914k | 1.112–1.124k | –45k |
| Tc(CO)6+ (Oh) | 2.042 | 1.123 | –30 | 2.025–2.029l | 1.113–1.114l | |
| Re(CO)6+ (Oh) | 2.054 | 1.124 | –35 | 1.98–2.07g | 1.12–1.19g | –58g |
| Cr(CO)6 (Oh) | 1.917 | 1.136 | –134 | 1.918c | 1.14c | –143o |
| Mo(CO)6 (Oh) | 2.073 | 1.136 | –141 | 2.063c | 1.145c | –139o |
| W(CO)6 (Oh) | 2.080 | 1.137 | –148 | 2.058c | 1.148c | –145o |
| V(CO)6– (Oh) | 1.966 | 1.152 | –257 | –(266–296)h | ||
| Nb(CO)6– (Oh) | 2.139 | 1.151 | –256 | 2.089h | 1.160h | –(267–289)h |
| Ta(CO)6– (Oh) | 2.139 | 1.152 | –262 | 2.083h | 1.149h | –(268–296)h |
| Ir(CO)63+ (Oh) | 2.071 | 1.108 | 127 | |||
| Os(CO)62+ (Oh) | 2.054 | 1.114 | 58 | 46j | ||
| Re(CO)6+ (Oh) | 2.054 | 1.124 | –35 | 1.98–2.07g | 1.12–1.19g | –58g |
| W(CO)6 (Oh) | 2.080 | 1.137 | –148 | 2.058c | 1.148c | –145o |
| Ta(CO)6– (Oh) | 2.139 | 1.152 | –262 | 2.083h | 1.149h | –293h |
| Hf(CO)62– (Oh) | 2.239 | 1.168 | –375 | 2.174–2.180i | 1.162–1.165i | –386i |
| Ti(CO)8 (Oh) | 2.211 | 1.135 | –151 | |||
| Zr(CO)8 (Oh) | 2.349 | 1.134 | –138 | –164m | ||
| Hf(CO)8 (Oh) | 2.335 | 1.135 | –143 | –171m | ||
| Sc(CO)8– (Oh) | 2.325 | 1.146 | –234 | –251t | ||
| Y(CO)8– (Oh) | 2.486 | 1.144 | –214 | –239t | ||
| La(CO)8– (Oh) | 2.687 | 1.142 | –204 | –229t | ||
| Ca(CO)8 (Oh) | 2.602 | 1.127 | –119 | –156s | ||
| Sr(CO)8 (Oh) | 2.748 | 1.130 | –115 | –148s | ||
| Ba(CO)8 (Oh) | 2.944 | 1.129 | –107 | –129s | ||
| Ca(CO)2 (D∞h) | 2.338 | 1.158 | –232 | |||
| Sr(CO)2 (D∞h) | 2.511 | 1.156 | –238 | |||
| Ba(CO)2 (D∞h) | 2.729 | 1.151 | –217 | |||
| Ba(CO)•+ (C∞v) | 2.649 | 1.139 | –173 | –232r | ||
Negative Δυ values indicate a red-shift, whereas positive values signal a blue-shift.
The first value is for the axial CO, and the second is for the equatorial CO ligands.
Reference (134).
Reference (135).
Reference (136).
Reference (137).
Reference (138).
Reference (139).
Reference (140).
Reference (141).
Reference (142).
Reference (36).
Reference (143).
Reference (1).
Reference (144).
Reference (145).
Reference (110).
Reference (39).
Reference (66).
Figure 1 shows a plot of the calculated bond lengths r(C–O) and shifts of the C–O stretching frequencies Δυ. There is clearly a linear correlation between the two sets of data with a correlation coefficient of R2 = 0.97 and a standard deviation of 19.6 cm–1. The three red points refer to the dicarbonyls M(CO)2 (M = Ca, Sr, Ba), which exhibit a slightly higher deviation from the regression line, but they still agree quite well with the overall correlation. It is important to realize that the physical mechanism that leads to a C–O bond lengthening of the carbonyl ligands and the concomitant red-shift of the stretching mode, comes from the electronic charge donation of the metal to the CO ligands. This is modulated by orbital interactions where electrons from occupied π orbitals of the metal occupy formerly vacant π* orbitals of CO, which are the lowest lying vacant MOs of the ligand. This process is an example of the well-established orbital interaction model introduced by Fukui99,100 and by Woodward and Hoffmann.101
Figure 1.
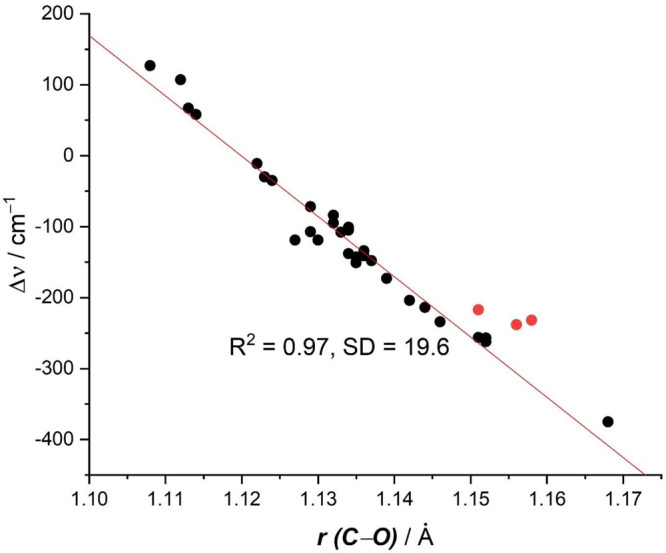
Plot of calculated C–O distances r(C–O) and the shift of the CO stretching frequencies of the carbonyl complexes Δυ. The values are taken from Table 1, the red dots refer to the dicarbonyls M(CO)2 (M = Ca, Sr, Ba).
Table 2 shows some theoretical values relevant to the topic of the present work, namely the physical mechanism determining the C–O stretching frequencies of the carbonyl complexes and the choice of a consistent bonding model. The first column gives the electronegativities of the metal atoms EN(M), which are important for understanding the trend in the polarity of the M–CO bonds of the neutral complexes and the frequency shifts. The two popular sets of electronegativities suggested by Pauling and Allred/Rochow exhibit small variations in the trend of the absolute values, which come from the different definitions of the term. But there is overall agreement that the electronegativity becomes smaller from the right to the left side of the periodic system of the elements, i.e., from the later to the earlier metals. The decrease of the EN(M) values is particularly large for the group 4 and group 2 atoms. This means that the polarity of the M–CO bonds in the group 4 and group 2 complexes increases strongly in the direction of the CO ligand compared to the group 6, 8, and 10 carbonyls.
Table 2. Pauling and (in Parentheses) Allred–Rochow Electronegativities of the Metal Atoms EN(M)a.
| M(CO)n | EN(M) | Δυc | q(M) | δ(M–C) | δ(M···O) |
|---|---|---|---|---|---|
| Ni(CO)4 (Td) | 1.91(1.75) | –86 (−84) | 0.24 [0.48] | 0.962 | 0.154 |
| Pd(CO)4 (Td) | 2.20(1.30) | –73 (−72) | 0.22 [0.28] | 0.830 | 0.122 |
| Pt(CO)4 (Td) | 2.20(1.44) | –95 (−95) | 0.46 [0.61] | 1.020 | 0.151 |
| Fe(CO)5 (D3h)b | 1.83(1.64) | –108/–130 (−101/–122) | –0.63 [0.76] | 0.992/1.046 | 0.168/0.175 |
| Ru(CO)5 (D3h)b | 2.20(1.42) | –107/–144 (−108/–133) | –0.42 [0.75] | 1.018/1.058 | 0.159/0.166 |
| Os(CO)5 (D3h)b | 2.20(1.52) | –108/–152 (−105/–145) | –0.15 [0.99] | 1.039/1.130 | 0.157/0.170 |
| Fe(CO)62+ (Oh) | 62 (107) | –0.52 [1.01] | 0.746 | 0.097 | |
| Ru(CO)62+ (Oh) | 55 (67) | –0.52 [1.05] | 0.812 | 0.102 | |
| Os(CO)62+ (Oh) | 46 (58) | –0.29 [1.27] | 0.845 | 0.106 | |
| Mn(CO)6+ (Oh) | –45 (−11) | –1.15 [1.05] | 0.819 | 0.129 | |
| Tc(CO)6+ (Oh) | (−30) | –0.94 [1.23] | 0.852 | 0.123 | |
| Re(CO)6+ (Oh) | –58 (−35) | –0.67 [1.35] | 0.877 | 0.125 | |
| Cr(CO)6 (Oh) | 1.66(1.56) | –143 (−134) | –1.72 [1.21] | 0.833 | 0.140 |
| Mo(CO)6 (Oh) | 2.16(1.30) | –139 (−141) | –1.19 [1.29] | 0.843 | 0.132 |
| W(CO)6 (Oh) | 2.36(1.40) | –145 (−148) | –0.91 [1.49] | 0.854 | 0.130 |
| Ir(CO)63+ (Oh) | (127) | 0.19 [1.29] | 0.794 | 0.084 | |
| Os(CO)62+ (Oh) | 46 (58) | –0.29 [1.27] | 0.845 | 0.106 | |
| Re(CO)6+ (Oh) | –58 (−35) | –0.67 [1.35] | 0.877 | 0.125 | |
| W(CO)6 (Oh) | –145 (−148) | –0.91 [1.49] | 0.854 | 0.130 | |
| Ta(CO)6– (Oh) | –293 (−262) | –1.00 [1.61] | 0.765 | 0.119 | |
| Hf(CO)62– (Oh) | –386 (−375) | –0.99 [1.65] | 0.624 | 0.097 | |
| Ti(CO)8 (Oh) | 1.54(1.32) | (−151) | –1.70 [1.64] | 0.426 | 0.075 |
| Zr(CO)8 (Oh) | 1.33(1.22) | –164 (−138) | –0.94 [1.76] | 0.432 | 0.069 |
| Hf(CO)8 (Oh) | 1.30(1.23) | –171 (−143) | –0.82 [1.85] | 0.434 | 0.066 |
| Sc(CO)8– (Oh) | –251 (−234) | –1.59 [1.63] | 0.306 | 0.049 | |
| Y(CO)8– (Oh) | –239 (−214) | –0.86 [1.68] | 0.312 | 0.048 | |
| La(CO)8– (Oh) | –229 (−204) | –0.76 [2.12] | 0.254 | 0.043 | |
| Ca(CO)8 (Oh) | 1.00(1.04) | –156 (−119) | 1.24 [1.45] | 0.159 | 0.020 |
| Sr(CO)8 (Oh) | 0.95(0.99) | –148 (−115) | 1.23 [1.87] | 0.139 | 0.012 |
| Ba(CO)8 (Oh) | 0.89(0.97) | –129 (−107) | 1.14 [1.78] | 0.136 | 0.011 |
| Ca(CO)2 (D∞h) | (−232) | 1.19 [1.27] | 0.515 | 0.101 | |
| Sr(CO)2 (D∞h) | (−238) | 1.17 [1.06] | 0.300 | 0.031 | |
| Ba(CO)2 (D∞h) | (−217) | 1.03 [1.04] | 0.285 | 0.025 | |
| Ba(CO)•+ (C∞v) | –232 (−173) | 1.45 [1.03] | 0.300 | 0.024 |
Experimental and (in parentheses) calculated frequency shift of the IR-active stretching mode of CO wrt free CO [cm–1]. Calculated atomic partial charges of the metal atom q(M) using NBO6 and [in brackets] AIM values. Calculated delocalization indices δ(M–C) and δ(M···O). The calculated values are obtained at the M06-D3/def2-TZVPP&WTBS level for the period 5 and 6 metal atoms.
The first value is for the axial CO and the second for the equatorial CO ligands.
Figure 2 shows the principal components of the DCD model for metal–carbonyl bonds of transition metals. The red-shift of the C–O stretching mode toward lower wavenumbers is easily explained in terms of M → CO π-backdonation from occupied d(π) AOs of the metal to the vacant π* MO of CO. The blue-shift of nonclassical carbonyls occurs when the M → CO π-backdonation is very weak. It was originally explained with a dominant contribution of M ← CO σ-donation from the HOMO of CO, which was thought to be weakly antibonding.102 Two independent studies suggested that the blue-shift is rather due to an inductive effect of positively charged metal atoms on the occupied orbitals of the CO ligand, which become less polarized and thus shorter and stronger.26,27 This explains why a blue-shift of the CO stretching mode is only found in positively charged carbonyls.24,25Table 2 shows that a blue-shift is found in some but not in all cations, because M → CO π-backdonation may still occur in positively charged species.68
Figure 2.
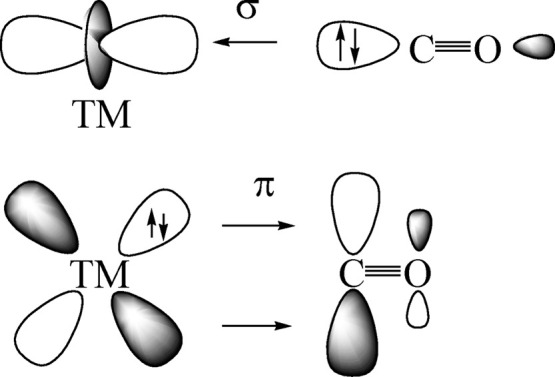
Schematic representation of the synergistic OC → TM σ-donation and OC ← TM π-backdonation.
Table 2 also gives the calculated partial charges of the metal atoms in the carbonyl complexes using two different methods, i.e., NBO and AIM. The results for the neutral adducts exhibit a contradictory and somewhat puzzling trend for the group 2–10 species. The NBO method suggests slightly positive charges for the group 10 atoms Ni, Pd, Pt, but negative charges for the metal atoms of group 8 and even large negative charges for the group 6 and group 4 atoms. This does neither agree with the electronegativities of the metals nor with the change in the vibrational frequency shift of the CO ligands, which indicate a continuous increase of M → CO π-backdonation. In contrast, the AIM charges indicate a continuous increase of the positive charge of the metal from the group 10 to the group 2 atoms. The NBO method even suggests negative partial charges of the metal atoms in the group 8 dications [M(CO)6]2+ (M = Fe, Ru, Os), which would mean that CO is a strong σ and π donor. The NBO charges for the group 4 complexes M(CO)8 (M = Zr, Hf) suggest positively charged CO ligands between +0.22 (Zr) and +0.23 (Hf), which does not agree with the observed large red-shifts. We think that the atomic partial charges of the NBO method do not provide a faithful description of the charge distribution in the carbonyl complexes. It comes from the arbitrary division of the AOs into valence and Rydberg orbitals, which are differently treated in the NBO algorithms leading to biased preferences of the preselected valence AOs. This is particularly problematic for transition metal compounds, where the (n)p functions are considered as Rydberg orbitals but not as valence orbitals. A previous work showed that the NBO results for transition metal compounds are questionable.103
Table 2 also shows the calculated values of the delocalization indices δ(M–C) and δ(M···O), which were previously reported as evidence against strong M → CO π-backdonation in the alkaline earth octacarbonyls M(CO)8 (M = Ca, Sr, Ba).51 It was concluded that the significantly smaller δ(M–C) and δ(M···O) values in the latter group 2 complexes compared with the classical transition metal complexes of groups 6–10 would indicate that there is no π-backdonation in the adducts. The large red-shift of the C–O stretching frequencies was explained in terms of direct interligand interactions from occupied CO orbitals to vacant π* MOs of neighboring carbonyl ligands.51
We think that the arguments based on the calculated delocalization indices are not valid, because the strong polarization of the metal–CO bonds of the very electropositive alkaline earth atoms is not properly considered. The delocalization index δ(A–B), which is defined within the framework of AIM theory, is obtained by integration of the exchange-correlation density over the atomic basins of atoms A and B.104−106 It is related to the covariance of the populations in the domains of atoms A and B.107 The physical origin of covalent bonds in molecules is the interference of the wave functions of the atoms.108,109 This still holds when the bond is very polar due to the large difference of the electronegativity of the atoms bonded to each other. The AO coefficient of one atom and so the exchange-correlation density may become very small in polar bonds, but the orbitals of the atom are crucial for establishing the bond. The electrostatic contribution to the bond energy increases in polar bonds and the quantitative impact of orbital mixing may decrease compared to nonpolar bonds, but without the interference of the wave functions there would be no bond. A mere correlation of terms like the delocalization index between bonds that possess different polarities may lead to wrong conclusions about the occurrence of orbital interactions.
Table 2 shows that the δ(M–C) and δ(M···O) values of the neutral complexes of group 10, 8, and 6 metal atoms are rather large, but they become significantly smaller for the saturated carbonyls of group 4 and particularly group 2 metals. But the red-shift of Δυ even increases or remains very large in the octacarbonyls of group 4 and group 2 metals. This is noteworthy because in the latter adducts only four and two electrons, respectively, are available for π-backdonation into eight CO ligands. In order to check whether the large red-shift in the alkaline earth octacarbonyls comes from the direct charge donation between neighboring carbonyls as recently suggested,51 we optimized the geometries of the model complexes M(CO)2 (M = Ca, Sr, Ba) in the electronic singlet state where the CO groups are trans to each other and we calculated the vibrational frequencies of the energy minimum species. Table 2 shows that the dicarbonyls exhibit an even higher red-shift of the C–O stretching frequencies than the octacarbonyls although there is no direct interligand interaction. The larger red-shift of the dicarbonyls is easily explained by the π-backdonation into two rather than eight CO ligands. This leads also to significantly shorter M–CO bonds in the dicarbonyls, which induces larger δ(M–C) and δ(M···O) values than in the octacarbonyls. Finally, we also calculated the monocarbonyl cation Ba(CO)•+, which was experimentally observed by matrix isolation studies.110 Although there is only one electron available for π-backdonation and although the donor is a positively charged cation,111 there is a large red-shift of the C–O stretching mode. The calculated delocalization indices δ(Ba–C) and δ(Ba···O) suggest the absence of π-backdonation, which does not explain the observed red-shift. Table 2 shows also that the δ(M–C) and δ(M···O) values of the charged carbonyl complexes of groups 5–10 metals have similar large values as the neutral adducts, although the frequency variation of the C–O stretching mode ranges from large red-shift to blue-shift. The delocalization index is not a reliable indicator to reflect the π-backdonation!
The description of the bonding situation in terms of the 2-center electron-pair model of Lewis is cumbersome and not very useful for transition metal complexes, because the number of available valence electrons does not match the σ and degenerate π bonds between the metal and the ligands. The standard NBO method is thus not very helpful, because it gives only one of numerous possible Lewis structures. The delocalized electron-pair bonding of transition metal complexes is much better described with the AdNDP approach developed by Boldyrev,112 which is the method of choice for molecules with delocalized bonds.113 This comes to the fore when the AdNDP orbitals for the transition metal carbonyl complexes M(CO)n are inspected in the light of the MO correlation diagrams shown in Figure 3. According to the qualitative correlation diagram, there are two degenerate sets of occupied π MOs for n = 4, 5 and one doubly or triply degenerate π MO for n = 6, 8. The AdNDP program gives orbitals that exactly match the correlation diagram.
Figure 3.


Correlation diagram of the splitting of the valence orbitals of the metals M and the ligands (CO)n in the carbonyl complexes M(CO)n and occupation of the σ and π orbitals. (a) Tetrahedral M(CO)4 (Td). (b) Trigonal bipyramidal M(CO)5 (D3h). (c) Octahedral M(CO)6 (Oh). (d) Cubic M(CO)8 (Oh) where M has four valence electrons. (e) Cubic M(CO)8 (Oh) where M has two valence electrons.
Figure 4 shows the occupied valence AdNDP π MOs of the third-row carbonyl complexes Ni(CO)4 – Ca(CO)8. The AdNDP σ MOs are shown in Figure S1 of the Supporting Information. Figure 4 also gives the percentage contribution of the metal AOs in the π orbitals estimated by the square of the AO coefficients. It becomes obvious that the metal AO part in the π orbitals continuously decreases from the group 10 atom Ni to the group 2 atom Ca, where the contribution of the 3d(π) AO is only 12%. However, the AdNDP orbitals use the same preselection of the AOs as atomic valence function, which yields an unrealistic large polarization of the π orbitals toward the metal atoms. This becomes obvious when the percentage values of the metal AO coefficients given by the AdNDP π MOs are compared with the original π MOs of the M06-D3/def2-TZVPP calculations. The trend of the polarization predicted by the two sets of orbitals is generally the same, but the original MOs give a much smaller percentage contribution for the metals of groups 4–10. The NBO method defines the (n)s and (n – 1)d AOs as genuine valence orbitals for the latter metals but only the (n)s AOs of the group 2 atoms are considered as valence AOs.77 The algorithm of the NBO method is biased toward the (n)s and (n – 1)d AOs of the transition metals, resulting in an unphysical charge distribution in the transition metal complexes and an inappropriate polarization of the NBO orbitals.
Figure 4.

Plot of the valence π MOs of the third-row carbonyl complexes M(CO)n given by the AdNDP method. The isovalue is 0.05 au. The percentage values give the percentage contribution of the metal AOs in the π orbitals calculated by the square of the AO coefficients. The percentage values in parentheses are calculated from the original orbitals of the M06-D3/def2-TZVPP calculations.
While the contribution of the metal AOs in the strongly polarized MOs is quantitatively small, it is highly relevant for the charge distribution, because the electrons in the orbitals stem from the metal. It is misleading to neglect the metal d AOs for the metal–CO bonding, because the interference with the CO π* orbitals is the driving force for the π bonds yielding a strong charge migration M → CO, which is the reason for the experimentally observed large red-shift of the CO stretching frequencies. Visual inspection of the eg π MO of Ca(CO)8 shows that the π* lobes of CO are in close proximity to each other without overlapping with the 3d(π) AO of Ca, while the Ti 3d(π) AO is overlapping with the π* MO of the CO ligands. Note that the AdNDP orbitals are plotted with the same isovalue throughout. The shape of the eg π MO of Ca(CO)8 makes it comprehensible why the δ(M–C) and δ(M···O) values of the group 10, 8, and 6 metal atoms in the carbonyl complexes are rather large, but become significantly smaller for the carbonyls of group 4 and particularly group 2 metals as reported by Van der Maelen.51 The minor contribution of the 3d(π) AO of Ca to the eg π MO of Ca(CO)8 also explains why the red-shift of the CO stretching frequencies of Ca(CO)8 is found in calculations without d AOs of Ca as reported by Koch et al.48 The AdNDP orbitals and the EDA-NOCV calculations (see below) show that the conclusion about the irrelevance of the 3d AOs of Ca is not valid.
Table 3 shows the numerical results of the EDA-NOCV calculations of the saturated neutral carbonyls of group 10–group 2 metals M(CO)n using the neutral fragments M and the ligands (CO)n in their electronic singlet or triplet state as interacting moieties. The choice of the electronic reference state of the metal atoms comes from inspecting the symmetry of the occupied orbitals of M(CO)n and the correlation with the atomic valence orbitals of M as shown in Figure 3. Details are given in a textbook33 and in previous publications.36,39 The strength of the EDA-NOCV method is that it takes into account not just one component, but the entire interatomic interactions, which are decomposed into three terms that can be interpreted in a physically meaningful way. Another strength is the partitioning of the total orbital interaction (covalent) term ΔEorb into pairwise orbital contributions, which links the numerical results to the frontier orbital model.99−101 An additional feature is that the charge migration associated with the pairwise orbital interactions can be graphically visualized as deformation densities Δρ. Since the EDA-NOCV calculations were carried out using metahybrid functional, small values for ΔEmetahybrid appear that cannot be associated with a physical interaction, which is not important for the bonding analysis.
Table 3. Numerical EDA-NOCV Results of the Neutral Carbonyl Complexes M(CO)n at the M06/TZ2P//M06-D3/def2-TZVPP Level Using the Neutral Fragments M and (CO)n in Their Electronic Singlet (S) or Triplet (T) State as Interacting Moietiesa.
| orbital interactionb | interacting fragments | |||
|---|---|---|---|---|
| M(CO)4 | ||||
| Ni (S) + (CO)4 (S) | Pd (S) + (CO)4 (S) | Pt (S) + (CO)4 (S) | ||
| ΔEint | –200.3 | –97.3 | –143.2 | |
| ΔEmetahybrid | 44.4 | 36.5 | 48.0 | |
| ΔEPauli | 382.7 | 396.3 | 603.7 | |
| ΔEelstatc | –327.9 (52.2%) | –309.4 (58.4%) | –474.9 (59.7%) | |
| ΔEorbc | –300.0 (47.8%) | –220.8 (41.6%) | –320.1 (40.3%) | |
| ΔEorb(1) (2t2)d | [M(d)] → (CO)4 π-backdonation | –204.0 (68.0%) | –146.7 (66.4%) | –206.4 (64.5%) |
| ΔEorb(2) (e)d | [M(d)] → (CO)4 π-backdonation | –73.0 (24.3%) | –49.0 (22.2%) | –58.8 (18.4%) |
| ΔEorb(3) (a1)d | [M(s)] ← (CO)4 σ-donation | –7.3 (2.4%) | –10.8 (4.9%) | –29.4 (9.2%) |
| ΔEorb(4) (1t2)d | [M(p)] ← (CO)4 σ-donation | –12.6 (4.2%) | –11.4 (5.2%) | –22.5 (7.0%) |
| ΔEorb(rest)d | –3.1 (1.0%) | –2.9 (1.3%) | –3.0 (0.9%) | |
| M(CO)5 | ||||
| Fe (S) + (CO)5 (S) | Ru (S) + (CO)5 (S) | Os (S) + (CO)5 (S) | ||
| ΔEint | –325.1 | –263.6 | –336.5 | |
| ΔEmetahybrid | 62.8 | 58.3 | 56.8 | |
| ΔEPauli | 487.2 | 618.5 | 730.6 | |
| ΔEelstatc | –393.5 (45.0%) | –465.0 (49.5%) | –575.9 (51.2%) | |
| ΔEorbc | –481.6 (55.0%) | –475.3 (50.5%) | –548.0 (48.8%) | |
| ΔEorb(1) (e’’)d | [M(d)] → (CO)5 π-backdonation | –221.9 (46.1%) | –198.7 (41.8%) | –221.6 (40.4%) |
| ΔEorb(2) (2e’)d | [M(d)] → (CO)5 π-backdonation | –154.4 (32.1%) | –128.2 (27.0%) | –138.1 (25.2%) |
| ΔEorb(3) (2a’1)d | [M(d)] ← (CO)5 σ-donation | –78.8 (16.4%) | –108.6 (22.8%) | –120.4 (22.0%) |
| ΔEorb(4) (1e’)d | [M(p)] ← (CO)5 σ-donation | –7.4 (1.5%) | –11.4 (2.4%) | –18.4 (3.4%) |
| ΔEorb(5) (1a’1)d | [M(s)] ← (CO)5 σ-donation | –5.4 (1.1%) | –9.0 (1.9%) | –20.9 (3.8%) |
| ΔEorb(6) (a’’2)d | [M(p)] ← (CO)5 σ-donation | –5.4 (1.1%) | –6.6 (1.4%) | –8.9 (1.6%) |
| ΔEorb(rest)d | –8.3 (1.7%) | –12.8 (2.7%) | –19.7 (3.6%) | |
| M(CO)6 | ||||
| Cr (S) + (CO)6(S) | Mo (S) + (CO)6 (S) | W (S) + (CO)6 (S) | ||
| ΔEint | –372.1 | –343.2 | –419.3 | |
| ΔEmetahybrid | 52.2 | 53.9 | 46.5 | |
| ΔEPauli | 336.7 | 393.3 | 422.1 | |
| ΔEelstatc | –286.9 (37.7%) | –326.4 (41.3%) | –383.2 (43.2%) | |
| ΔEorbc | –474.2 (62.3%) | –464.0 (58.7%) | –504.7 (56.8%) | |
| ΔEorb(1) (t2g)d | [M(d)] → (CO)6 π-backdonation | –315.9 (66.6%) | –270.6 (58.3%) | –278.1 (55.1%) |
| ΔEorb(2) (eg)d | [M(d)] ← (CO)6 σ-donation | –129.4 (27.3%) | –153.4 (33.1%) | –165.6 (32.8%) |
| ΔEorb(3) (a1g)d | [M(s)] ← (CO)6 σ-donation | –4.9 (1.0%) | –8.0 (1.7%) | –17.4 (3.5%) |
| ΔEorb(4) (t1u)d | [M(p)] ← (CO)6 σ-donation | –9.3 (2.0%) | –13.8 (3.0%) | –18.3 (3.6%) |
| ΔEorb(rest)d | –14.7 (3.1%) | –18.2 (3.9%) | –25.3 (5.0%) | |
| M(CO)8 | ||||
| Ti (S) + (CO)8(S) | Zr (S) + (CO)8 (S) | Hf (S) + (CO)8 (S) | ||
| ΔEint | –361.3 | –337.8 | –399.4 | |
| ΔEmetahybrid | 31.9 | 43.3 | 36.0 | |
| ΔEPauli | 172.5 | 214.7 | 223.3 | |
| ΔEelstatc | –184.0 (32.5%) | –215.4 (36.2%) | –246.1 (37.4%) | |
| ΔEorbc | –381.7 (67.5%) | –380.4 (63.8%) | –412.5 (62.6%) | |
| ΔEorb(1) (eg)d | [M(d)] → (CO)8 π-backdonation | –262.4 (68.7%) | –236.4 (62.1%) | –247.0 (59.9%) |
| ΔEorb(2) (t2g)d | [M(d)] ← (CO)8 σ-donation | –87.6 (22.9%) | –102.9 (27.1%) | –110.7 (26.8%) |
| ΔEorb(3) (a1g)d | [M(s)] ← (CO)8 σ-donation | –4.8 (1.3%) | –6.6 (1.7%) | –12.7 (3.1%) |
| ΔEorb(4) (t1u)d | [M(p)] ← (CO)8 σ-donation | –7.5 (2.0%) | –12.0 (3.2%) | –12.3 (3.0%) |
| ΔEorb(5) (a2u)d | (CO)8 polarization | –3.3 (0.9%) | –6.5 (1.7%) | –6.2 (1.5%) |
| ΔEorb(rest)d | –16.1 (4.2%) | –16.0 (4.2%) | –23.6 (5.7%) | |
| M(CO)8 | ||||
| Ca (T) + (CO)8 (S) | Sr (T) + (CO)8 (S) | Ba (T) + (CO)8 (S) | ||
| ΔEint | –256.8 | –239.9 | –154.8 | |
| ΔEmetahybrid | 19.7 | 25.7 | 21.1 | |
| ΔEPauli | 35.5 | 43.8 | 51.1 | |
| ΔEelstatc | –67.2 (21.5%) | –63.0 (20.4%) | –84.4 (37.2%) | |
| ΔEorbc | –244.7 (78.5%) | –246.3 (79.6%) | –142.7 (62.8%) | |
| ΔEorb(1) (eg)d | [M(d)] → (CO)8 π-backdonation | –211.6 (86.5%) | –212.0 (86.1%) | –97.6 (68.4%) |
| ΔEorb(2) (t2g)d | [M(d)] ← (CO)8 σ-donation | –22.2 (9.1%) | –21.6 (8.8%) | –25.8 (18.1%) |
| ΔEorb(3) (a1g)d | [M(s)] ← (CO)8 σ-donation | –2.4 (1.0%) | –3.2 (1.3%) | –4.1 (2.9%) |
| ΔEorb(4) (t1u)d | [M(p)] ← (CO)8 σ-donation | –2.4 (1.0%) | –2.1 (0.9%) | –4.5 (3.2%) |
| ΔEorb(5) (a2u)d | (CO)8 polarization | –0.8 (0.3%) | –1.1 (0.4%) | –2.4 (1.7%) |
| ΔEorb(rest)d | –5.3 (2.2%) | –6.3 (2.6%) | –8.3 (5.8%) | |
| Ca+ (D) + (CO)8– (D) | Sr+ (D) + (CO)8– (D) | Ba+ (D) + (CO)8– (D) | ||
| ΔEint | –264.9 | –255.7 | –222.5 | |
| ΔEmetahybrid | 13.7 | 15.8 | 10.6 | |
| ΔEPauli | 60.1 | 64.3 | 67.7 | |
| ΔEelstatc | –177.9 (52.5%) | –175.6 (52.3%) | –176.0 (58.5%) | |
| ΔEorbc | –160.9 (47.5%) | –160.1 (47.7%) | –124.8 (41.5%) | |
| ΔEorb(1) (2eg)d | [M(d)]+ → (CO)8– π-backdonation | –78.1 (48.5%) | –82.9 (51.8%) | –49.1 (39.3%) |
| ΔEorb(2) (1eg)d | [M(d)]+ ← (CO)8– π donation | –10.3 (6.4%) | –10.1 (6.3%) | –12.9 (10.3%) |
| ΔEorb(3) (t2g)d | [M(d)]+ ← (CO)8– σ-donation | –34.7 (21.7%) | –32.2 (20.1%) | –30.5 (24.4%) |
| ΔEorb(4) (a1g)d | [M(s)]+ ← (CO)8– σ-donation | –5.3 (3.3%) | –5.0 (3.1%) | –4.4 (3.5%) |
| ΔEorb(5) (t1u)d | [M(p)]+ ← (CO)8– σ-donation | –9.5 (5.9%) | –6.4 (4.0%) | –5.9 (4.7%) |
| ΔEorb(6) (a2u)d | (CO)8 polarization | –2.6 (1.6%) | –2.8 (1.7%) | –3.6 (2.9%) |
| ΔEorb(rest)d | –20.4 (12.7%) | –20.7 (12.9%) | –18.4 (14.7%) | |
For the group 2 complexes the EDA-NOCV results using the charged fragments M+, (CO)8– in their electronic doublet (D) state are also given. All energy values are given in kcal/mol.
The symmetry notations σ and π refer to the orbitals of the CO ligand and not to the symmetry of the complex.
The values in parentheses give the percentage contribution to the total attractive interactions ΔEelstat + ΔEorb.
The values in parentheses give the percentage contribution to the total orbital interactions ΔEorb.
The EDA-NOCV results for the group 10 complexes M(CO)4 (M = Ni, Pd, Pt) suggest that the orbital interactions are dominated by the M(d) → (CO)4 π-backdonation of the 2t2 and e orbitals. This is reasonable because the d10 configuration of the metal atoms has no vacant (n – 1)d AOs and there are only the (n)s and (n)p AOs as acceptor orbitals (see the correlation diagram Figure 3a). Note that the contribution of the M ← (CO)4 σ-donation clearly increases for the heavier metals Ni < Pd < Pt. Figure 5a,b shows the deformation densities Δρ1 and Δρ2 of Ni(CO)4, which are associated with the Ni → (CO)4 π-backdonation ΔEorb(1) and ΔEorb(2). The displayed charge flow red → blue nicely visualizes the direction of the charge migration. The figures show the sum of the three or two contributions of the degenerate deformation densities, the individual components are given in Figure S2 in the Supporting Information along with the deformation densities of the heavier systems, which look very similar. Note that the deformation densities Δρ1 and Δρ2 come from triply (Δρ1) and doubly (Δρ2) degenerate orbital interactions. The eigenvalues of the deformation densities υ, which show the size of the charge migration, are also given. We want to point out that there is no general correlation between the eigenvalues υi and the energies of the associated orbital interactions ΔEorb(i), which are also determined by the energy levels of the interacting orbitals.
Figure 5.

Plot of the deformation densities Δρ of the most important pairwise orbital interactions in the neutral carbonyl complexes M(CO)n using neutral fragments M and (CO)n in the electronic singlet state for (a,b) Ni(CO)4; (c–e) Fe(CO)5; (f,g) Cr(CO)6; (h,i) Ti(CO)8. Plot of the deformation densities Δρ of Ca(CO)8 using (j,k) neutral fragments Ca in the triplet state and (CO)8 in the singlet state and (m,n) charged fragments Ca+ and [(CO)8]− in the electronic doublet states. In the case of degenerate orbitals, the deformation densities indicate the sum of the charge shifts. The color code of the charge flow is red → blue. The eigenvalues |νx| give the size of the charge flow. aUsing neutral Ca in the triplet state and (CO)8 in the singlet state as interacting fragments. bUsing the charged species Ca+ and (CO)8– in the doublet states as interacting fragments.
The largest contributions to the orbital interactions in the group 8 complexes M(CO)5 (M = Fe, Ru, Os) come also from M(d) → (CO)5 π-backdonation of the e′ and e″ orbitals, but there is now significant M(d) ← (CO)5 σ-donation into a vacant (n – 1)d AO of the metals, which have a d8 electron configuration (Figure 3b). The contribution of the M ← (CO)5 σ-donation again increases for the heavier metals Fe < Ru < Os. Note that Figure 5c–e shows the deformation densities Δρ, which are associated with the Fe(d) → (CO)5 π-backdonation and the Fe(d) ← (CO)5 σ-donation in Fe(CO)5. The shape of the deformation densities Δρ1 and Δρ2 reveals that the strongest orbital interaction term ΔEorb(1) comes mainly from the π-backdonation into the three equatorial CO ligands whereas ΔEorb(2) is due to the π-backdonation into the two axial carbonyls. The relative strength of ΔEorb(1) and ΔEorb(2) is about 3/2, which is in agreement with the number of equatorial and axial CO ligands. The shape of Δρ and the individual components of the degenerate orbital interactions of all M(CO)5 complexes are shown in Figure S3 in the Supporting Information.
The M(d) → (CO)6 π-backdonation is still the strongest orbital interaction in the group 6 adducts M(CO)6 (M = Cr, Mo, W) where the metals have a d6 reference electron configuration (Figure 3c). The strength of the M(d) ← (CO)6 σ-donation becomes stronger compared with that in the group 8 complexes, because the metal atoms in M(CO)6 possess two vacant (n – 1)d AOs with σ symmetry (eg). Note that in all M(CO)n complexes the (n – 1)d AOs are much better acceptor orbitals than the (n)s and (n)p AOs. The associated charge flow of the most important orbital interactions in Cr(CO)6 is nicely illustrated by the deformation densities Δρ shown in Figure 5f,g. The shape of Δρ and the components of the degenerate orbital interactions of all M(CO)6 complexes are shown in Figure S4 in the Supporting Information.
The strongest contributions to the orbital interactions in the group 4 complexes M(CO)8 (M = Ti, Zr, Hf) come again from the M(d) → (CO)8 π-backdonation, but its percentage contribution to ΔEorb slightly increases relative to the group 6 carbonyls whereas the M(d) ← (CO)8 σ-donation has a smaller fraction, although there are now three vacant (n – 1)d AOs available as t2g acceptor orbitals (Figure 3d). This can be explained with the lower electronegativities of the group 4 than the group 6 metals, which hold particularly for the atoms of the fifth and sixth row (Table 2). But the gross electronegativity of the atom may not be sufficient to explain the trend of the donation and backdonation. Hinze and Jaffe pointed out in theoretical studies114−116 that “Electronegativity is the property, not of an atom, but of an orbital of an atom in its valence state.”106 It was also shown that the value of the orbital electronegativity strongly depends on the atomic valence state. The value for the vacant (n – 1)d AOs of the transition metals in the given reference state is not available. The EDA-NOCV results suggest that the electronegativity of the (n – 1)d AOs of the group 4 metals is significantly lower than those of the group 6 metals.
The deformation densities Δρ of the most important orbitals interactions of Ti(CO)8 are shown in Figure 5h,i. It may be tempting to correlate the eigenvalues of the deformation densities υk, which indicate the size of the charge donation and backdonation, with the frequency shifts of the CO stretching vibration Δυ. This is misleading for several reasons. First, the deformation densities υk are not a direct measure of the associated energies, which depend also on the energy levels of the orbitals. Second, the σ-donation has only a very small effect on the stretching vibration and the blue-shift of the nonclassical carbonyls is rather due to a polarization effect than to σ-donation.26,27 The shape of Δρ and the components of the degenerate orbital interactions of all group 4 M(CO)8 complexes are shown in Figure S5 in the Supporting Information.
Table 3 shows that the orbital interactions in the group 2 octacarbonyls M(CO)8 (M = Ca, Sr, Ba), which have an electronic triplet ground state (see the correlation diagram e in Figure 3), are dominated by the M(d) → (CO)8 π-backdonation, which contributes 86% to ΔEorb when M = Ca, Sr and 68% when M = Ba. We thought that the smaller value for Ba is a relativistic effect, because previous studies showed that relativity leads to a shrinking of the valence d orbitals, which makes them weaker donors but better acceptors.117−120 Therefore, we repeated the EDA-NOCV calculations of the complexes M(CO)8 (M = Ca, Sr, Ba), using neutral fragments without the ZORA approximation. It turned out that the total interaction energy ΔEint for the barium complex calculated at the nonrelativistic level is clearly smaller (−144.2 kcal/mol) than the relativistic value (−154.8 kcal/mol) but the percentage contributions of all energy components change very little. The contribution of Ba(d) → (CO)8 π-backdonation at the nonrelativistic level remains at 68% of ΔEorb. Thus, the percentage contribution of the M(d) ← (CO)8 σ-donation in Ba(CO)8 is clearly higher than in the lighter homologues. The nonrelativistic values are given in Table S1 in the Supporting Information.
The rather strong contribution ΔEorb(1), which comes from the M(d) → (CO)8 π-backdonation in the group 2 complexes, is remarkable, because there are only two valence electrons of the metal that are engaged in the interactions. Figure 5j,k shows the deformation densities associated with the strongest orbital terms ΔEorb(1) and ΔEorb(2) of Ca(CO)8 using neutral fragments. Note that the charge migration connected with the Ca(d) ← (CO)8 σ-donation is half as big as the Ca(d) → (CO)8 π-backdonation, although the energy contribution of the former is nearly 10 times stronger than the latter. Figure 5l–n depicts the deformation densities associated with the strongest orbital terms ΔEorb(1) – ΔEorb(3) of Ca(CO)8 using charged fragments. Since the group 2 octacarbonyls have only recently been observed and because their bonding situation is a topic of a controversial discussion, it is useful to inspect the orbitals which are associated with the π-backdonation and σ-donation. They are shown in Figure 6 for all components of the degenerate orbital interactions ΔEorb(1) (eg) and ΔEorb(2) (t2g) of Ca(CO)8.
Figure 6.

Plot of the individual components of the deformation densities Δρ and the associated orbitals of the fragments and complexes of the most important pairwise orbitals in Ca(CO)8 using neutral fragments Ca in the triplet state and (CO)8 in the singlet state as given in Table 3. (a) [Ca(3dx2–y2)] → (CO)8 π-backdonation; (b) [Ca(3dz2)] → (CO)8 π-backdonation; (c) Ca(3dxy) ← (CO)8 σ-donation; (d) Ca(3dxz) ← (CO)8 σ-donation; (e) Ca(3dyz) ← (CO)8 σ-donation. The color code of the charge flow in the deformation densities is red → blue. The eigenvalues |νx| give the size of the charge flow.
The shape of the interacting orbitals of the one-electron interactions ΔEorb(1) nicely reveals the backdonation from the singly occupied 3dx2–y2 AO (ΔEorb(1a)) and 3dz2 AO (ΔEorb(1b)) of Ca into the vacant π* LUMOs of (CO)8 that yield the degenerate SOMO of Ca(CO)8 in the Ca(d) → (CO)8 π-backdonation (Figure 6a,b). This is complemented by the three components of the Ca(d) ← (CO)8 σ-donation, which encompass the electron donation from the doubly occupied orbitals of the triply degenerate HOMO of (CO)8 into the vacant 3dxy, 3dxz, and 3dyz AOs of Ca (Figure 6c–e). Figure 6 strikingly demonstrates the transition-metal-like bonding scenario of calcium in Ca(CO)8. The analogous situation of the heavier alkaline earth atoms Sr and Ba in the octacarbonyls is shown in Figure S6 in the Supporting Information.
The deformation densities and orbitals shown in Figures 6 and S6 come from the interaction of the neutral fragments M and (CO)8 in the group 2 complexes M(CO)8 (M = Ca, Sr, Ba), which corresponds to the DCD model. Table 3 shows that the bonding situation in the eventually formed complexes is better described with the charged fragments M+ and (CO)8– in the doublet states. Figure 7 shows the deformation densities and the associated orbitals of the three most important orbital interactions ΔEorb(1) – ΔEorb(3) of Ca(CO)8 using the charged fragments Ca+ and (CO)8–. The shape of the fragment orbitals and the deformation densities exhibits again the dominant role of the 3d AOs of Ca in the covalent (orbital) interactions in the finally formed metal–CO bonds. The only major difference between the results using neutral and charged fragments is the direction of the charge flow that involves the 3dz2 AO of Ca, which is an acceptor orbital when charged fragments are used for the EDA-NOCV calculation (Figure 7b). But the results using neutral fragments give more insight into the interatomic interactions, because they consider all alterations that occur during bond formation. The very similar shapes of the deformation densities and the associated orbitals of the heavier homologues are shown in Figure S7 in the Supporting Information.
Figure 7.

Plot of the individual components of the deformation densities Δρ and the associated orbitals of the fragments and complexes of the most important pairwise orbitals in Ca(CO)8 using the charged fragments Ca+ and [(CO)8]− in the doublet states as given in Table 3. (a) [Ca(3dx2–y2)]+ → (CO)8– π-backdonation; (b) [Ca(3dz2)]+ ← (CO)8– π donation; (c) [Ca(dxy)]+ ← (CO)8– σ-donation; (d) [Ca(dxz)]+ ← (CO)8– σ-donation; (e) [Ca(dyz)]+ ← (CO)8– σ-donation. The color code of the charge flow in the deformation densities is red → blue. The eigenvalues |νx| give the size of the charge flow.
We analyzed the metal–CO interactions with the EDA-NOCV method of the positively and negatively charged hexacarbonyls [M(CO)6]q listed in Tables 1 and 2 and the group 3 octacarbonyl anions [M(CO)8]− (M = Sc, Y, La), which are experimentally known. The EDA-NOCV calculations were carried out using the charged metal ions Mq and the neutral carbonyl ligands (CO)n in the electronic singlet states, which follows the DCD bonding model. The numerical results are shown in Table 4. The vertical ordering facilitates the comparison of the isoelectronic systems and the trends of the calculated values.
Table 4. Numerical EDA-NOCV Results of the Charged Carbonyl Complexes [M(CO)n]q at the M06/TZ2P//M06-D3/def2-TZVPP Level Using the Charged Metals Mq and Neutral (CO)n in Their Electronic Singlet (S) State as Interacting Moietiesa.
| orbital interactionb | interacting fragments | |||
|---|---|---|---|---|
| [Ir(CO)6]3+ | ||||
| Ir3+ (S) + (CO)6 (S) | ||||
| ΔEint | –718.0 | |||
| ΔEmetahybrid | 105.8 | |||
| ΔEPauli | 405.4 | |||
| ΔEelstatd | –334.2 (27.2%) | |||
| ΔEorbd | –894.9 (72.8%) | |||
| ΔEorb(1) (t2g)e | [M(d)] → (CO)6 π-backdonation | –70.4 (7.9%) | ||
| ΔEorb(2) (eg)e | [M(d)] ← (CO)6 σ-donation | –500.4 (55.9%) | ||
| ΔEorb(3) (a1g)e | [M(s)] ← (CO)6 σ-donation | –73.8 (8.2%) | ||
| ΔEorb(4) (t1u)e | [M(p)] ← (CO)6 σ-donation | –105.2 (11.8%) | ||
| ΔEorb(rest)e | –145.1 (16.2%) | |||
| [M(CO)6]2+ | ||||
| Fe2+ (S) + (CO)6 (S) | Ru2+ (S) + (CO)6 (S) | Os2+ (S) + (CO)6 (S) | ||
| ΔEint | –398.1 | –415.2 | –469.3 | |
| ΔEmetahybrid | 84.5 | 78.2 | 89.1 | |
| ΔEPauli | 286.5 | 384.7 | 428.4 | |
| ΔEelstatd | –202.5 (26.3%) | –283.5 (32.3%) | –341.0 (34.6%) | |
| ΔEorbd | –566.6 (73.7%) | –594.6 (67.7%) | –645.8 (65.4%) | |
| ΔEorb(1) (t2g)e | [M(d)] → (CO)6 π-backdonation | –92.4 (16.3%) | –92.5 (15.6%) | –111.1 (17.2%) |
| ΔEorb(2) (eg)e | [M(d)] ← (CO)6 σ-donation | –302.0 (53.3%) | –340.3 (57.2%) | –339.3 (52.5%) |
| ΔEorb(3) (a1g)e | [M(s)] ← (CO)6 σ-donation | –30.9 (5.5%) | –29.2 (4.9%) | –46.2 (7.2%) |
| ΔEorb(4) (t1u)e | [M(p)] ← (CO)6 σ-donation | –68.7 (12.1%) | –56.3 (9.5%) | –63.4 (9.8%) |
| ΔEorb(rest)e | –72.6 (12.8%) | –76.3 (12.8%) | –85.8 (13.3%) | |
| [M(CO)6]+ | ||||
| Mn+ (S) + (CO)6 (S) | Tc+ (S) + (CO)6 (S) | Re+ (S) + (CO)6 (S) | ||
| ΔEint | –303.2 | –317.1 | –391.4 | |
| ΔEmetahybrid | 73.8 | 67.7 | 69.2 | |
| ΔEPauli | 316.0 | 398.2 | 434.9 | |
| ΔEelstatd | –235.2 (33.9%) | –301.5 (38.5%) | –359.6 (40.2%) | |
| ΔEorbd | –457.7 (66.1%) | –481.5 (61.5%) | –535.9 (59.8%) | |
| ΔEorb(1) (t2g)e | [M(d)] → (CO)6 π-backdonation | –180.0 (39.3%) | –174.1 (36.2%) | –191.4 (35.7%) |
| ΔEorb(2) (eg)e | [M(d)] ← (CO)6 σ-donation | –196.1 (42.8%) | –225.6 (46.9%) | –235.1 (43.9%) |
| ΔEorb(3) (a1g)e | [M(s)] ← (CO)6 σ-donation | –14.3 (3.1%) | –15.4 (3.2%) | –28.0 (5.2%) |
| ΔEorb(4) (t1u)e | [M(p)] ← (CO)6 σ-donation | –32.7 (7.1%) | –29.0 (6.0%) | –34.7 (6.5%) |
| ΔEorb(rest)e | –34.6 (7.6%) | –37.4 (7.8%) | –46.7 (8.7%) | |
| [M(CO)6]− | ||||
| V– (S) + (CO)6 (S) | Nb– (S) + (CO)6 (S) | Ta– (S) + (CO)6 (S) | ||
| ΔEint | –523.4 | –402.9 | –473.7 | |
| ΔEmetahybrid | 30.2 | 42.8 | 32.7 | |
| ΔEPauli | 318.6 | 373.6 | 390.6 | |
| ΔEelstatd | –328.4 (37.7%) | –333.8 (40.7%) | –384.7 (42.9%) | |
| ΔEorbd | –543.8 (62.3%) | –485.5 (59.3%) | –512.3 (57.1%) | |
| ΔEorb(1) (t2g)e | [M(d)] → (CO)6 π-backdonation | –448.7 (82.5%) | –346.6 (71.4%) | –349.5 (68.2%) |
| ΔEorb(2) (eg)e | [M(d)] ← (CO)6 σ-donation | –82.8 (15.2%) | –109.1 (22.5%) | –118.3 (23.1%) |
| ΔEorb(3) (a1g)e | [M(s)] ← (CO)6 σ-donation | –0.5 (0.1%) | –5.4 (1.1%) | –12.3 (2.4%) |
| ΔEorb(4) (t1u)e | [M(p)] ← (CO)6 σ-donation | 1.4c (−0.3%) | –8.2 (1.7%) | –11.3 (2.2%) |
| ΔEorb(rest)e | –13.2 (2.4%) | –16.2 (3.3%) | –20.9 (4.1%) | |
| [Hf(CO)6]2– | ||||
| Hf2– (S) + (CO)6 (S) | ||||
| ΔEint | –490.4 | |||
| ΔEmetahybrid | 39.3 | |||
| ΔEPauli | 317.2 | |||
| ΔEelstatd | –343.0 (40.5%) | |||
| ΔEorbd | –503.9 (59.5%) | |||
| ΔEorb(1)(t2g)e | [M(d)] → (CO)6 π-backdonation | –373.9 (74.2%) | ||
| ΔEorb(2) (eg)e | [M(d)] ← (CO)6 σ-donation | –82.8 (16.4%) | ||
| ΔEorb(3) (a1g)e | [M(s)] ← (CO)6 σ-donation | –11.0 (2.2%) | ||
| ΔEorb(4) (t1u)e | [M(p)] ← (CO)6 σ-donation | –9.9 (2.0%) | ||
| ΔEorb(rest)e | –26.3 (5.2%) | |||
| [M(CO)8]− | ||||
| Sc– (S) + (CO)8 (S) | Y– (S) + (CO)8 (S) | La– (S) + (CO)8 (S) | ||
| ΔEint | –438.3 | –346.4 | –279.9 | |
| ΔEmetahybrid | 21.2 | 38.9 | 43.5 | |
| ΔEPauli | 140.0 | 169.8 | 154.6 | |
| ΔEelstatd | –200.0 (33.3%) | –199.1 (35.9%) | –175.0 (36.6%) | |
| ΔEorbd | –399.8 (66.7%) | –356.0 (64.1%) | –303.0 (63.4%) | |
| ΔEorb(1) (eg)e | [M(d)] → (CO)8 π-backdonation | –332.1 (83.1%) | –267.5 (75.1%) | –224.2 (74.0%) |
| ΔEorb(2) (t2g)e | [M(d)] ← (CO)8 σ-donation | –48.9 (12.2%) | –59.3 (16.7%) | –48.3 (15.9%) |
| ΔEorb(3) (a1g)e | [M(s)] ← (CO)8 σ-donation | –2.0 (0.5%) | –4.7 (1.3%) | –3.5 (1.2%) |
| ΔEorb(4) (t1u)e | [M(p)] ← (CO)8 σ-donation | –2.4 (0.6%) | –6.1 (1.7%) | –5.2 (1.7%) |
| ΔEorb(rest)e | –14.4 (3.6%) | –18.4 (5.2%) | –21.8 (7.2%) | |
| M(CO)2 | ||||
| Ca (S) + (CO)2 (S) | Sr (S) + (CO)2 (S) | Ba (S) + (CO)2 (S) | ||
| ΔEint | –151.3 | –147.6 | –67.0 | |
| ΔEmetahybrid | 12.3 | 10.7 | 17.1 | |
| ΔEPauli | 50.1 | 46.2 | 44.0 | |
| ΔEelstatd | –44.9 (21.0%) | –38.4 (18.8%) | –40.2 (31.4%) | |
| ΔEorbd | –168.8 (79.0%) | –166.0 (81.2%) | –87.9 (68.6%) | |
| ΔEorb(1)e | [M(d)] → (CO)2 π-backdonation | –150.6 (89.2%) | –150.5 (90.7%) | –66.0 (75.1%) |
| ΔEorb(2)e | [M(d)] ← (CO)2 σ-donation | –11.4 (6.8%) | –10.0 (6.0%) | –12.5 (14.2%) |
| ΔEorb(3)e | [M(p)] ← (CO)2 σ-donation | –1.6 (0.9%) | –0.8 (0.5%) | –2.9 (3.3%) |
| ΔEorb(rest)e | –5.2 (3.1%) | –4.7 (2.8%) | –6.5 (7.4%) | |
| Ca+ (D) + (CO)−2 (D) | Sr+ (D) + (CO)−2(D) | Ba+ (D) + (CO)−2 (D) | ||
| ΔEint | –188.2 | –185.0 | –161.2 | |
| ΔEmetahybrid | 0.8 | 1.7 | 5.8 | |
| ΔEPauli | 62.9 | 56.8 | 50.6 | |
| ΔEelstatd | –169.7 (67.4%) | –159.1 (65.3%) | –149.9 (68.9%) | |
| ΔEorbd | –82.1 (32.6%) | –84.4 (34.7%) | –67.6 (31.1%) | |
| ΔEorb(1)e | [M(d)] → (CO)2 π-backdonation | –55.3 (67.4%) | –60.7 (71.9%) | –43.7 (64.6%) |
| ΔEorb(2)e | [M(d)] ← (CO)2 σ-donation | –15.5 (18.9%) | –13.9 16.5%) | –14.1 (20.9%) |
| ΔEorb(3)e | [M(p)] ← (CO)2 σ-donation | –3.5 (4.3%) | –2.7 (3.2%) | –3.2 (4.7%) |
| ΔEorb(rest)e | –7.8 (9.5%) | –7.1 (8.4%) | –6.6 (9.8%) | |
| [Ba(CO)]•+ | ||||
| Ba+ (D) + (CO) (S) | ||||
| ΔEint | –21.2 | |||
| ΔEmetahybrid | 7.4 | |||
| ΔEPauli | 32.0 | |||
| ΔEelstatd | –22.2 (36.6%) | |||
| ΔEorbd | –38.4 (63.4%) | |||
| ΔEorb(1)e | [M(d)] → (CO) π-backdonation | –20.3 (52.9%) | ||
| ΔEorb(2)e | [M(d)] ← (CO) σ-donation | –13.2 (34.4%) | ||
| ΔEorb(rest)e | –4.9 (12.8%) | |||
Results of the neutral alkaline earth dicarbonyls M(CO)2 using neutral and charged fragments in their singlet (S) or doublet (D) states. All energy values are given in kcal/mol.
The symmetry notations σ and π refer to the orbitals of the CO ligand and not to the symmetry of the complex.
The small positive value is due to a polarization of the orbital charge.
The values in parentheses give the percentage contribution to the total attractive interactions ΔEelstat + ΔEorb.
The values in parentheses give the percentage contribution to the total orbital interactions ΔEorb.
The most important data for the topic of this work is the contribution of the [M(d)]q → (CO)n π-backdonation to the total orbital interactions ΔEorb. Table 4 shows that there is a continuous increase in the strength and percentage contribution of the π-backdonation for the series of row 4 [Fe(CO)6]2+ < [Mn(CO)6]+ < Cr(CO)6 < V(CO)6]−, row 5 [Ru(CO)6]2+ < [Tc(CO)6]+ < Mo(CO)6 < Nb(CO)6]− and row 6 [Ir(CO)6]3+ < [Os(CO)6]2+ < [Re(CO)6]+ < W(CO)6 < Ta(CO)6]− < Hf(CO)6]2– (for the neutral complexes, see Table 3). The [M(d)]q → (CO)n π-backdonation in the anions [M(CO)8]− (M = Sc, Y, La) is as expected stronger than in the isoelectronic neutral complexes [M(CO)8] (M = Ti, Zr, Hf). The DCD model is quantitatively supported by the numerical results of the EDA-NOCV calculations. The associated deformation densities exhibit the expected shapes. They are shown in Figure S8 in the Supporting Information.
Table 4 shows also the numerical results of the EDA-NOCV calculations of the alkaline earth dicarbonyls M(CO)2 (M = Ca, Sr, Ba) using neutral and charged fragments as interacting moieties and the experimentally observed [Ba(CO)]•+. The dicarbonyls have been calculated as model compounds in order to examine the suggestion that the red-shift of the alkaline earth octacarbonyls M(CO)8 (M = Ca, Sr, Ba) comes from interligand interaction between neighboring CO ligands rather than from M → (CO)8 π-backdonation.51 The trans-relative position in the linear dicarbonyls, which are minima on the potential energy surface,121 effectively precludes a direct interaction between the CO ligands. The EDA-NOCV data in Table 4 show that the orbital interactions in M(CO)2 are in the same way dominated by M → (CO) π-backdonation as in the octacarbonyls M(CO)8. This is equally true for the calculations with neutral and charged fragments. Note that the π-backdonation in the dicarbonyls is distributed over only two CO ligands whereas it covers eight CO ligands in the octacarbonyls. This explains why the red-shift of the C–O stretching frequencies in M(CO)2 is much larger than in M(CO)8 (Table 1). Table 4 shows that the largest contribution to the orbital interactions even in the radical cation [Ba(CO)]•+ comes from Ba+ → (CO) π-backdonation. This has been discussed in detail before.110 The EDA-NOCV results clearly show that the red-shift in the alkaline earth octacarbonyls M(CO)8 (M = Ca, Sr, Ba) comes from M → (CO)8 π-backdonation. The deformation densities of the orbital interaction in M(CO)2 and [Ba(CO)]•+ are shown in Figure S9 in the Supporting Information.
Discussion
The results of this work show the insight which one can gain into the electronic structure and bonding situation of molecules using modern methods of quantum chemistry. At the same time, it becomes clear that one should not blindly use a single method for a bonding analysis. Each approach is based on a model, which in turn is subject to assumptions and coding algorithms, the results of which may be biased by the viewpoint of the creator of the method. It is important to know the basic assumptions and details of a method in order to understand the results. Models are not right or wrong; they are more or less useful. The usefulness of a model comes from its ability to explain experimental observations in a consistent way. This was nicely expressed by Michael Dewar who wrote in 1984 “The only criterion of a model is usefulness, not its “truth.”122 It is advisable to employ different methods for the analysis of the electronic structure of molecules and to compare the results with each other before a conclusion about the nature of the interatomic interactions is made. A mere correlation is not an explanation.
The analysis of the metal–CO interactions in the neutral and charged carbonyl complexes M(CO)n using a variety of methods indicates that the DCD model in terms of M ← CO σ-donation and M → CO π-backdonation is a valid approach to explain the bonding situation and the trend of the CO stretching frequencies. This includes the heavier alkaline earth octacarbonyls M(CO)8 (M = Ca, Sr, Ba) which have cubic (Oh) symmetry and an electronic triplet ground state. An important aspect of this work concerns the change in the polarity of the M–CO bonds, which must be considered to understand the experimentally observed red-shift of the stretching vibration. The physical origin of polar covalent bonds is the interference of the wave functions where the electropositive part delivers electronic charge to the electronegative end. This mechanism becomes particularly strong in the formation of the M–CO π bonds of the heavier alkaline earth octacarbonyls. Here, the valence d orbitals of the metal atoms in M(CO)8 serve as a vehicle for the charge migration from the metal to the CO ligands. This becomes evident by the dominant contribution of [M(d)] → (CO)8 π-backdonation to the orbital (covalent) interaction ΔEorb between the neutral fragments, which is the largest stabilizing term in the octacarbonyls (Table 3). The charge migration leads to a change in the composition of the M–CO bonds in the finally formed molecules where the electrostatic term ΔEelstat becomes equally important as ΔEorb when the charged fragments are used. The large polarization of the Ca-CO bonds becomes apparent through the AdNDP orbitals of Ca(CO)8 where the Ca d AOs account for only 12% of the π orbital. The large polarization of the M–CO π orbitals toward the CO end and the population of their π* orbital lead to comparatively small values for the delocalization indices δ(M–C) and δ(M···O) and to a significant overlap between adjacent CO groups. But this must not be taken as evidence for the lack of [M(d)] → (CO)8 π-backdonation, which remains the driving force for the charge migration toward CO even in the group 2 carbonyls. This becomes evident by the calculated results for M(CO)2 (M = Ca, Sr, Ba) and [Ba(CO)]•+.
The preference of s/d hybridization over s/p hybridization in covalent bonding of the heavier alkaline earth atoms M = Ca, Sr, Ba can be explained with the energy levels of the atomic orbitals of the metals. Figure 8 shows the experimental excitation energies of the ground and lowest lying excited states of M and M+. The first excited state of neutral Ca and Sr is 3P with the electron configuration (n)s1(n)p1, whereas for Ba it is 3D with the electron configuration (n)s1(n – 1)d1. This is one reason why barium was previously termed as “honorary transition metal” by Pyykkö.123 But the electropositive alkaline earth atoms usually carry a positive charge and the bonding interactions in the molecules are best described in most cases with M+ as interacting species as shown by the EDA-NOCV results for M(CO)8. Figure 8 shows that the first excited states of the alkaline earth ions M+ is the 2D state where the (n – 1)d AO is occupied. The excitation energy 2S → 2D is very low and much lower than the excitation energy of carbon from the 3P(2s22p2) ground state to the 5S(2s12p3) valence state in C(IV).124 Since the (n – 1)d AO of the alkaline earth atoms is much more diffuse than the (n)s AO, the hybrid orbital of M+ is composed in molecular orbitals mainly by the (n – 1)d AOs, which have a larger extension and overlap with orbitals of the atoms to which M+ is bonded. This was found in our previous study of the valence orbitals of the group 2 atoms45 and in earlier studies by Pyykkö, who analyzed the bonds in several small molecules of the alkaline earth atoms and concluded “We have presented explicit evidence for a considerable d character in the bonding of the heavier group IIa elements. This d character increases from Ca to Sr and, markedly, in Ba.”125 Similar findings about the relevance of d orbitals of the heavy alkaline earth elements were stated in review articles by Kaupp.126,127
Figure 8.

Energy levels of the three energetically lowest-lying electronic states of neutral alkaline earth atoms Ca, Sr, Ba and the cations Ca+, Sr+, Ba+, The values are taken from ref (124).
The findings in this work as well as in earlier studies by us39−41,44,45,47,49,110 and by others75,123,125−127 allow us to suggest that the heavier alkaline earth atoms M = Ca, Sr, Ba should no longer be classified as main-group atoms in the periodic table of the elements, ordered according to the valence orbitals in covalent bonding, but as transition metals. A modified version proposed by us is shown in Figure 9. It better reflects the actual use of the atomic orbitals of the atoms in the molecular chemical bond.
Figure 9.

Proposed revised periodic table of the elements where the heavy alkaline earth metals Ca, Sr, Ba are assigned as transition metals.
We want to point out that the bonding situation in carbonyl complexes was the topic of other recent work using different approaches.128−131 Our results complement these studies and they contribute to a better understanding of the metal–CO interactions.
Summary and Conclusion
The results of this work are summarized as follows. The DCD model in terms of M ← CO σ-donation and M → CO π-backdonation is a valid approach to explain the bonding situation and the trend of the CO stretching frequencies in neutral and charged carbonyl complexes [M(CO)n]q where M is an atom of rows 3, 4, and 5 of groups 2–10. The carbonyl ligands of the neutral complexes carry a negative charge, and the polarity of the M–CO bonds increases for the less electronegative metals, which is particularly strong for the group 4 and group 2 atoms. The NBO method yields an unrealistic charge distribution in the carbonyl complexes, while the AIM approach yields physically reasonable partial charges that are consistent with the EDA-NOCV calculations and with the trend of the C–O stretching frequencies. The AdNDP method gives delocalized MOs which are very useful models for understanding the bonding situation in the carbonyl complexes. Deep insight into the nature of the metal–CO bonds and quantitative information about the strength of the [M] ← (CO)8 σ-donation and [M(d)] → (CO)8 π-backdonation visualized by the deformation densities are provided by the EDA-NOCV method. The large polarity of the M–CO π orbitals toward the CO end in the alkaline earth octacarbonyls M(CO)8 (M = Ca, Sr, Ba) leads to small values for the delocalization indices δ(M–C) and δ(M···O) and significant overlap between adjacent CO groups, but the origin of the charge migration and the associated red-shift of the C–O stretching frequencies is the [M(d)] → (CO)8 π-backdonation. The heavier alkaline metals calcium, strontium, and barium use their s/d valence orbitals for covalent bonding. They are therefore to be assigned as electropositive transition metals extending the trend with reactivities closely related to the group 3 and 4 metals.
Acknowledgments
This work was supported by the Deutsche Forschungsgemeinschaft and by the Spanish Ministerio de Ciencia e Innovación (MICIIN) (PID2019-106184GB-I00 and RED2018-102387-T). G.F. expresses his gratitude to Prof. W. H. E. Schwarz for very helpful discussions on the nature of the chemical bond.
Supporting Information Available
The Supporting Information is available free of charge at https://pubs.acs.org/doi/10.1021/jacsau.1c00106.
AdNDP σ orbitals and further deformation densities; nonrelativistic EDA-NOCV results for M(CO)8 (M = Ca, Sr, Ba) (PDF)
The authors declare no competing financial interest.
Dedication
This work is dedicated to the memory of Ronald Gillespie.
Supplementary Material
References
- Elschenbroich C.Organometallics, 3rd ed.; Wiley-VCH: Weinheim, 2006. [Google Scholar]
- Crabtree R. H.The Organometallic Chemistry of the Transition Metals, 6th ed.; Verlag John Wiley & Sons, 2014. [Google Scholar]
- Unkrig W.; Kloiber K.; Butschke B.; Kratzert D.; Krossing I. Altering Charges on Heterobimetallic Transition-Metal Carbonyl Clusters. Chem. - Eur. J. 2020, 26, 12373–12381. 10.1002/chem.202002339. [DOI] [PMC free article] [PubMed] [Google Scholar]
- Unkrig W.; Schmitt M.; Kratzert D.; Himmel D.; Krossing I. Synthesis and characterization of crystalline niobium and tantalum carbonyl complexes at room temperature. Nat. Chem. 2020, 12, 647–653. 10.1038/s41557-020-0487-3. [DOI] [PubMed] [Google Scholar]
- Bohnenberger J.; Schmitt M.; Feuerstein W.; Krummenacher I.; Butschke B.; Czajka J.; Malinowski P. J.; Breher F.; Krossing I. Completing the triad: synthesis and full characterization of homoleptic and heteroleptic carbonyl and nitrosyl complexes of the group VI metals. Chem. Sci. 2020, 11, 3592–3603. 10.1039/C9SC06445A. [DOI] [PMC free article] [PubMed] [Google Scholar]
- Bohnenberger J.; Feuerstein W.; Himmel D.; Daub M.; Breher F.; Krossing I. Stable salts of the hexacarbonyl chromium (I) cation and its pentacarbonyl-nitrosyl chromium (I) analogue. Nat. Commun. 2019, 10, 624. 10.1038/s41467-019-08517-2. [DOI] [PMC free article] [PubMed] [Google Scholar]
- Zhou M. F.; Andrews L.; Bauschlicher C. W. Spectroscopic and Theoretical Investigations of Vibrational Frequencies in Binary Unsaturated Transition-Metal Carbonyl Cations, Neutrals, and Anions. Chem. Rev. 2001, 101, 1931–1962. 10.1021/cr990102b. [DOI] [PubMed] [Google Scholar]
- Willner H.; Aubke F. σ-Bonded metal carbonyl cations and their derivatives: Syntheses and structural, spectroscopic, and bonding principles. Organometallics 2003, 22, 3612–3633. 10.1021/om030312l. [DOI] [Google Scholar]
- Xu Q. Metal carbonyl cations: generation, characterization and catalytic application. Coord. Chem. Rev. 2002, 231, 83–108. 10.1016/S0010-8545(02)00115-7. [DOI] [Google Scholar]
- Willner H.; Aubke F. Homoleptic Metal Carbonyl Cations of the Electron-Rich Metals: Their Generation in Superacid Media Together with Their Spectroscopic and Structural Characterization. Angew. Chem., Int. Ed. Engl. 1997, 36, 2402–2425. 10.1002/anie.199724021. [DOI] [Google Scholar]
- Ricks A. M.; Reed Z. E.; Duncan M. A. Infrared spectroscopy of mass-selected metal carbonyl cations. J. Mol. Spectrosc. 2011, 266, 63–74. 10.1016/j.jms.2011.03.006. [DOI] [Google Scholar]
- Wang G. J.; Zhou M. F. Infrared Spectra, Structures and Bonding of Binuclear Transition Metal Carbonyl Cluster Ions. Chin. J. Chem. Phys. 2018, 31, 1–11. 10.1063/1674-0068/31/cjcp1710192. [DOI] [Google Scholar]
- Ellis J. E. Metal Carbonyl Anions: from [Fe(CO)4]2- to [Hf(CO)6]2- and Beyond. Organometallics 2003, 22, 3322–3338. 10.1021/om030105l. [DOI] [Google Scholar]
- Beck W. Highly-Reduced Metal Carbonyls. Angew. Chem., Int. Ed. Engl. 1991, 30, 168–169. 10.1002/anie.199101681. [DOI] [Google Scholar]
- Cornils B., Herrmann W. A., Beller M., Paciello R., Eds. Applied Homogeneous Catalysis with Organometallic Compounds, 3rd. ed.; Wiley-VCH: Weinheim, 2017. [Google Scholar]
- Bochmann M.Organometallics and Catalysis; Oxford University Press: Oxford, 2015. [Google Scholar]
- Steinborn D.Fundamentals of Organometallic Catalysis; Wiley-VCH: Weinheim, 2011. [Google Scholar]
- Colacot T., Seechurn C. J., Grubbs R. H., Eds. Organometallic Chemistry in Industry: A Practical Approach; Wiley-VCH: Weinheim, 2020. [Google Scholar]
- Monney A.; Albrecht M. Transition metal bioconjugates with an organometallic link between the metal and the biomolecular scaffold. Coord. Chem. Rev. 2013, 257, 2420–2433. 10.1016/j.ccr.2012.12.015. [DOI] [Google Scholar]
- Dewar M. J. S. A review of the pi-complex theory. Bull. Soc. Chim. Fr. 1951, 18, C79. [Google Scholar]
- Chatt J.; Duncanson L. A. 586. Olefin co-ordination compounds. Part III. Infra-red spectra and structure: attempted preparation of acetylene complexes. J. Chem. Soc. 1953, 2939–2947. 10.1039/jr9530002939. [DOI] [Google Scholar]
- Frenking G.; Fröhlich N. The nature of the bonding in transition-metal compounds. Chem. Rev. 2000, 100, 717–774. 10.1021/cr980401l. [DOI] [PubMed] [Google Scholar]
- Frenking G. Understanding the nature of the bonding in transition metal complexes: from Dewar’s molecular orbital model to an energy partitioning analysis of the metal-ligand bond. J. Organomet. Chem. 2001, 635, 9–23. 10.1016/S0022-328X(01)01154-8. [DOI] [Google Scholar]
- Lupinetti A. J.; Frenking G.; Strauss S. H. Nonclassical Metal Carbonyls: Appropriate Definitions with a Theoretical Justification. Angew. Chem., Int. Ed. 1998, 37, 2113–2116. . [DOI] [PubMed] [Google Scholar]
- Lupinetti A. J.; Strauss S. H.; Frenking G. Nonclassical metal carbonyls. Prog. Inorg. Chem. 2007, 49, 1–112. 10.1002/9780470166512.ch1. [DOI] [PubMed] [Google Scholar]
- Goldman A. S.; Krogh-Jespersen K. Why Do Cationic Carbon Monoxide Complexes Have High C-O Stretching Force Constants and Short C-O Bonds? Electrostatic Effects, Not σ-Bonding. J. Am. Chem. Soc. 1996, 118, 12159–12166. 10.1021/ja960876z. [DOI] [Google Scholar]
- Lupinetti A. J.; Fau S.; Frenking G.; Strauss S. H. Theoretical analysis of the bonding between CO and positively charged atoms. J. Phys. Chem. A 1997, 101, 9551–9559. 10.1021/jp972657l. [DOI] [Google Scholar]
- Langmuir I. Types of valence. Science 1921, 54, 59–67. 10.1126/science.54.1386.59. [DOI] [PubMed] [Google Scholar]
- Rundle R. E. Electron Deficient Compounds. J. Am. Chem. Soc. 1947, 69, 1327–1331. 10.1021/ja01198a028. [DOI] [Google Scholar]
- Hach R. J.; Rundle R. E. The Structure of Tetramethylammonium Pentaiodide. J. Am. Chem. Soc. 1951, 73, 4321–4324. 10.1021/ja01153a086. [DOI] [Google Scholar]
- Rundle R. E. On the Problem Structure of XeF4 and XeF2. J. Am. Chem. Soc. 1963, 85, 112–113. 10.1021/ja00884a026. [DOI] [Google Scholar]
- Pimentel G. C. The bonding of trihalide and bifluoride ions by the molecular orbital method. J. Chem. Phys. 1951, 19, 446–448. 10.1063/1.1748245. [DOI] [Google Scholar]
- Albright T. A.; Burdett J. K.; Whangbo M.-H.. Orbital Interactions in Chemistry, Second ed.; Wiley: New York, 2013. [Google Scholar]
- Zhao L.; Pan S.; Holzmann N.; Schwerdtfeger P.; Frenking G. Chemical bonding and bonding models of main-group compounds. Chem. Rev. 2019, 119, 8781–8845. 10.1021/acs.chemrev.8b00722. [DOI] [PubMed] [Google Scholar]
- Luo Q.; Li Q. S.; Yu Z. H.; Xie Y. M.; King R. B.; Schaefer H. F. III Bonding of Seven Carbonyl Groups to a Single Metal Atom: Theoretical Study of M(CO)n (M = Ti, Zr, Hf; n = 7, 6, 5, 4). J. Am. Chem. Soc. 2008, 130, 7756–7765. 10.1021/ja8003655. [DOI] [PubMed] [Google Scholar]
- Deng G. H.; Lei S. J.; Pan S.; Jin J. Y.; Wang G. J.; Zhao L.; Zhou M. F.; Frenking G. Filling a Gap: The Coordinatively Saturated Group 4 Carbonyl Complexes TM(CO)8 (TM = Zr, Hf) and Ti(CO)7. Chem. - Eur. J. 2020, 26, 10487–10500. 10.1002/chem.201905552. [DOI] [PMC free article] [PubMed] [Google Scholar]
- Hoffmann R.; Howell J. M.; Muetterties E. L. Molecular Orbital Theory of Pentacoordinate Phosphorus. J. Am. Chem. Soc. 1972, 94, 3047–3058. 10.1021/ja00764a028. [DOI] [Google Scholar]
- Lein M.; Frenking G. Chemical Bonding in Octahedral XeF6 and SF6. Aust. J. Chem. 2004, 57, 1191–1195. 10.1071/CH04113. [DOI] [Google Scholar]
- Wu X.; Zhao L.; Jin J. Y.; Pan S.; Li W.; Jin X. Y.; Wang G. J.; Zhou M. F.; Frenking G. Observation of alkaline earth complexes M(CO)8 (M = Ca, Sr, or Ba) that mimic transition metals. Science 2018, 361, 912–916. 10.1126/science.aau0839. [DOI] [PubMed] [Google Scholar]
- Wang Q.; Pan S.; Lei S. J.; Jin J. Y.; Deng G. H.; Wang G. J.; Zhao L.; Zhou M. F.; Frenking G. Octa-coordinated alkaline earth metal-dinitrogen complexes M(N2)8 (M = Ca, Sr, Ba). Nat. Commun. 2019, 10, 3375–3383. 10.1038/s41467-019-11323-5. [DOI] [PMC free article] [PubMed] [Google Scholar]
- Wang Q.; Pan S.; Wu Y. B.; Deng G. H.; Bian J. H.; Wang G. J.; Zhao L.; Zhou M. F.; Frenking G. Transition-Metal Chemistry of Alkaline-Earth Elements: The Trisbenzene Complexes M(Bz)3 (M = Sr, Ba). Angew. Chem., Int. Ed. 2019, 58, 17365–17374. 10.1002/anie.201908572. [DOI] [PMC free article] [PubMed] [Google Scholar]
- Schorpp M.; Krossing I. Soft interactions with hard Lewis acids: generation of mono- and dicationic alkaline-earth metal arene-complexes by direct oxidation. Chem. Sci. 2020, 11, 2068–2076. 10.1039/C9SC06254H. [DOI] [PMC free article] [PubMed] [Google Scholar]
- Dabringhaus P.; Schorpp M.; Scherer H.; Krossing I. A Highly Lewis Acidic Strontium ansa-Arene Complex for Lewis Acid Catalysis and Isobutylene Polymerization. Angew. Chem., Int. Ed. 2020, 59, 22023–22027. 10.1002/anie.202010019. [DOI] [PMC free article] [PubMed] [Google Scholar]
- Bettens T.; Pan S.; De Proft F.; Frenking G.; Geerlings P. Alkaline Earth Metals Activate N2 and CO in Cubic Complexes Just Like Transition Metals: A Conceptual Density Functional Theory and Energy Decomposition Analysis Study. Chem. - Eur. J. 2020, 26, 12785–12793. 10.1002/chem.202001585. [DOI] [PMC free article] [PubMed] [Google Scholar]
- Fernández I.; Holzmann N.; Frenking G. The Valence Orbitals of the Alkaline-Earth Atoms. Chem. - Eur. J. 2020, 26, 14194–14210. 10.1002/chem.202002986. [DOI] [PMC free article] [PubMed] [Google Scholar]
- Landis C. R.; Hughes R. P.; Weinhold F. Comment on “Observation of alkaline earth complexes M(CO)8 (M = Ca, Sr, or Ba) that mimic transition metals. Science 2019, 365, eaay2355. 10.1126/science.aay2355. [DOI] [PubMed] [Google Scholar]
- Zhao L.; Pan S.; Zhou M. F.; Frenking G. Response to Comment on “Observation of alkaline earth complexes M(CO)8 (M = Ca, Sr, or Ba) that mimic transition metals. Science 2019, 365, eaay5021. 10.1126/science.aay5021. [DOI] [PubMed] [Google Scholar]
- Koch D.; Chen Y.; Golub P.; Manzhos S. Revisiting π backbonding: the influence of d orbitals on metal-CO bonds and ligand red shifts. Phys. Chem. Chem. Phys. 2019, 21, 20814–20821. 10.1039/C9CP04624K. [DOI] [PubMed] [Google Scholar]
- Pan S.; Frenking G. Comment on “Revisiting π backbonding: the influence of d orbitals on metal-CO bonds and ligand red shifts: by D. Koch, Y. Chen, P. Golub and S. Manzhos, Phys. Chem. Chem. Phys., 2019, 21, 20814. Phys. Chem. Chem. Phys. 2020, 22, 5377–5379. 10.1039/C9CP05951B. [DOI] [PubMed] [Google Scholar]
- Koch D.; Chen Y.; Golub P.; Manzhos S. Reply to the ‘Comment on “Revisiting π backbonding: the influence of d orbitals on metal-CO bonds and ligand red shifts”’ by G. Frenking and S. Pan. Phys. Chem. Chem. Phys. 2020, 22, 5380–5382. 10.1039/C9CP06927E. [DOI] [PubMed] [Google Scholar]
- Van der Maelen J. F. Topological Analysis of the Electron Density in the Carbonyl Complexes M(CO)8 (M = Ca, Sr, Ba). Organometallics 2020, 39, 132–141. 10.1021/acs.organomet.9b00699. [DOI] [Google Scholar]
- Macchi P.; Sironi A. Chemical bonding in transition metal carbonyl clusters: complementary analysis of theoretical and experimental electron densities. Coord. Chem. Rev. 2003, 238, 383–412. 10.1016/S0010-8545(02)00252-7. [DOI] [Google Scholar]
- Cortés-Guzmán F.; Bader R. F. W. Complementarity of QTAIM and MO theory in the study of bonding in donor-acceptor complexes. Coord. Chem. Rev. 2005, 249, 633–662. 10.1016/j.ccr.2004.08.022. [DOI] [Google Scholar]
- Pendás A. M.; Blanco M. A.; Francisco E. Two-electron integrations in the quantum theory of atoms in molecules. J. Chem. Phys. 2004, 120, 4581–4590. 10.1063/1.1645788. [DOI] [PubMed] [Google Scholar]
- Blanco M. A.; Pendás A. M.; Francisco E. Interacting Quantum Atoms: A Correlated Energy Decomposition Scheme Based on the Quantum Theory of Atoms in Molecules. J. Chem. Theory Comput. 2005, 1, 1096–1109. 10.1021/ct0501093. [DOI] [PubMed] [Google Scholar]
- Francisco E.; Pendás A. M.; Blanco M. A. A Molecular Energy Decomposition Scheme for Atoms in Molecules. J. Chem. Theory Comput. 2006, 2, 90–102. 10.1021/ct0502209. [DOI] [PubMed] [Google Scholar]
- Pendás A. M.; Blanco M. A.; Francisco E. Chemical fragments in real space: definitions, properties, and energetic decompositions. J. Comput. Chem. 2007, 28, 161–184. 10.1002/jcc.20469. [DOI] [PubMed] [Google Scholar]
- Brugos J.; Cabeza J. A.; García-Álvarez P.; Pérez-Carreño E.; Van der Maelen J. F. Octahedral manganese(i) and ruthenium(ii) complexes containing 2-(methylamido)pyridine-borane as a tripod κ3N,H,H-ligand. Dalton Trans. 2017, 46, 4009–4017. 10.1039/C7DT00378A. [DOI] [PubMed] [Google Scholar]
- Ruiz J.; Sol D.; García L.; Mateo M. A.; Vivanco M.; Van der Maelen J. F. Generation and Tunable Cyclization of Formamidinate Ligands in Carbonyl Complexes of Mn (I): An Experimental and Theoretical Study. Organometallics 2019, 38, 916–925. 10.1021/acs.organomet.8b00898. [DOI] [Google Scholar]
- Van der Maelen J. F.; Brugos J.; García-Álvarez P.; Cabeza J. A. Two octahedral σ-borane metal (MnI and RuII) complexes containing a tripod κ3N,H,H-ligand: Synthesis, structural characterization, and theoretical topological study of the charge density. J. Mol. Struct. 2020, 1201, 127217.and further references therein 10.1016/j.molstruc.2019.127217. [DOI] [Google Scholar]
- Tiana D.; Francisco E.; Blanco M. A.; Macchi P.; Sironi A.; Martín-Pendás A. Bonding in classical and nonclassical transition metal carbonyls: the interacting quantum atoms perspective. J. Chem. Theory Comput. 2010, 6, 1064–1074. 10.1021/ct9006629. [DOI] [Google Scholar]
- For an early version of the IQA method, see:; Vyboishchikov S. F.; Salvador P.; Duran M. Density functional energy decomposition into one- and two-atom contributions. J. Chem. Phys. 2005, 122, 244110. 10.1063/1.1935511. [DOI] [PubMed] [Google Scholar]
- Krapp A.; Bickelhaupt F. M.; Frenking G. Orbital Overlap and Chemical Bonding. Chem. - Eur. J. 2006, 12, 9196–9216. 10.1002/chem.200600564. [DOI] [PubMed] [Google Scholar]
- For an EDA study of LiF and LiF+, see ref (63) and; Bickelhaupt F. M.; Solà M.; Fonseca Guerra C. J. Comput. Chem. 2007, 28, 238–250. 10.1002/jcc.20547. [DOI] [PubMed] [Google Scholar]
- Wagner J. P.; Schreiner P. R. London dispersion in molecular chemistry—reconsidering steric effects. Angew. Chem., Int. Ed. 2015, 54, 12274–12296. 10.1002/anie.201503476. [DOI] [PubMed] [Google Scholar]
- Jin J. Y.; Yang T.; Xin K.; Wang G. J.; Jin X. Y.; Zhou M. F.; Frenking G. Octacarbonyl Anion Complexes of Group Three Transition Metals [TM(CO)8]− (TM = Sc, Y, La) and the 18-Electron Rule. Angew. Chem., Int. Ed. 2018, 57, 6236–6241. 10.1002/anie.201802590. [DOI] [PubMed] [Google Scholar]
- Ehlers A. W.; Ruiz-Molares Y.; Baerends E. J.; Ziegler T. Dissociation Energies, Vibrational Frequencies, and 13C NMR Chemical Shifts of the 18-Electron Species [M(CO)6]n (M = Hf-Ir, Mo, Tc, Ru, Cr, Mn, Fe). A Density Functional Study. Inorg. Chem. 1997, 36, 5031–5036. 10.1021/ic970223z. [DOI] [Google Scholar]
- Diefenbach A.; Bickelhaupt F. M.; Frenking G. The Nature of the Transition Metal-Carbonyl Bond and the Question about the Valence Orbitals of Transition Metals. A Bond-Energy Decomposition Analysis of TM(CO)6q (TMq = Hf2-, Ta–, W, Re+, Os2+, Ir3+). J. Am. Chem. Soc. 2000, 122, 6449–6458. 10.1021/ja000663g. [DOI] [Google Scholar]
- Li J.; Schreckenbach G.; Ziegler T. A Reassessment of the First Metal—Carbonyl Dissociation Energy in M(CO)4 (M = Ni, Pd, Pt), M(CO)5 (M = Fe, Ru, Os), and M(CO)6 (M = Cr, Mo, W) by a Quasirelativistic Density Functional Method. J. Am. Chem. Soc. 1995, 117, 486–494. 10.1021/ja00106a056. [DOI] [Google Scholar]
- Zhao Y.; Truhlar D. The M06 suite of density functionals for main group thermochemistry, thermochemical kinetics, noncovalent interactions, excited states, and transition elements: two new functionals and systematic testing of four M06-class functionals and 12 other functionals. Theor. Chem. Acc. 2008, 120, 215–241. 10.1007/s00214-007-0310-x. [DOI] [Google Scholar]
- Grimme S.; Antony J.; Ehrlich S.; Krieg H. A consistent and accurate ab initio parametrization of density functional dispersion correction (DFT-D) for the 94 elements H-Pu. J. Chem. Phys. 2010, 132, 154104. 10.1063/1.3382344. [DOI] [PubMed] [Google Scholar]
- Weigend F.; Ahlrichs R. Balanced basis sets of split valence, triple zeta valence and quadruple zeta valence quality for H to Rn: Design and assessment of accuracy. Phys. Chem. Chem. Phys. 2005, 7, 3297–3305. 10.1039/b508541a. [DOI] [PubMed] [Google Scholar]
- Weigend F. Accurate Coulomb-fitting basis sets for H to Rn. Phys. Chem. Chem. Phys. 2006, 8, 1057–1065. 10.1039/b515623h. [DOI] [PubMed] [Google Scholar]
- Andrae D.; Haeussermann U.; Dolg M.; Stoll H.; Preuss H. Energy-adjusted ab initio pseudopotentials for the second and third row transition elements. Theor. Chim. Acta 1990, 77, 123–141. 10.1007/BF01114537. [DOI] [Google Scholar]
- Kaupp M.; Schleyer P. v. R.; Stoll H.; Preuss H. Pseudopotential approaches to Ca, Sr, and Ba hydrides. Why are some alkaline earth MX2 compounds bent?. J. Chem. Phys. 1991, 94, 1360–1366. 10.1063/1.459993. [DOI] [Google Scholar]
- Frisch M. J.et al. Gaussian 16, rev. A.03; Gaussian, Inc.: Wallingford, CT, 2016.
- Landis C. R.; Weinhold F.. Valency and Bonding: A Natural Bond Orbital Donor-Acceptor Perspective; Cambridge University Press: Cambridge, 2005. [Google Scholar]
- Glendening E. D.; Landis C. R.; Weinhold C. F. NBO 6.0: Natural bond orbital analysis program. J. Comput. Chem. 2013, 34, 1429–1437. 10.1002/jcc.23266. [DOI] [PubMed] [Google Scholar]
- Bader R. F. W.Atoms in Molecules: A Quantum Theory; Oxford University Press: Oxford, U.K., 1990. [Google Scholar]
- Keith T. A.AIMAll, ver. 19.10.12; TK Gristmill Software, Overland Park, KS, 2019. aim.tkgristmill.com.
- Huzinaga S.; Miguel B. A comparison of the geometrical sequence formula and the well-tempered formulas for generating GTO basis orbital exponents. Chem. Phys. Lett. 1990, 175, 289–291. 10.1016/0009-2614(90)80112-Q. [DOI] [Google Scholar]
- Huzinaga S.; Klobukowski M. Well-tempered Gaussian basis sets for the calculation of matrix Hartree—Fock wavefunctions. Chem. Phys. Lett. 1993, 212, 260–264. 10.1016/0009-2614(93)89323-A. [DOI] [Google Scholar]
- Cabeza J. A.; van der Maelen J. F.; García-Granda S. Topological Analysis of the Electron Density in the N-Heterocyclic Carbene Triruthenium Cluster [Ru3(μ-H)2(μ3-MeImCH)(CO)9] (Me2Im = 1,3-dimethylimidazol-2-ylidene). Organometallics 2009, 28, 3666–3672. and further references therein 10.1021/om9000617. [DOI] [Google Scholar]
- Lu T.; Chen F. Multiwfn: A multifunctional wavefunction analyzer. J. Comput. Chem. 2012, 33, 580–592. 10.1002/jcc.22885. [DOI] [PubMed] [Google Scholar]
- Ziegler T.; Rauk A. On the calculation of bonding energies by the Hartree Fock Slater method. Theor. Chim. Acta 1977, 46, 1–10. 10.1007/BF02401406. [DOI] [Google Scholar]
- Mitoraj M.; Michalak A. Donor-acceptor properties of ligands from the natural orbitals for chemical valence. Organometallics 2007, 26, 6576–6580. 10.1021/om700754n. [DOI] [Google Scholar]
- Mitoraj M.; Michalak A. Applications of natural orbitals for chemical valence in a description of bonding in conjugated molecules. J. Mol. Model. 2008, 14, 681–687. 10.1007/s00894-008-0276-1. [DOI] [PubMed] [Google Scholar]
- ADF2017, SCM, Theoretical Chemistry; Vrije Universiteit: Amsterdam, The Netherlands. http://www.scm.com.
- te Velde G.; Bickelhaupt F. M.; Baerends E. J.; Guerra C. F.; Van Gisbergen S. J. A.; Snijders J. G.; Ziegler T. Chemistry with ADF. J. Comput. Chem. 2001, 22, 931–967. 10.1002/jcc.1056. [DOI] [Google Scholar]
- Mitoraj M. P.; Michalak A.; Ziegler T. A Combined Charge and Energy Decomposition Scheme for Bond Analysis. J. Chem. Theory Comput. 2009, 5, 962–975. 10.1021/ct800503d. [DOI] [PubMed] [Google Scholar]
- van Lenthe E.; Baerends E. J. Optimized Slater-type basis sets for the elements 1–118. J. Comput. Chem. 2003, 24, 1142–1156. 10.1002/jcc.10255. [DOI] [PubMed] [Google Scholar]
- van Lenthe E.; Ehlers A.; Baerends E. J. Geometry optimizations in the zero order regular approximation for relativistic effects. J. Chem. Phys. 1999, 110, 8943–8953. 10.1063/1.478813. [DOI] [Google Scholar]
- Zhao L.; von Hopffgarten M.; Andrada D. M.; Frenking G. Energy decomposition analysis. Wiley Interdiscip. Rev.: Comput. Mol. Sci. 2018, 8, e1345 10.1002/wcms.1345. [DOI] [Google Scholar]
- Frenking G.; Bickelhaupt F. M. In The Chemical Bond. Fundamental Aspects of Chemical Bonding; Frenking G., Shaik S., Eds.; Wiley-VCH: Weinheim, 2014; p 121–158. [Google Scholar]
- Frenking G.; Tonner R.; Klein S.; Takagi N.; Shimizu T.; Krapp A.; Pandey K. K.; Parameswaran P. New bonding modes of carbon and heavier group 14 atoms Si-Pb. Chem. Soc. Rev. 2014, 43, 5106–5139. 10.1039/C4CS00073K. [DOI] [PubMed] [Google Scholar]
- Zhao L.; Hermann M.; Holzmann N.; Frenking G. Dative bonding in main group compounds. Coord. Chem. Rev. 2017, 344, 163–204. 10.1016/j.ccr.2017.03.026. [DOI] [Google Scholar]
- Frenking G.; Hermann M.; Andrada D. M.; Holzmann N. Donor-acceptor bonding in novel low-coordinated compounds of boron and group-14 atoms C-Sn. Chem. Soc. Rev. 2016, 45, 1129–1144. 10.1039/C5CS00815H. [DOI] [PubMed] [Google Scholar]
- Zhao L.; Hermann M.; Schwarz W. H. E.; Frenking G. The Lewis electron-pair bonding model: modern energy decomposition analysis. Nat. Rev. Chem. 2019, 3, 48–63. 10.1038/s41570-018-0060-4. [DOI] [Google Scholar]
- Fukui K. Recognition of stereochemical paths by orbital interaction. Acc. Chem. Res. 1971, 4, 57–64. 10.1021/ar50038a003. [DOI] [Google Scholar]
- Fukui K.Theory of Orientation and Stereoselection; Springer Verlag: Berlin, 1975. [Google Scholar]
- Woodward R. B.; Hoffmann R.. The Conservation of Orbital Symmetry; Verlag Chemie: Weinheim, 1970. [Google Scholar]
- Albright T. A.; Burdett J. K.; Whangbo M. H.. Orbital Interactions in Chemistry; Wiley: New York, 1985; p 82. [Google Scholar]; The statement about the antibonding character of the HOMO of CO is missing in the later second edition of the book; see ref (33).
- Chi C.; Pan S.; Meng L.; Luo M.; Zhao L.; Zhou M. F.; Frenking G. Alkali Metal Covalent Bonding in Nickel Carbonyl Complexes ENi(CO)3–. Angew. Chem., Int. Ed. 2019, 58, 1732–1736. 10.1002/anie.201813022. [DOI] [PubMed] [Google Scholar]
- Bader R. F. W.; Stephens M. E. Spatial localization of the electronic pair and number distributions in molecules. J. Am. Chem. Soc. 1975, 97, 7391–7399. 10.1021/ja00859a001. [DOI] [Google Scholar]
- Fradera X.; Austen M. A.; Bader R. F. W The Lewis Model and Beyond. J. Phys. Chem. A 1999, 103, 304–314. 10.1021/jp983362q. [DOI] [Google Scholar]
- Fradera X.; Poater J.; Simon S.; Duran M.; Solà M. Electron-pairing analysis from localization and delocalization indices in the framework of the atoms-in-molecules theory. Theor. Chem. Acc. 2002, 108, 214–224. 10.1007/s00214-002-0375-5. [DOI] [Google Scholar]
- For an enlightening discussion, see:; Matito E.; Poater J.; Solà M.; Duran M.; Salvador P. Comparison of the AIM Delocalization Index and the Mayer and Fuzzy Atom Bond Orders. J. Phys. Chem. A 2005, 109, 9904–9910. 10.1021/jp0538464. [DOI] [PubMed] [Google Scholar]
- Heitler W.; London F. Interaction of neutral atoms and homeopolar bond according to quantum mechanics. Eur. Phys. J. A 1927, 44, 455–472. 10.1007/BF01397394. [DOI] [Google Scholar]
- Frenking G., Shaik S., Eds. The Chemical Bond. 1. Fundamental Aspects of Chemical Bonding; Wiley-VCH: Weinheim, 2014. [Google Scholar]
- Wu X.; Zhao L.; Jiang D.; Fernández I.; Berger R.; Zhou M. F.; Frenking G. Barium as Honorary Transition Metal in Action: Experimental and Theoretical Study of Ba(CO)+ and Ba(CO)−. Angew. Chem., Int. Ed. 2018, 57, 3974–3980. 10.1002/anie.201713002. [DOI] [PubMed] [Google Scholar]
- The calculated partial charge of Ba in Ba(CO)•+ is q(Ba) = 1.39, which shows that Ba+ is a donor toward CO. For a detailed discussion, see ref (110).
- Zubarev D. Y.; Boldyrev A. I. Developing paradigms of chemical bonding: adaptive natural density partitioning. Phys. Chem. Chem. Phys. 2008, 10, 5207–5217. 10.1039/b804083d. [DOI] [PubMed] [Google Scholar]
- The AdNDP method may have problems in some π-conjugated systems:; Kumar A.; Duran M.; Solà M. Is Coronene Better Described by Clar’s Aromatic π-Sextet Model or by the AdNDP Representation?. J. Comput. Chem. 2017, 38, 1606–1611. 10.1002/jcc.24801. [DOI] [PubMed] [Google Scholar]
- Hinze J.; Jaffe H. H. Electronegativity. I. Orbital electronegativity of neutral atoms. J. Am. Chem. Soc. 1962, 84, 540–546. 10.1021/ja00863a008. [DOI] [Google Scholar]
- Hinze J.; Whitehead M. A.; Jaffe H. H. Electronegativity. II. Bond and orbital electronegativities. J. Am. Chem. Soc. 1963, 85, 148–154. 10.1021/ja00885a008. [DOI] [Google Scholar]
- Hinze J.; Jaffe H. H. Electronegativity: III. Orbital electronegativities and electron affinities of transition metals. Can. J. Chem. 1963, 41, 1315–1328. 10.1139/v63-183. [DOI] [Google Scholar]
- Pyykkö P. Relativistic effects in structural chemistry. Chem. Rev. 1988, 88, 563–594. 10.1021/cr00085a006. [DOI] [Google Scholar]
- Wolf A.; Reiher M.. Relativistic Quantum Chemistry: The Fundamental Theory of Molecular Science; Wiley-VCH: Weinheim, 2009. [Google Scholar]
- Schwerdtfeger P.Relativistic Electronic Structure Theory. Part 1: Fundamentals; Elsevier: Amsterdam, 2002. [Google Scholar]
- Ilias M.; Kellö V.; Urban M. Relativistic Effects in Atomic and Molecular Properties. Acta Phys. Slovaca 2010, 60, 259–391. 10.2478/v10155-010-0003-1. [DOI] [Google Scholar]
- The linear dicarbonyls M(CO)2 (M = Ca, Sr, Ba) serve as model compounds in our study for studying the origin of the C–O vibrational red shift. Test calculations show that the global energy minima have a bent equilibrium structure, which is irrelevant for the present work.
- Dewar M. J. S. Chemical implications of π Conjugation. J. Am. Chem. Soc. 1984, 106, 669–682. 10.1021/ja00315a036. [DOI] [Google Scholar]
- Gagliardi L.; Pyykko P. Cesium and barium as honorary d elements: CsN7Ba as an example. Theor. Chem. Acc. 2003, 110, 205–210. 10.1007/s00214-003-0485-8. [DOI] [Google Scholar]
- Moore C. E.Atomic Energy Levels; National Bureau of Standards, U.S. Circular No. 467; U.S. GPO: Washington, D.C., 1958. [Google Scholar]
- Pyykkö P. Dirac-Fock one-centre calculations. Part 7.—Divalent systems MH+ and MH2 (M = Be, Mg, Ca, Sr, Ba, Ra, Zn, Cd, Hg, Yb and No). J. Chem. Soc., Faraday Trans. 2 1979, 75, 1256–1276. 10.1039/F29797501256. [DOI] [Google Scholar]
- a Kaupp M. In The Chemical Bond. Chemical Bonding Across the Periodic Table; Frenking G., Shaik S., Eds.; Wiley-VCH: Weinheim, 2014; pp 1–24. [Google Scholar]
- Kaupp M. “Non-VSEPR” Structures and Bonding in d0 Systems. Angew. Chem., Int. Ed. 2001, 40, 3534–3565. . [DOI] [PubMed] [Google Scholar]
- Matito E.; Solà M. The role of electronic delocalization in transition metal complexes from the electron localization function and the quantum theory of atoms in molecules viewpoints. Coord. Chem. Rev. 2009, 253, 647–665. 10.1016/j.ccr.2008.10.003. [DOI] [Google Scholar]
- Nakashima K.; Zhang X.; Xiang M.; Lin Y.; Lin M.; Mo Y. Block-localized wavefunction energy decomposition (BLW-ED) analysis of σ/π interactions in metal-carbonyl bonding. J. Theor. Comput. Chem. 2008, 7, 639–654. 10.1142/S0219633608004027. [DOI] [Google Scholar]
- Pilme J.; Silvi B.; Alikhani M. E. Structure and Stability of M-CO, M = First-Transition-Row Metal: An Application of Density Functional Theory and Topological Approaches. J. Phys. Chem. A 2003, 107, 4506–4514. 10.1021/jp027203p. [DOI] [Google Scholar]
- Bistoni G.; Rampino S.; Scafuri N.; Ciancaleoni G.; Zuccaccia D.; Belpassi L.; Tarantelli F. How π back-donation quantitatively controls the CO stretching response in classical and non-classical metal carbonyl complexes. Chem. Sci. 2016, 7, 1174–1184. 10.1039/C5SC02971F. [DOI] [PMC free article] [PubMed] [Google Scholar]
- Jost A.; Rees B.; Yelon W. B. Electronic structure of chromium hexacarbonyl at 78 K. I. Neutron diffraction study. Acta Crystallogr., Sect. B: Struct. Crystallogr. Cryst. Chem. 1975, B31, 2649–2658. 10.1107/S0567740875008394. [DOI] [Google Scholar]
- Arnesen S. P.; Seip H. M.; et al. Studies on the Failure of the First Born Approximation in Electron Diffraction. V. Molybdenum- and Tungsten Hexacarbonyl. Acta Chem. Scand. 1966, 20, 2711–2727. 10.3891/acta.chem.scand.20-2711. [DOI] [Google Scholar]
- Braga D.; Grepioni F.; Orpen A. G. Nickel carbonyl [Ni(CO)4] and iron carbonyl [Fe(CO)5]: molecular structures in the solid state. Organometallics 1993, 12, 1481–1483. 10.1021/om00028a082. [DOI] [Google Scholar]
- Huang J.; Hedberg I. C.; Davis H. B.; Pomeroy R. K. Structure and bonding in transition-metal carbonyls and nitrosyls. 4. Molecular structure of ruthenium pentacarbonyl determined by gas-phase electron diffraction. Inorg. Chem. 1990, 29, 3923–3925. 10.1021/ic00345a004. [DOI] [Google Scholar]
- Huang J.; Hedberg K.; Pomeroy R. K. Structure and bonding in transition-metal carbonyls and nitrosyls. 3. Molecular structure of osmium pentacarbonyl from gas-phase electron diffraction. Organometallics 1988, 7, 2049–2053. 10.1021/om00099a025. [DOI] [Google Scholar]
- Holloway J. H.; Senior J. B.; Szary A. C. Rhenium carbonyl fluorides: preparation of [Re(CO)6][ReF6] and some reactions of [Re(CO)5F·ReF5]. J. Chem. Soc., Dalton Trans. 1987, 741–745. 10.1039/DT9870000741. [DOI] [Google Scholar]
- Calderazzo F.; Englert U.; Pampaloni G.; Pelizzi G.; Zamboni R. Studies on carbonyl derivatives of early transition elements. A convenient method for the preparation of the hexacarbonylniobate(1-) anion at atmospheric pressure and room temperature. Crystal and molecular structure of [M(CO)6]−(M = Nb, Ta) as their bis(triphenylphosphine) nitrogen(1+) derivatives. Inorg. Chem. 1983, 22, 1865–1870. 10.1021/ic00155a009. [DOI] [Google Scholar]
- Ellis J. E.; Chi K.-M. Synthesis, Isolation, and Characterization of [K(cryptand 2.2.2)]2[Hf(CO)6], the First Substance To Contain Hafnium in a Negative Oxidation State. Structural Characterization of [K(cryptand 2.2.2)]2[M(CO)6]·Pyridine (M = Ti, Zr, and Hf). J. Am. Chem. Soc. 1990, 112, 6022–6025. 10.1021/ja00172a017. [DOI] [Google Scholar]
- Bernhardt E.; Bach C.; Bley B.; Wartchow R.; Westphal U.; Isham I. H. T.; Ahsen B. V.; Wang C.; Willner H.; Thompson R. C.; Aubke F. Homoleptic, σ-Bonded Octahedral [M(CO)6]2+ Cations of Iron(II), Ruthenium(II), and Osmium(II): Part 1: Syntheses, Thermochemical and Vibrational Characterizations, and Molecular Structures as [Sb2F11]− and [SbF6]− Salts. A Comprehensive, Comparative Study. Inorg. Chem. 2005, 44, 4189–4205. 10.1021/ic040115u. [DOI] [PubMed] [Google Scholar]
- Geier J.; Willner H.; Lehmann C. W.; Aubke F. Formation of Hexacarbonylmanganese(I) Salts, [Mn(CO)6]+X–, in Anhydrous HF. Inorg. Chem. 2007, 46, 7210–7214. 10.1021/ic700798z. [DOI] [PubMed] [Google Scholar]
- Gurzhiy V. V.; Miroslavov A. E.; Sidorenko G. V.; Lumpov A. A.; Krivovichev S. V.; Suglobov D. N. Hexacarbonyl-technetium(I) perchlorate. Acta Crystallogr., Sect. E: Struct. Rep. Online 2008, 64, m1145. 10.1107/S1600536808025208. [DOI] [PMC free article] [PubMed] [Google Scholar]
- Hedberg L.; Iijima T.; Hedberg K. Nickel tetracarbonyl, Ni(CO)4. I. Molecular structure by gaseous electron diffraction. II. Refinement of quadratic force field. J. Chem. Phys. 1979, 70, 3224–3229. 10.1063/1.437911. [DOI] [Google Scholar]
- Darling J. H.; Ogden J. S. Infrared Spectroscopic Evidence for Palladium Tetracarbony. Inorg. Chem. 1972, 11, 666–667. 10.1021/ic50109a060. [DOI] [Google Scholar]
- Kuendig E. P.; McIntosh D.; Moskovits M.; Ozin G. A. Binary Carbonyls of Platinum, Pt(CO)n (Where n = 1–4). A Comparative Study of the Chemical and Physical Properties of M(CO)n (Where M = Ni, Pd, or Pt; n = 1–4). J. Am. Chem. Soc. 1973, 95, 7234–7241. 10.1021/ja00803a009. [DOI] [Google Scholar]
Associated Data
This section collects any data citations, data availability statements, or supplementary materials included in this article.