

Abstract
Proteins are dynamic entities that intermittently depart from their ground-state structures and undergo conformational transitions as a critical part of their functions. Central to understanding such transitions are the structural rearrangements along the connecting pathway, where the transition state plays a special role. Using NMR relaxation at variable temperature and pressure to measure aromatic ring flips inside a protein core, we obtain information on the structure and thermodynamics of the transition state. We show that the isothermal compressibility coefficient of the transition state is similar to that of short-chain hydrocarbon liquids, implying extensive local unfolding of the protein. Our results further indicate that the required local volume expansions of the protein can occur not only with a net positive activation volume of the protein, as expected from previous studies, but also with zero activation volume by compaction of remote void volume, when averaged over the ensemble of states.
Keywords: protein dynamics, protein volume fluctuations, NMR spectroscopy, relaxation dispersion, high-pressure NMR
Introduction
Protein motions are essential for biological function. Functionally important protein dynamics often involve rare transitions between alternative conformations that require collective movement of many atoms, taking place on relatively slow time scales, on the order of microseconds to milliseconds. Over the last couple of decades, development of NMR relaxation dispersion methods has enabled in-depth studies of conformational exchange dynamics, highlighting the critical role of lowly populated, high-energy conformations for protein function.1−3 While these studies have made it possible to characterize the properties of high-energy states, much less is known about the transition states of the free-energy barriers between the ground and high-energy states. Understanding the protein motions that enable conformational changes requires characterization of the transition states to assess the extent of structural and energetic perturbation of the protein as it passes the free energy barrier between basins in the energy landscape.
Aromatic ring flips, i.e., 180° jumps around the χ2 dihedral angle (or the imaginary Cβ–Cγ–Cζ-axis) in phenylalanine and tyrosine residues, represent a hallmark of protein dynamics4 first revealed by seminal studies in the mid-1970s that fundamentally changed the view of proteins by demonstrating their highly dynamic character.5−7 The apparently simple reaction coordinate of ring flips—in the case of phenylalanine, the two end states have an identical conformation—makes for an attractive system to investigate the nature of the transition-state ensemble and its thermodynamic properties. The activation enthalpy and activation entropy of ring flips have been characterized by temperature-dependent NMR experiments for only a handful of proteins.5,7−13 Indeed, despite the long history of studying ring flips, there are not many proteins for which ring flip rates have been measured experimentally.5−18 In fact, experimental characterization of ring flip rates did not progress much after the groundbreaking observations in the 1970s, partly because of limitations of the NMR technique, which required well-resolved signals in the slow-exchange regime. Recently, there has been a renaissance in these types of studies,11,13,19,20 enabled by methodological advances, including site-selective isotope labeling of aromatic side chains,21−27 relaxation dispersion experiments tailored to aromatic rings,28−31 and improved analysis that takes into account the effects of strong 1H–1H J-coupling within the aromatic ring.16
The densely packed interior of globular proteins implies that ring flips can occur only upon the formation of substantial void volume around the ring. Thus, it is of significant interest to characterize such activation volumes with the aim to obtain key information about the conformational fluctuations of the local ring environment. Activation volumes of ring flips can be determined from pressure-dependent NMR experiments, which have been performed on a small number of proteins.8,13,14,32 Applying high hydrostatic pressure is an elegant means to shift the equilibrium between different states, often in a fully reversible way.33−37 Pressure-dependent studies yield access to additional thermodynamic parameters, including the difference between states in their partial molar volumes and isothermal compressibilities. Furthermore, by varying both pressure and temperature, it is possible to determine the pressure–temperature phase diagram of a process (Figure 1) and probe the thermal expansion and heat capacity.34 Most pressure-dependent studies on proteins have addressed folding–unfolding equilibria,34,38−40 where the effects are large and can be studied efficiently by low-resolution methods (e.g., fluorescence, UV, or CD spectroscopy). High-pressure NMR spectroscopy offers significant advantages, including a high-resolution view of protein structure and dynamics.33,41−47 NMR studies have revealed the effect of pressure on the native-state protein structure14,48,49 and its hydrogen bond network44,46 as well as on protein-folding kinetics42,50−54 and the pressure–temperature phase diagram of protein folding.38
Figure 1.
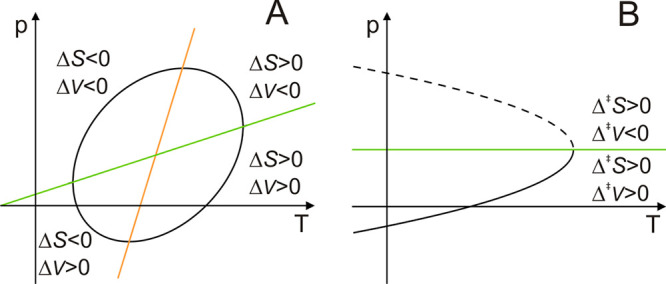
Schematic representation of pressure–temperature phase diagrams ΔG(p,T) for a protein. (A) Protein stability. Different regions for ΔV and ΔS are indicated. Lines indicating ΔV = 0 and ΔS = 0 are shown in green and orange, respectively. The same principles hold for equilibrium and kinetic diagrams. (B) Schematic representation of a phase diagram Δ‡G(p,T) for a ring flip process, as addressed in the text. The green line Δ‡V = 0 divides the pressure–temperature surface into regions of Δ‡V > 0 (full line) and Δ‡V < 0 (dashed line). Distinctions between the phase diagrams in (A) and (B) originate from the different numbers of temperature-dependent parameters, which determine the shape of the contour lines.
Here, we employ pressure- and temperature-dependent NMR relaxation dispersion experiments to determine the activation enthalpy (Δ‡H0), entropy (Δ‡S0), volume (Δ‡V0), and isothermal volume compressibility (Δ‡κ′) of aromatic ring flips for F52 in the B1 domain of protein G (GB1); see Materials and Methods for a description of the underlying theory. Together, these thermodynamic parameters provide unique information on the structural and energetic properties of the transition state. The four parameters paint a consistent picture of the transition state as being expanded with a concomitant loss of favorable interactions, an increase in the number of populated conformations, and a compressibility considerably greater than that of the ground state. The results further indicate that ring flips can occur via two complementary mechanisms that involve either a positive activation volume, as previously observed, or positive volume fluctuations that, on average, are compensated by compaction of remote void volumes to yield a net zero activation volume. Taken together, these observations reveal that the local density of the protein core is considerably perturbed by frequent fluctuations.
Results and Discussion
We focused in this study on the aromatic ring of F52 in protein GB1, which gives rise to high-quality R1ρ relaxation dispersion profiles over a wide range of temperature and pressure. Several factors restrict the ranges of temperature and pressure over which ring flips can be studied in aqueous solution, including the obvious limitations imposed by the freezing and boiling points of water. Second, most proteins have limited thermal stability and often start to unfold even below 50 °C and ambient pressure. Third, the sensitivity of NMR experiments designed to study exchange processes depends critically on various system parameters that in turn depend on temperature and pressure, such as the kinetic rate constants in relation to the chemical shift difference between the exchanging states. However, F52 has a sizable 13C chemical shift difference (Δδ) between the two ε-positions of the ring, which we measured under slow-exchange conditions,13 leading to significant relaxation dispersion also at higher flip rates. For this residue, the counteracting effects of increasing pressure (which decreases the flip rate) and increasing temperature (which increases the flip rate) serve to keep the flip rate within the NMR-observable window under conditions where the protein is fully folded. This is in contrast to the other aromatic rings in GB1, which yield suitable R1ρ relaxation data only at higher temperatures and ambient pressure and therefore cannot be characterized at higher pressures, because the required raise in temperature leads to the onset of unfolding. The aromatic ring of F52 is occluded in the protein core, where it is surrounded by the side chains of Y3, F30, W43, and Y45 (Figure 2). We used GB1 samples site-specifically 13C-labeled using 2-13C glucose, which results in 20% 13C incorporation at the ε-positions of Tyr and Phe.24 This labeling scheme is sufficient for small- to medium-sized proteins that can be investigated at concentrations of 1 mM or higher. Higher 13C incorporation levels can be achieved using chemically synthesized precursors that are metabolically closer to the product, e.g., 99% 13C incorporation has been reported for the ε-position in Phe;23 such labeling schemes also enable site-specific deuteration, which might be beneficial for larger proteins.21,23 However, the present level of 13C incorporation can be used advantageously in combination with the transverse relaxation-optimized spectroscopy (TROSY)-selected R1ρ relaxation dispersion experiment, which leads to a significant reduction of the inherent transverse relaxation rates (R2,0) and therefore dramatically increased sensitivity to conformational exchange.28,29 We acquired 18 13C R1ρ relaxation dispersion curves of sufficient quality at temperatures between 10–40 °C and pressures between 0.1–200 MPa (Figure S1). We determined the ring flip rates, kflip, by global fitting of the dispersion data across all temperatures at a given pressure, with the restrictions kflip(Thigh) > kflip(Tlow) and R2,0(Thigh) ≤ R2,0(Tlow), yielding the results summarized in Table 1. The values of kflip determined here are on the order of 104 s–1, which is at the higher end of previously measured flip rates (101–105 s–1)7−9,11,12 but a factor of 105 slower than those inferred for surface-exposed aromatic rings in ubiquitin via their effect on 13C order parameters.55 The wide range of flip rates reflects the strong dependence of the ring dynamics on the packing density and stability of the local protein environment.
Figure 2.
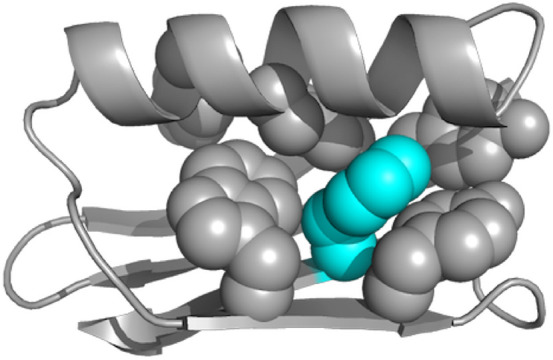
Protein GB1 structure overview. The backbone is shown in ribbon representation, and aromatic side chains are shown as space-filling spheres. F52 is colored cyan. PDB entity 1pgb.62
Table 1. Ring Flip Rates for F52 at Different Pressures and Temperaturesa.
|
kflip (103 s–1) |
|||||||
|---|---|---|---|---|---|---|---|
| p (MPa) | 10 °C | 15 °C | 20 °C | 25 °C | 30 °C | 35 °C | 40 °C |
| 0.1 | 8.5 ± 0.8 | 10.2 ± 0.7 | 14.2 ± 0.7 | ||||
| 50 | 4.6 ± 0.6 | 7.5 ± 0.6 | 9.5 ± 0.5 | 13.1 ± 0.5 | |||
| 100 | 7.7 ± 0.5 | 9.8 ± 0.5 | 13.6 ± 0.5 | ||||
| 150 | 4.7 ± 0.5 | 8.3 ± 0.5 | 11.5 ± 0.4 | 18.8 ± 0.7 | |||
| 200 | 7.0 ± 0.9 | 9.9 ± 0.7 | 15.0 ± 0.8 | 21.7 ± 1.3 | |||
Derived with the restriction kflip(Thigh) > kflip(Tlow), R2,0(Thigh) ≤ R2,0(Tlow).
Activation Enthalpy, Entropy, and Volume from Separate Temperature- or Pressure-Dependent Analyses
We analyzed 18 flip rates obtained at 5 different pressures (0.1–200 MPa) by performing nonlinear fits using the Eyring equation, eq 8, to derive five different pressure-dependent activation enthalpies that vary between (51 ± 2) kJ mol–1 and (54 ± 2) kJ mol–1 and a single, global activation entropy of (11 ± 7) J mol–1 K–1 (Figure 3); the activation entropy is pressure-independent as a consequence of assuming that the isobaric volume expansivity is negligible, Δ‡α′ = 0; see eq 3. The narrow temperature range accessible in these experiments limits the precision in Δ‡S. The pressure-dependent increase in activation enthalpy is small, in agreement with the only previous study addressing this issue,8 and the derived activation entropy is positive in agreement with all previous experimental studies of ring flip rates.5,7−13 The activation free energy is very similar to the value determined in our previous study based solely on temperature-dependent measurements, whereas both Δ‡H and Δ‡S are lower than the previous estimates,13 emphasizing the difficulties of deconvoluting the two parameters in that case. However, these differences have no impact on the present study, which is self-consistent. The very limited variation in Δ‡H indicates that this parameter can be considered temperature- and pressure-independent.
Figure 3.
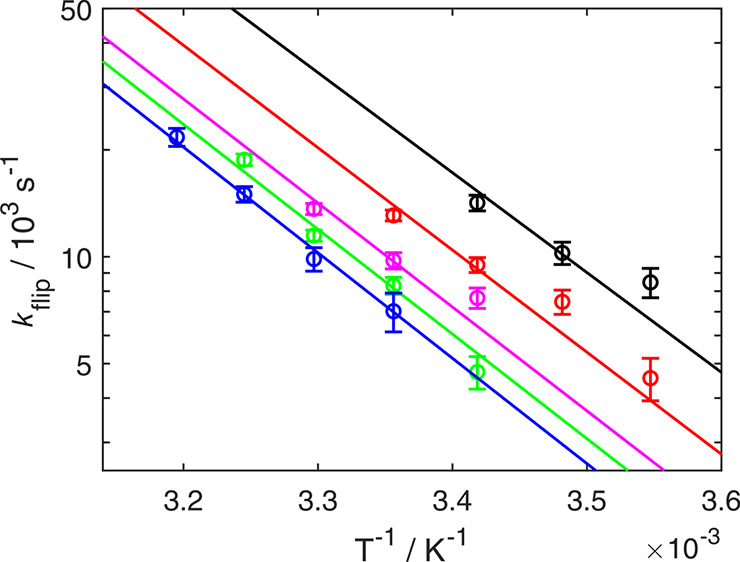
Temperature-dependence of flip rates. kflip is plotted as a function of 1/T at different pressures: 0.1 MPa (black), 50 MPa (red), 100 MPa (magenta), 150 MPa (green), and 200 MPa (blue). The fits of eq 8 to the data are displayed as solid lines. The data are represented using a logarithmic y-axis to show the expected linearity, but the fit was performed using nonlinear regression of kflip on T. Data were fitted globally to a common activation entropy (Δ‡S) and different apparent activation enthalpies (Δ‡H) at the different pressures.
Next, we fitted eight flip rates measured at three temperatures (10, 15, and 20 °C) against pressure according to eq 9 to derive a global activation volume of (17 ± 2) mL mol–1 (Figure 4), which is somewhat smaller than that measured in our previous study.13 In agreement with all previous experimental studies, the activation volume is positive.8,13,14,32 The positive values of both Δ‡S and Δ‡V are consistent with the expectation that the transition-state ensemble is more expanded with a greater number of conformations than the ground state, which is densely packed and conformationally restricted. Note that in the present context, the “transition state” refers specifically to the activation barrier of the ring flip process.
Figure 4.
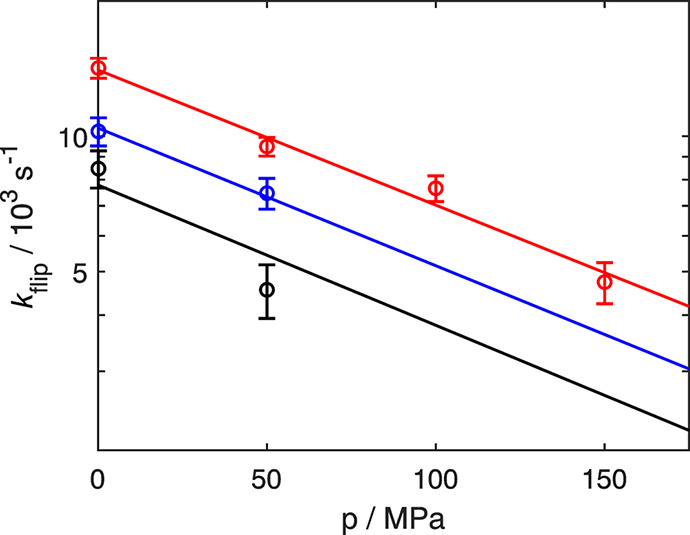
Pressure-dependence of ring flip rates. kflip is plotted as a function of pressure at different temperatures: 10 °C (black), 15 °C (blue), and 20 °C (red). The fits of eq 9 to the data are displayed as solid lines. The data are represented using a logarithmic y-axis to show the expected linearity, but the fit was performed using nonlinear regression of kflip on p.
The pressure-dependence of the flip rate directly shows that it decreases progressively with increasing pressure (Figure 3). That is, the fitted lines, describing the flip rate as a function of temperature, approach each other as pressure increases. Furthermore, determination of the activation volume using only rates measured at higher pressure results in a smaller activation volume. Therefore, it is clear that the activation volume alone cannot account for the observed pressure-dependence, demonstrating the requirement to include the isothermal volume compressibility κ′ in the model, which amounts to introducing a second-order pressure-dependence of the activation free energy; see eq 6.
Pressure–Temperature Phase Diagram of the F52 Ring Flip
We performed a global fit of eq 6 to all derived ring flip rates, so as to determine the Gibbs free energy (Δ‡G0), activation entropy (Δ‡S0), and activation volume (Δ‡V0) at the reference point as well as the volume compressibility of activation (Δ‡κ′) (Figure S2A). The reference point (p0, T0) was set to atmospheric pressure (0.1 MPa) and 20 °C. By comparison, a global fit without the compressibility factor included describes the experimental data visibly worse (Figure S2B). Inclusion of Δ‡κ′ reduces χ2red (i.e., χ2 normalized by the number of degrees of freedom) from 4.4 to 2.0, which is significant as gauged by F-tests based on Monte Carlo simulations. The probability that inclusion of Δ‡κ′ would reduce χ2 as much as observed even if it is not the correct model (overfitting; type I error) is pI < 0.001. The probability that the model including Δ‡κ′ does not reduce χ2 as much as observed when it is the correct model (type II error) is pII ≈ 0.07. In other words, the probability is low that a fit without Δ‡κ′ would describe the data as well as actually observed.
The global fit resulted in Δ‡κ′ = (0.13 ± 0.02) mL mol–1 MPa–1, which we analyze in detail below. Further, Δ‡G0 = (48.2 ± 0.1) kJ mol–1 and Δ‡S0 = (17 ± 7) J mol–1 K–1 (Table 2), both corresponding well with the values obtained when including only the temperature-dependence. The activation volume was determined to Δ‡V0 = (28 ± 2) mL mol–1 = (46 ± 3) Å3, which is substantially larger than the value obtained when considering only the pressure-dependence, (17 ± 2) mL mol–1 (Figure 4); the apparent discrepancy arises because the higher-order model deconvolutes the activation volume from the volume compressibility. However, the result is in fair agreement with our previous study on GB113 and activation volumes obtained for other systems, which range from 27 to 51 mL mol–1.8,13,14,32 Δ‡V0 can be compared to the volume available to the F52 ring in the ground state, which is 125 Å3 (see below). Notably, the sum of the ground-state volume and activation volume (125 + 46 = 171 Å3) matches well with the volume of the sphere swept out by a rotating aromatic ring, 164 Å3.32
Table 2. Thermodynamic Parameters of F52 Ring Flippinga.
The pressure–temperature phase diagram calculated from these values is shown in Figure 5A. It displays a parabolic shape for the contours of constant Δ‡G, with lower Δ‡G values at higher temperatures, according to the positive sign of Δ‡S0, which indicates an increase in the number of populated conformations of the transition-state ensemble compared to the ground state. The experimentally measured activation free energies are located in the region where Δ‡V > 0, with data points obtained at higher pressures approaching the line Δ‡V = 0, which occurs at about 215 MPa.
Figure 5.
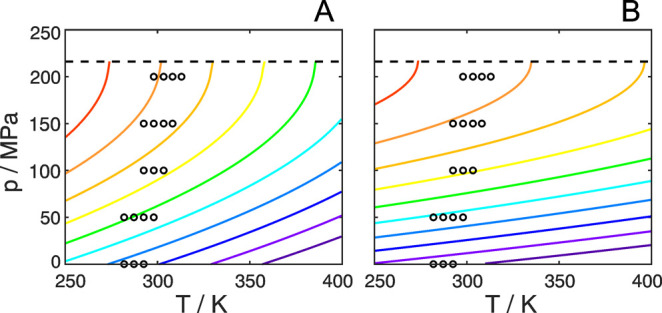
Experimental pressure–temperature phase diagram of the F52 ring flip. Calculated from the thermodynamic parameters obtained by (A) global fitting of flip rates shown in Table 1 and (B) direct global fitting of R1ρ relaxation dispersions. Colored lines indicate contours of constant values for the Gibbs free energy of activation, Δ‡G, ranging equidistantly (A) from 47.0 kJ mol–1 (violet) to 51.5 kJ mol–1 (red) and (B) from 48.3 kJ mol–1 (violet) to 51.0 kJ mol–1 (red). Measured data points are shown as black circles, and Δ‡V = 0 is indicated as a dashed line.
After having established the model for deriving the pressure–temperature phase diagram of the F52 ring flip (including the volume compressibility of activation Δ‡κ′), we performed a global fit of all R1ρ relaxation dispersion profiles directly to the model described by eq 6 in order to possibly minimize uncertainties in the fitted activation parameters (Figure S1, red lines). As a consequence of this approach, all derived flip rates now fall directly on the curves describing the model; see the dependence of kflip on T–1 (Figure S2C). The new global fit resulted in Δ‡G0 = (48.4 ± 0.1) kJ mol–1, Δ‡S0 = (5 ± 5) J mol–1 K–1, Δ‡V0 = (24 ± 2) mL mol–1, and Δ‡κ′ = (0.11 ± 0.02) mL mol–1 MPa–1 (Table 2). All values are identical within the margin of error to those determined by the alternative approach described above. Moreover, the estimated errors in the parameters are also highly similar between the two approaches. The largest difference is observed for the activation entropy, where the direct fit to the R1ρ data results in a lower value. As before, Δ‡S0 is not well-determined due to the limited temperature range of our experiments. Nevertheless, Δ‡S0 is positive in both approaches, as expected from theoretical considerations (see above). The extrapolated value of Δ‡V = 0 now occurs at 218 MPa, which is virtually identical to the pressure reported above (215 MPa). The p–T phase diagram resulting from the direct fit to the R1ρ data is shown in Figure 5B. The lower value of Δ‡S0 leads to a less pronounced temperature-dependence compared to Figure 5A, but the main features of the two diagrams are highly similar. In summary, we conclude that the two fitting approaches work equally well and result in very similar activation parameters. In the following, we base our analysis on the parameters corresponding to Figure 5A but provide the values derived from the alternative fit within parentheses where appropriate.
Ring Flips Can Occur without a Net Positive Activation Volume
At 20 °C and ambient pressure, the F52 ring flips occur via an expanded transition state characterized by a volume increase of Δ‡V0 = 46 Å3 (or 40 Å3 from the direct fit to the R1ρ data). Nonetheless, ring flips still take place at higher pressures approaching the region where Δ‡V = 0 and Δ‡G is insensitive to pressure (i.e., the tangent of the contour line is vertical), as shown in Figure 5. Pressure-independent volume fluctuations that do not lead to a net average expansion of the local ring environment enable kflip = 6.9 × 10³ s–1, obtained by extrapolation to 25 °C and 215 MPa, where Δ‡V = 0. This value can be compared to the slowest measured flip rate, kflip = (7.0 ± 0.3) × 103 s–1, obtained at 25 °C and 200 MPa (Table 1). It is important to note that Δ‡V describes the ensemble-averaged difference between the ground and transition states. When Δ‡V = 0, the ring flip does not involve a net average expansion of the protein core. Instead, the required void volume around the ring is created by volume fluctuations that, on average across the ensemble, are compensated by compaction of void volumes. These fluctuations are described by the protein compressibility; see eq 7. The root-mean-square volume fluctuations of the GB1 ground state have been estimated to 0.75% of the total protein volume, or 60 Å3,56 indicating that ring flips can be accommodated by fluctuations at the tail end (>1 standard deviation) of the volume probability distribution. Interestingly, this type of behavior has been predicted from microsecond-long molecular dynamics simulations, where dynamic volume fluctuations lead to “cavity migrations” through the protein core.57
Fluctuations that do lead to a net expansion (Δ‡V > 0) occur at pressures lower than 215 MPa, allowing for increasingly frequent ring flips as Δ‡V increases with decreasing pressure; for reference, extrapolated to 25 °C and ambient pressure, the F52 ring undergoes 23 × 103 flips per second. The result that ring flips can occur without a net activation volume explains in part why ring flips in different proteins appear to show varying activation volumes. In this view, the activation volume does not report on the minimal expansion required for a ring flip to occur but rather on the average net volume increase that leads to a ring flip under given conditions. The present results demonstrate that significant fluctuations in the local packing density persist even at quite high pressure, thus underscoring the highly dynamic nature of proteins. The difference in volume compressibility between the ground state and the transition state, Δ‡κ′, is positive, demonstrating that the transition-state ensemble is more compressible and undergoes greater volume fluctuations than the well-packed ground state. Figure 6 summarizes these results in a schematic fashion.
Figure 6.
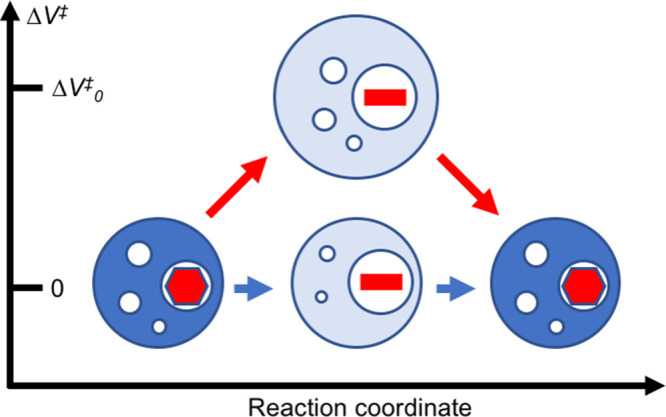
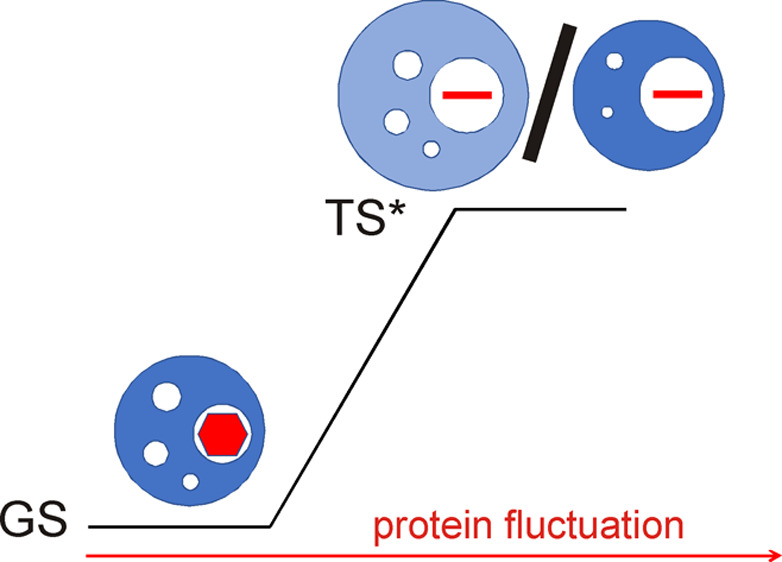
Schematic illustration of aromatic ring flips. The two identical ground states are represented by dark blue spheres with void volumes shown as white spheres and the aromatic rings shown as red hexagons. The transition state is represented by a light blue sphere with the red line representing the aromatic ring in an orientation orthogonal to that of the ground state. The hue of the blue sphere indicates the compressibility, with light and dark blue representing higher and lower compressibility, respectively. At very high pressures (lower pathway, blue arrows), ring flips can occur without a net activation volume (Δ‡V = 0) but with an increase in compressibility of the transition state compared to the ground state (‡κ > κ). At lower pressures (upper pathway, red arrows), ring flips occur with a combination of positive activation volume (Δ‡V > 0) and increased compressibility. The relative size of the circles provides a qualitative illustration of volume changes. The representation is valid only for the ensemble-averaged properties of the ground and transition states.
Protein Component Compressibility of the Transition State
The compressibility of a protein state depends on its intrinsic packing and hydration properties.58 The protein compressibility includes contributions from protein–solvent cross-correlated volume fluctuations that appear to contribute as much as the protein autocorrelated fluctuations.56,59 By measuring the pressure-dependence of ring flips, we are in principle monitoring not only the volume fluctuations and activation volume of the local environment of the aromatic ring but also cross-correlations with other regions outside of its immediate surroundings, which include the solvent shell. However, the present work does not resolve these different contributions to the compressibility, and it is likely that our results primarily report on the surroundings of the aromatic ring.
The value of the volume compressibility change upon activation determined herein, Δ‡κ′ = (130 ± 20) mL mol–1 GPa–1 (or 110 mL mol–1 GPa–1), is on the order of the changes associated with unfolding of globular proteins,38,58,60,61 which might suggest that the compressibility of the transition state is similar to that of the unfolded state. However, this interpretation is highly tentative, because Δ‡κ′ = Δ‡(κV), and the changes in volume might differ considerably between the ring flip and unfolding processes. To estimate the isothermal compressibility coefficient of the transition state, ‡κ = κ + Δ‡κ, we first expand the volume compressibility by differentiation: Δ‡κ′ ≈ κΔ‡V0 + V0Δ‡κ. Next, we use the experimentally measured values of Δ‡κ′ and Δ‡V0 (reported above) together with calculated values for κ and V0 (see below). The ratio Δ‡κ′/Δ‡V0 = 4.7 ± 0.8 GPa–1 ≈ κ + V0Δ‡κ/Δ‡V0κ. This value is about 20 times greater than the value, κ = 0.24 GPa–1, determined for GB1 by molecular dynamics simulations,56 indicating that the term V0Δ‡κ/Δ‡V0 is most likely not negligible. To continue, using the values for κ and Δ‡V0, we obtain V0Δ‡κ ≈ Δ‡κ′ – κΔ‡V0 = 124 mL mol–1 GPa–1 (or 104 mL mol–1 GPa–1). We take V0 to be the volume available to the phenyl ring of F52 in the ground state, represented by the crystal structure 1pgb.62 Using additively weighted Voronoi tessellation as implemented in Voronota,63 we calculate V0 = 125 Å3 = 76 mL/mol. For comparison, this value is on par with volumes previously calculated for aromatic rings in the interior of globular proteins64,65 but greater than the volume of the van der Waals envelope of a phenyl ring (75 Å3) and less than the volume swept out by the rotating ring (164 Å3 = 100 mL/mol).8,13,14,32 Using V0 = 125 Å3, we obtain Δ‡κ = 1.6 GPa–1 (or 1.4 GPa–1) and thus a transition-state compressibility, ‡κ = 1.8 GPa–1 (or 1.6 GPa–1). Notably, this value is similar to the compressibility of organic liquids, e.g., short-chain alkanes at 25 °C.66 Thus, the transition-state ensemble exhibits liquid-like volume fluctuations, a characteristic that has also been inferred for unfolded states,58 indicating that the conformational rearrangements that enable ring flips involve significant unfolding of the local structure through transient “breathing motions” of the protein. We note that very rapid ring flips of the aromatic residues in ubiquitin have been interpreted to suggest liquid-alkane-like properties of the surrounding environment in the ground state.55 Given the high degree of solvent exposure of the aromatic residues in ubiquitin, it might be expected that their local environment is similar to unfolded states. Taken together, the previous and present results show that aromatic ring flip rates can vary drastically depending on the local packing density. Aromatic rings in the interior of globular proteins might require extensive disruption of the local structure in order to flip, whereas surface-exposed rings can undergo large-scale librational motions and flip rapidly.
Conclusions
We have demonstrated that temperature- and pressure-dependent NMR relaxation dispersion experiments provide unique thermodynamic information on the transition state of rare conformational transitions, such as aromatic ring flips. We determined the activation enthalpy (Δ‡H0), entropy (Δ‡S0), volume (Δ‡V0), and isothermal volume compressibility (Δ‡κ′) of aromatic ring flips, which report on the structural and energetic perturbations of the transition state. It is worth noting that our measurements of compressibility are unique in that they report directly on the protein component compressibility of the local ring environment, which should be contrasted with previous experimental measurements that have determined the partial compressibility of the protein solute via concentration-dependent measurements of sound velocity in aqueous solutions.58 It is gratifying that all determined thermodynamic parameters present a consistent view of the transition state. Compared to the ground state, the transition state is expanded (Δ‡V0 > 0) and has fewer stabilizing interactions (Δ‡H0 > 0), populates a greater number of conformations (Δ‡S0 > 0), and has significantly greater compressibility (Δ‡κ > 0). Thus, the aromatic ring flip involves transient “melting” of the surrounding protein structure, which approaches liquid-like features in the transition state.
Our results indicate that ring flips can occur with zero activation volume (Δ‡V = 0), that is, without any difference between the ground-state and transition-state ensemble averages of protein volume. In this case, the required expansion of the local structure occurs via volume fluctuations that, on average across the ensemble, involve a local increase in volume and compensatory compaction of remote void volume (Figure 6). These volume fluctuations enable a baseline of exchange events, which remain at play even at very high pressure (p > 200 MPa). As pressure decreases toward ambient conditions, fluctuations causing net expansion of the protein become increasingly prevalent, leading to more frequent exchange events. Altogether, these results advance our understanding of protein dynamics by detailing the properties of the state and should serve as a benchmark for future computational investigations.
Materials and Methods
Protein Samples
The 2-13C glucose-labeled B1 domain of Staphylococcal protein G (GB1; UniProtKB P06654) was expressed and purified as described elsewhere.67 2-13C-Glucose labeling results in site-selective 13C enrichment at the ε-positions of Phe and Tyr residues.24,27 The sample was dissolved to a concentration of 5 mM in 20 mM HEPES, 90% H2O + 10% D2O, and a small amount of NaN3. The pH was adjusted to 7.0.
NMR Spectroscopy
All experiments were performed on a Bruker Avance III spectrometer operating at a static magnetic field strength of 14.1 T. Aromatic L-optimized TROSY-selected on-resonance 13C R1ρ relaxation dispersion experiments28−31 were acquired at temperatures of 10, 15, 20, 25, 30, 35, and 40 °C and pressures of 0.1, 50, 100, 150, and 200 MPa. In short, the pulse sequence consists of the following steps: insensitive nuclei enhanced by polarization transfer (INEPT) from 1H to 13C, followed by the S3E element to select the TROSY component; a relaxation period divided into two blocks separated by the S3CT selective inversion element; 13C chemical shift evolution during t1; and magnetization transfer back to 1H for detection during t2. In each relaxation block,13C magnetization was aligned along the B1 field axis by 4 ms tan/tanh adiabatic ramps,68 then spin-locked on-resonance using B1 field strengths of 900–4000 Hz, and finally returned to the original state by a time-reversed adiabatic ramp. For each effective field, two separate experiments were acquired with and without the spin-lock relaxation period, from which relaxation rate constants were calculated as R1ρ = ln(Irelax/Iref)/trelax, where Irelax and Iref are the intensities measured in the spectra acquired with and without the relaxation period, respectively, and trelax is the length of the relaxation period. At a given combination of temperature and pressure, the relaxation dispersion data were acquired as an interleaved pseudo-3D experiment, where the effective field strengths were varied prior to incrementing t1.
High-pressure experiments were performed using a commercial 3 mm ceramic cell69 (Daedalus Innovations LLC), connected to a home-built pressure generator, consisting of a water column pressurized by a hand pump. The pressurizing water was separated from the protein solution by a thin layer of paraffin oil.
Data Analysis
NMR spectra were processed with NMRPipe70 and analyzed with PINT.71R1ρ relaxation dispersion data were fitted to the general equation for symmetric exchange derived by Miloushev and Palmer72 using fixed populations, p1 = p2 = 0.5, and treating Δδ as fixed at the value (Δδspectra) measured from heteronuclear single quantum coherence spectroscopy (HSQC) spectra under slow-exchange conditions.13 Chemical shift changes of the observed signal with pressure and temperature are small and linear (Figure S3). The shift difference can be assumed as independent of temperature.5,7−13 Data sets acquired at a given pressure and different temperatures were fitted simultaneously while imposing the restrictions kflip(Thigh) > kflip(Tlow), R2,0(Thigh) ≤ R2,0(Tlow), which are visibly valid at higher temperatures (Figure S1) and required to obtain reliable results under conditions where the ring flip rates reach their highest values. Global fitting of all R1ρ dispersion curves directly to the thermodynamic model (eq 6, see below), involved the restriction R2,0(Thigh) ≤ R2,0(Tlow) on data sets acquired at a given pressure.
Theory of Pressure- and Temperature-Dependence of Ring Flip Dynamics
The rate constant depends on the free energy barrier as described by the Eyring equation
| 1 |
in which kB and h denote Boltzmann’s and Planck’s constants, respectively, and Δ‡G is the Gibbs free energy of activation. To find the overall pressure and temperature dependencies of Δ‡G, one has to integrate the fundamental equation
| 2 |
The entropy and volume depend on temperature and pressure according to
| 3 |
and
| 4 |
where α′ = αV is defined here as the isobaric thermal volume expansivity, α is the expansivity coefficient, κ′ = κV is defined as the isothermal volume compressibility, and κ is the compressibility coefficient.56,73 Note that these quantities are not named consistently throughout the literature.
We thus define the volume expansivity of activation as Δ‡α′ = Δ‡(αV) and the volume compressibility of activation as Δ‡κ′ = Δ‡(κV), with Δ‡ denoting the difference between the transition state and the ground state. Note that Δ‡α′ and Δ‡κ′ are products of two quantities that might both be different between the two states and therefore do not directly report on the expansivity or compressibility of either state. As an approximation, we differentiate the products into Δ‡κ′ ≈ κΔ‡V + VΔ‡κ, etc.
eq 2 can be integrated from an arbitrarily chosen reference point (p0, T0). Neglecting any pressure-dependence of Δ‡S or temperature-dependence of Δ‡V, one obtains
 |
5 |
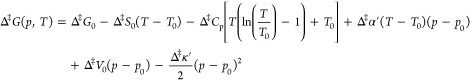
where the subscript 0 indicates the value at (p0, T0). The last three terms in eq 5 gives the change in Δ‡G(p, T) with pressure and are valid only if the changes in Δ‡V0 with pressure and temperature are small, i.e., if the factors Δ‡α′(T–T0) and Δ‡κ′(p–p0) are small. The resulting phase diagram of Δ‡G(p, T) displays an elliptic shape and is divided into four regions according to the signs of Δ‡S0 and Δ‡V0 (Figure 1A). To continue, we assume that Δ‡H as well as Δ‡S are temperature-independent, i.e., Δ‡Cp = 0. We also assume that Δ‡V0 is temperature-independent, i.e., Δ‡α′ = 0, yielding the final expression
| 6 |
Thus, the phase diagram describing the free energy barrier of the ring flip has the shape of a parabola (Figure 1B). It is divided into two segments by the Δ‡V = 0 line as its symmetry axis, which can be calculated from the point of maximal temperature and depicts the pressure where the ring flip process is not associated with any increase in void volume. The vertex of the parabola points toward high or low temperatures for a positive or negative sign of Δ‡S0, respectively. For completeness, κ is related to the magnitude of volume fluctuations as74
| 7 |
Initial Analysis of Temperature- and Pressure-Dependence
Activation parameters of the ring flips were initially determined by nonlinear regression of the flip rates on the temperature T using the Eyring equation, parametrized as
| 8 |
where Δ‡H is the activation enthalpy and Δ‡S is the activation entropy. The activation volume Δ‡V was determined from the pressure-dependence of the flip rates according to
| 9 |
Analysis of p–T Diagram
Activation parameters were determined from global fitting of all flip rate data to eq 1 with Δ‡G expanded according to eq 6 and the reference point (p0, T0) set to atmospheric pressure and 20 °C. Errors in the fitted parameters were estimated using Monte Carlo simulations,75 and the reported errors correspond to one standard deviation. The statistical validation for including Δ‡κ′ was performed as follows. The experimental kflip(p, T) data sets were fitted globally in two ways: first with Δ‡κ′ fixed to 0 (the lower-order model) and then with Δ‡κ′ fitted (the higher-order model). Then ensembles of 1000 kflip(p, T) data sets were generated from the best fitted parameters for each of the models. Random errors with the experimental standard deviation were added to give the two Monte Carlo ensembles {kflip}low and {kflip}high. These data ensembles were then fitted to both models, giving four Monte-Carlo-generated sets with reduced χ2-values: {χν2}low, {χν2}low, {χν2}high, and {χν2}high, where the lower index is the generating function and the upper is the fitting function. The observed F-static describing the relative size of χ2 for the two models is Fobs = χν,low2/χν,high.76 To estimate the type I error, {F}I = {χν2}low/{χν2}low is calculated. None of these 1000 values were larger than Fobs, thus demonstrating a probability pI < 10–3 that Fobs is as large as observed by chance if the lower-order model is the correct one. To estimate the type II error, {F}II = {χν2}high/{χν2}high is calculated. Here, 69 of the 1000 values are smaller than Fobs, demonstrating a probability of about pII = 0.07 that the higher-order model would not reduce χ2 as much as observed even if it is the correct one. As an alternative approach, global fitting of eqs 1 and 6 directly to all R1ρ data was performed with error estimation by Monte Carlo simulations as described above.
Volume Calculations
We calculated the volume available to the phenyl ring of F52 in the ground state, represented by the crystal structure of GB1 (PDB entity 1pgb),62 using the algorithm for additively weighted Voronoi tessellation implemented in the software Voronota.63
Acknowledgments
This research was supported by the Deutsche Forschungsgemeinschaft (WE 5587/1-1) and the Swedish Research Council (2018-4995).
Supporting Information Available
The Supporting Information is available free of charge at https://pubs.acs.org/doi/10.1021/jacsau.1c00062.
All experimental 13C aromatic R1ρ relaxation dispersion profiles for F52ε; temperature- and pressure-dependence of flip rates fitted with and without Δ‡κ′ and the corresponding graph resulting from a global fit of R1ρ relaxation dispersion profiles directly to the thermodynamic model; temperature- and pressure-dependence of chemical shifts for the averaged signal of F52ε (PDF)
The authors declare no competing financial interest.
Supplementary Material
References
- Mittermaier A. K.; Kay L. E. Observing biological dynamics at atomic resolution using NMR. Trends Biochem. Sci. 2009, 34 (12), 601–611. 10.1016/j.tibs.2009.07.004. [DOI] [PubMed] [Google Scholar]
- Boehr D. D.; McElheny D.; Dyson H. J.; Wright P. E. The dynamic energy landscape of dihydrofolate reductase catalysis. Science 2006, 313 (5793), 1638–1642. 10.1126/science.1130258. [DOI] [PubMed] [Google Scholar]
- Eisenmesser E. Z.; Bosco D. A.; Akke M.; Kern D. Enzyme dynamics during catalysis. Science 2002, 295 (5559), 1520–1523. 10.1126/science.1066176. [DOI] [PubMed] [Google Scholar]
- Wüthrich K. The way to NMR structures of proteins. Nat. Struct. Biol. 2001, 8 (11), 923–925. 10.1038/nsb1101-923. [DOI] [PubMed] [Google Scholar]
- Campbell I. D.; Dobson C. M.; Williams R. J. P. Proton Magnetic-Resonance Studies of Tyrosine Residues of Hen Lysozyme-Assignment and Detection of Conformational Mobility. Proc. Royal Soc. B 1975, 189 (1097), 503–509. [DOI] [PubMed] [Google Scholar]
- Hull W. E.; Sykes B. D. Fluorotyrosine Alkaline-Phosphatase - Internal Mobility of Individual Tyrosines and Role of Chemical-Shift Anisotropy as a F-19 Nuclear Spin Relaxation Mechanism in Proteins. J. Mol. Biol. 1975, 98 (1), 121–153. 10.1016/S0022-2836(75)80105-7. [DOI] [PubMed] [Google Scholar]
- Wagner G.; Demarco A.; Wüthrich K. Dynamics of Aromatic Amino-Acid Residues in Globular Conformation of Basic Pancreatic Trypsin-Inhibitor (Bpti) 0.1. H-1 Nmr-Studies. Biophys. Struct. Mech. 1976, 2 (2), 139–158. 10.1007/BF00863706. [DOI] [PubMed] [Google Scholar]
- Hattori M.; Li H.; Yamada H.; Akasaka K.; Hengstenberg W.; Gronwald W.; Kalbitzer H. R. Infrequent cavity-forming fluctuations in HPr from Staphylococcus carnosus revealed by pressure- and temperature-dependent tyrosine ring flips. Protein Sci. 2004, 13 (12), 3104–3114. 10.1110/ps.04877104. [DOI] [PMC free article] [PubMed] [Google Scholar]
- Nall B. T.; Zuniga E. H. Rates and Energetics of Tyrosine Ring Flips in Yeast Iso-2-Cytochrome-C. Biochemistry 1990, 29 (33), 7576–7584. 10.1021/bi00485a006. [DOI] [PubMed] [Google Scholar]
- Skalicky J. J.; Mills J. L.; Sharma S.; Szyperski T. Aromatic ring-flipping in supercooled water: Implications for NMR-based structural biology of proteins. J. Am. Chem. Soc. 2001, 123 (3), 388–397. 10.1021/ja003220l. [DOI] [PubMed] [Google Scholar]
- Weininger U.; Modig K.; Akke M. Ring Flips Revisited: C-13 Relaxation Dispersion Measurements of Aromatic Side Chain Dynamics and Activation Barriers in Basic Pancreatic Trypsin Inhibitor. Biochemistry 2014, 53 (28), 4519–4525. 10.1021/bi500462k. [DOI] [PubMed] [Google Scholar]
- Yang C. J.; Takeda M.; Terauchi T.; Jee J.; Kainosho M. Differential Large-Amplitude Breathing Motions in the Interface of FKBP12-Drug Complexes. Biochemistry 2015, 54 (47), 6983–6995. 10.1021/acs.biochem.5b00820. [DOI] [PubMed] [Google Scholar]
- Dreydoppel M.; Raum H. N.; Weininger U. Slow ring flips in aromatic cluster of GB1 studied by aromatic C-13 relaxation dispersion methods. J. Biomol. NMR 2020, 74 (2–3), 183–191. 10.1007/s10858-020-00303-3. [DOI] [PMC free article] [PubMed] [Google Scholar]
- Li H.; Yamada H.; Akasaka K. Effect of pressure on the tertiary structure and dynamics of folded basic pancreatic trypsin inhibitor. Biophys. J. 1999, 77 (5), 2801–2812. 10.1016/S0006-3495(99)77112-2. [DOI] [PMC free article] [PubMed] [Google Scholar]
- Wagner G.; Bruhwiler D.; Wüthrich K. Reinvestigation of the Aromatic Side-Chains in the Basic Pancreatic Trypsin-Inhibitor by Heteronuclear Two-Dimensional Nuclear-Magnetic-Resonance. J. Mol. Biol. 1987, 196 (1), 227–231. 10.1016/0022-2836(87)90524-9. [DOI] [PubMed] [Google Scholar]
- Weininger U.; Respondek M.; Löw C.; Akke M. Slow Aromatic Ring Flips Detected Despite Near-Degenerate NMR Frequencies of the Exchanging Nuclei. J. Phys. Chem. B 2013, 117 (31), 9241–9247. 10.1021/jp4058065. [DOI] [PubMed] [Google Scholar]
- Baturin S. J.; Okon M.; McIntosh L. P. Structure, dynamics, and ionization equilibria of the tyrosine residues in Bacillus circulans xylanase. J. Biomol. NMR 2011, 51 (3), 379–394. 10.1007/s10858-011-9564-7. [DOI] [PubMed] [Google Scholar]
- Rao D. K.; Bhuyan A. K. Complexity of aromatic ring-flip motions in proteins: Y97 ring dynamics in cytochrome c observed by cross-relaxation suppressed exchange NMR spectroscopy. J. Biomol. NMR 2007, 39 (3), 187–196. 10.1007/s10858-007-9186-2. [DOI] [PubMed] [Google Scholar]
- Gauto D. F.; Macek P.; Barducci A.; Fraga H.; Hessel A.; Terauchi T.; Gajan D.; Miyanoiri Y.; Boisbouvier J.; Lichtenecker R.; Kainosho M.; Schanda P. Aromatic Ring Dynamics, Thermal Activation, and Transient Conformations of a 468 kDa Enzyme by Specific H-1-C-13 Labeling and Fast Magic-Angle Spinning NMR. J. Am. Chem. Soc. 2019, 141 (28), 11183–11195. 10.1021/jacs.9b04219. [DOI] [PMC free article] [PubMed] [Google Scholar]
- Sathyamoorthy B.; Singarapu K. K.; Garcia A. E.; Szyperski T. Protein Conformational Space Populated in Solution Probed with Aromatic Residual Dipolar C-13-H-1 Couplings. ChemBioChem 2013, 14 (6), 684–688. 10.1002/cbic.201300016. [DOI] [PubMed] [Google Scholar]
- Kasinath V.; Valentine K. G.; Wand A. J. A C-13 Labeling Strategy Reveals a Range of Aromatic Side Chain Motion in Calmodulin. J. Am. Chem. Soc. 2013, 135 (26), 9560–9563. 10.1021/ja4001129. [DOI] [PMC free article] [PubMed] [Google Scholar]
- Lichtenecker R. J. Synthesis of aromatic C-13/H-2-alpha-ketoacid precursors to be used in selective phenylalanine and tyrosine protein labelling. Org. Biomol. Chem. 2014, 12 (38), 7551–7560. 10.1039/C4OB01129E. [DOI] [PubMed] [Google Scholar]
- Lichtenecker R. J.; Weinhaupl K.; Schmid W.; Konrat R. alpha-Ketoacids as precursors for phenylalanine and tyrosine labelling in cell-based protein overexpression. J. Biomol. NMR 2013, 57 (4), 327–331. 10.1007/s10858-013-9796-9. [DOI] [PubMed] [Google Scholar]
- Lundström P.; Teilum K.; Carstensen T.; Bezsonova I.; Wiesner S.; Hansen D. F.; Religa T. L.; Akke M.; Kay L. E. Fractional C-13 enrichment of isolated carbons using [1-C-13]- or [2-C-13]-glucose facilitates the accurate measurement of dynamics at backbone C-alpha and side-chain methyl positions in proteins. J. Biomol. NMR 2007, 38 (3), 199–212. 10.1007/s10858-007-9158-6. [DOI] [PubMed] [Google Scholar]
- Teilum K.; Brath U.; Lundström P.; Akke M. Biosynthetic C-13 labeling of aromatic side chains in proteins for NMR relaxation measurements. J. Am. Chem. Soc. 2006, 128 (8), 2506–2507. 10.1021/ja055660o. [DOI] [PubMed] [Google Scholar]
- Weininger U. Site-selective 13C labeling of proteins using erythrose. J. Biomol. NMR 2017, 67 (3), 191–200. 10.1007/s10858-017-0096-7. [DOI] [PMC free article] [PubMed] [Google Scholar]
- Weininger U. Optimal Isotope Labeling of Aromatic Amino Acid Side Chains for NMR Studies of Protein Dynamics. Methods Enzymol. 2019, 614, 67–86. 10.1016/bs.mie.2018.08.028. [DOI] [PubMed] [Google Scholar]
- Weininger U.; Brath U.; Modig K.; Teilum K.; Akke M. Off-resonance rotating-frame relaxation dispersion experiment for C-13 in aromatic side chains using L-optimized TROSY-selection. J. Biomol. NMR 2014, 59 (1), 23–29. 10.1007/s10858-014-9826-2. [DOI] [PMC free article] [PubMed] [Google Scholar]
- Weininger U.; Respondek M.; Akke M. Conformational exchange of aromatic side chains characterized by L-optimized TROSY-selected C-13 CPMG relaxation dispersion. J. Biomol. NMR 2012, 54 (1), 9–14. 10.1007/s10858-012-9656-z. [DOI] [PMC free article] [PubMed] [Google Scholar]
- Raum H. N.; Dreydoppel M.; Weininger U. Conformational exchange of aromatic side chains by (1)H CPMG relaxation dispersion. J. Biomol. NMR 2018, 72 (1–2), 105–114. 10.1007/s10858-018-0210-5. [DOI] [PMC free article] [PubMed] [Google Scholar]
- Raum H. N.; Schorghuber J.; Dreydoppel M.; Lichtenecker R. J.; Weininger U. Site-selective (1)H/(2)H labeling enables artifact-free (1)H CPMG relaxation dispersion experiments in aromatic side chains. J. Biomol. NMR 2019, 73 (10–11), 633–639. 10.1007/s10858-019-00275-z. [DOI] [PMC free article] [PubMed] [Google Scholar]
- Wagner G. Activation Volumes for the Rotational Motion of Interior Aromatic Rings in Globular-Proteins Determined by High-Resolution H-1-Nmr at Variable Pressure. FEBS Lett. 1980, 112 (2), 280–284. 10.1016/0014-5793(80)80198-0. [DOI] [PubMed] [Google Scholar]
- Akasaka K.; Kitahara R.; Kamatari Y. O. Exploring the folding energy landscape with pressure. Arch. Biochem. Biophys. 2013, 531 (1–2), 110–5. 10.1016/j.abb.2012.11.016. [DOI] [PubMed] [Google Scholar]
- Luong T. Q.; Kapoor S.; Winter R. Pressure-A Gateway to Fundamental Insights into Protein Solvation, Dynamics, and Function. ChemPhysChem 2015, 16 (17), 3555–3571. 10.1002/cphc.201500669. [DOI] [PubMed] [Google Scholar]
- Kalbitzer H. R. High Pressure NMR Methods for Characterizing Functional Substates of Proteins. Subcell. Biochem. 2015, 72, 179–197. 10.1007/978-94-017-9918-8_9. [DOI] [PubMed] [Google Scholar]
- Ando N.; Barstow B.; Baase W. A.; Fields A.; Matthews B. W.; Gruner S. M. Structural and thermodynamic characterization of T4 lysozyme mutants and the contribution of internal cavities to pressure denaturation. Biochemistry 2008, 47 (42), 11097–11109. 10.1021/bi801287m. [DOI] [PMC free article] [PubMed] [Google Scholar]
- Weber G.; Drickamer H. G. The Effect of High-Pressure Upon Proteins and Other Biomolecules. Q. Rev. Biophys. 1983, 16 (1), 89–112. 10.1017/S0033583500004935. [DOI] [PubMed] [Google Scholar]
- Klamt A.; Nagarathinam K.; Tanabe M.; Kumar A.; Balbach J. Hyperbolic Pressure-Temperature Phase Diagram of the Zinc-Finger Protein apoKti11Detected by NMR Spectroscopy. J. Phys. Chem. B 2019, 123 (4), 792–801. 10.1021/acs.jpcb.8b11019. [DOI] [PubMed] [Google Scholar]
- Roche J.; Caro J. A.; Norberto D. R.; Barthe P.; Roumestand C.; Schlessman J. L.; Garcia A. E.; Garcia-Moreno E B.; Royer C. A. Cavities determine the pressure unfolding of proteins. Proc. Natl. Acad. Sci. U. S. A. 2012, 109 (18), 6945–6950. 10.1073/pnas.1200915109. [DOI] [PMC free article] [PubMed] [Google Scholar]
- Hawley S. A. Reversible Pressure-Temperature Denaturation of Chymotrypsinogen. Biochemistry 1971, 10 (13), 2436–2442. 10.1021/bi00789a002. [DOI] [PubMed] [Google Scholar]
- Akasaka K.; Tezuka T.; Yamada H. Pressure-induced changes in the folded structure of lysozyme. J. Mol. Biol. 1997, 271 (5), 671–8. 10.1006/jmbi.1997.1208. [DOI] [PubMed] [Google Scholar]
- Dreydoppel M.; Becker P.; Raum H. N.; Gröger S.; Balbach J.; Weininger U. Equilibrium and Kinetic Unfolding of GB1: Stabilization of the Native State by Pressure. J. Phys. Chem. B 2018, 122 (38), 8846–8852. 10.1021/acs.jpcb.8b06888. [DOI] [PubMed] [Google Scholar]
- Munte C. E.; Beck Erlach M.; Kremer W.; Koehler J.; Kalbitzer H. R. Distinct Conformational States of the Alzheimer -Amyloid Peptide Can Be Detected by High-Pressure NMR Spectroscopy. Angew. Chem., Int. Ed. 2013, 52 (34), 8943–8947. 10.1002/anie.201301537. [DOI] [PubMed] [Google Scholar]
- Nisius L.; Grzesiek S. Key stabilizing elements of protein structure identified through pressure and temperature perturbation of its hydrogen bond network. Nat. Chem. 2012, 4 (9), 711–717. 10.1038/nchem.1396. [DOI] [PubMed] [Google Scholar]
- Roche J.; Royer C. A.; Roumestand C. Monitoring protein folding through high pressure NMR spectroscopy. Prog. Nucl. Magn. Reson. Spectrosc. 2017, 102, 15–31. 10.1016/j.pnmrs.2017.05.003. [DOI] [PubMed] [Google Scholar]
- Vajpai N.; Nisius L.; Wiktor M.; Grzesiek S. High-pressure NMR reveals close similarity between cold and alcohol protein denaturation in ubiquitin. Proc. Natl. Acad. Sci. U. S. A. 2013, 110 (5), E368–E376. 10.1073/pnas.1212222110. [DOI] [PMC free article] [PubMed] [Google Scholar]
- Caro J. A.; Wand A. J. Practical aspects of high-pressure NMR spectroscopy and its applications in protein biophysics and structural biology. Methods 2018, 148, 67–80. 10.1016/j.ymeth.2018.06.012. [DOI] [PMC free article] [PubMed] [Google Scholar]
- Wilton D. J.; Kitahara R.; Akasaka K.; Pandya M. J.; Williamson M. P. Pressure-Dependent Structure Changes in Barnase on Ligand Binding Reveal Intermediate Rate Fluctuations. Biophys. J. 2009, 97 (5), 1482–1490. 10.1016/j.bpj.2009.06.022. [DOI] [PMC free article] [PubMed] [Google Scholar]
- Wilton D. J.; Tunnicliffe R. B.; Kamatari Y. O.; Akasaka K.; Williamson M. P. Pressure-induced changes in the solution structure of the GB1 domain of protein G. Proteins: Struct., Funct., Genet. 2008, 71 (3), 1432–1440. 10.1002/prot.21832. [DOI] [PubMed] [Google Scholar]
- Zhang Y.; Kitazawa S.; Peran I.; Stenzoski N.; McCallum S. A.; Raleigh D. P.; Royer C. A. High Pressure ZZ-Exchange NMR Reveals Key Features of Protein Folding Transition States. J. Am. Chem. Soc. 2016, 138 (46), 15260–15266. 10.1021/jacs.6b09887. [DOI] [PubMed] [Google Scholar]
- Alderson T. R.; Charlier C.; Torchia D. A.; Anfinrud P.; Bax A. Monitoring Hydrogen Exchange During Protein Folding by Fast Pressure Jump NMR Spectroscopy. J. Am. Chem. Soc. 2017, 139 (32), 11036–11039. 10.1021/jacs.7b06676. [DOI] [PMC free article] [PubMed] [Google Scholar]
- Charlier C.; Alderson T. R.; Courtney J. M.; Ying J. F.; Anfinrud P.; Bax A. Study of protein folding under native conditions by rapidly switching the hydrostatic pressure inside an NMR sample cell. Proc. Natl. Acad. Sci. U. S. A. 2018, 115 (18), E4169–E4178. 10.1073/pnas.1803642115. [DOI] [PMC free article] [PubMed] [Google Scholar]
- Bezsonova I.; Korzhnev D. M.; Prosser R. S.; Forman-Kay J. D.; Kay L. E. Hydration and packing along the folding pathway of SH3 domains by pressure-dependent NMR. Biochemistry 2006, 45 (15), 4711–4719. 10.1021/bi060177r. [DOI] [PubMed] [Google Scholar]
- Tugarinov V.; Libich D. S.; Meyer V.; Roche J.; Clore G. M. The Energetics of a Three-State Protein Folding System Probed by High-Pressure Relaxation Dispersion NMR Spectroscopy. Angew. Chem., Int. Ed. 2015, 54 (38), 11157–11161. 10.1002/anie.201505416. [DOI] [PMC free article] [PubMed] [Google Scholar]
- Kasinath V.; Fu Y. N.; Sharp K. A.; Wand A. J. A Sharp Thermal Transition of Fast Aromatic-Ring Dynamics in Ubiquitin. Angew. Chem., Int. Ed. 2015, 54 (1), 102–7. 10.1002/anie.201408220. [DOI] [PMC free article] [PubMed] [Google Scholar]
- Persson F.; Halle B. Compressibility of the protein-water interface. J. Chem. Phys. 2018, 148 (21), 215102. 10.1063/1.5026774. [DOI] [PubMed] [Google Scholar]
- Schiffer J. M.; Feher V. A.; Malmstrom R. D.; Sida R.; Amaro R. E. Capturing Invisible Motions in the Transition from Ground to Rare Excited States of T4 Lysozyme L99A. Biophys. J. 2016, 111 (8), 1631–1640. 10.1016/j.bpj.2016.08.041. [DOI] [PMC free article] [PubMed] [Google Scholar]
- Taulier N.; Chalikian T. V. Compressibility of protein transitions. Biochim. Biophys. Acta, Protein Struct. Mol. Enzymol. 2002, 1595 (1–2), 48–70. 10.1016/S0167-4838(01)00334-X. [DOI] [PubMed] [Google Scholar]
- Marchi M. Compressibility of cavities and biological water from Voronoi volumes in hydrated proteins. J. Phys. Chem. B 2003, 107 (27), 6598–6602. 10.1021/jp0342935. [DOI] [Google Scholar]
- Lassalle M. W.; Yamada H.; Akasaka K. The pressure-temperature free energy-landscape of staphylococcal nuclease monitored by H-1 NMR. J. Mol. Biol. 2000, 298 (2), 293–302. 10.1006/jmbi.2000.3659. [DOI] [PubMed] [Google Scholar]
- Prehoda K. E.; Mooberry E. S.; Markley J. L. Pressure denaturation of proteins: Evaluation of compressibility effects. Biochemistry 1998, 37 (17), 5785–5790. 10.1021/bi980384u. [DOI] [PubMed] [Google Scholar]
- Gallagher T.; Alexander P.; Bryan P.; Gilliland G. L. 2 Crystal-Structures of the B1 Immunoglobulin-Binding Domain of Streptococcal Protein-G and Comparison with Nmr. Biochemistry 1994, 33 (15), 4721–4729. 10.1021/bi00181a032. [DOI] [PubMed] [Google Scholar]
- Olechnovic K.; Venclovas C. Voronota: A Fast and Reliable Tool for Computing the Vertices of the Voronoi Diagram of Atomic Balls. J. Comput. Chem. 2014, 35 (8), 672–681. 10.1002/jcc.23538. [DOI] [PubMed] [Google Scholar]
- Richards F. M. Interpretation of Protein Structures - Total Volume, Group Volume Distributions and Packing Density. J. Mol. Biol. 1974, 82 (1), 1–14. 10.1016/0022-2836(74)90570-1. [DOI] [PubMed] [Google Scholar]
- Tsai J.; Taylor R.; Chothia C.; Gerstein M. The packing density in proteins: Standard radii and volumes. J. Mol. Biol. 1999, 290 (1), 253–266. 10.1006/jmbi.1999.2829. [DOI] [PubMed] [Google Scholar]
- Rumble J. R.CRC handbook of chemistry and physics, 101st ed.; CRC Press/Taylor & Francis Group: Boca Raton, 2020. [Google Scholar]
- Lindman S.; Xue W. F.; Szczepankiewicz O.; Bauer M. C.; Nilsson H.; Linse S. Salting the charged surface: pH and salt dependence of protein G B1 stability. Biophys. J. 2006, 90 (8), 2911–21. 10.1529/biophysj.105.071050. [DOI] [PMC free article] [PubMed] [Google Scholar]
- Mulder F. A. A.; de Graaf R. A.; Kaptein R.; Boelens R. An off-resonance rotating frame relaxation experiment for the investigation of macromolecular dynamics using adiabatic rotations. J. Magn. Reson. 1998, 131 (2), 351–357. 10.1006/jmre.1998.1380. [DOI] [PubMed] [Google Scholar]
- Peterson R. W.; Wand A. J. Self contained high pressure cell, apparatus and procedure for the preparation of encapsulated proteins dissolved in low viscosity fluids for NMR spectroscopy. Rev. Sci. Instrum. 2005, 76 (9), 094101. 10.1063/1.2038087. [DOI] [PMC free article] [PubMed] [Google Scholar]
- Delaglio F.; Grzesiek S.; Vuister G. W.; Zhu G.; Pfeifer J.; Bax A. Nmrpipe - a Multidimensional Spectral Processing System Based on Unix Pipes. J. Biomol. NMR 1995, 6 (3), 277–293. 10.1007/BF00197809. [DOI] [PubMed] [Google Scholar]
- Ahlner A.; Carlsson M.; Jonsson B. H.; Lundström P. PINT: a software for integration of peak volumes and extraction of relaxation rates. J. Biomol. NMR 2013, 56 (3), 191–202. 10.1007/s10858-013-9737-7. [DOI] [PubMed] [Google Scholar]
- Nair S. K.; Christianson D. W. Unexpected Ph-Dependent Conformation of His-64, the Proton Shuttle of Carbonic Anhydrase-Ii. J. Am. Chem. Soc. 1991, 113 (25), 9455–9458. 10.1021/ja00025a005. [DOI] [Google Scholar]
- Imai T.; Nomura H.; Kinoshita M.; Hirata F. Partial molar volume and compressibility of alkali-halide ions in aqueous solution: Hydration shell analysis with an integral equation theory of molecular liquids. J. Phys. Chem. B 2002, 106 (29), 7308–7314. 10.1021/jp014504a. [DOI] [Google Scholar]
- Landau L. D.; Lifshits E. M.. Statistical physics Pt. 1, 3rd ed.; Butterworth-Heinemann: Oxford, 1980. [Google Scholar]
- Press W. H.; Teukolsky S. A.; Vetterling W. T.; Flannery B. P.. Numerical recipes in C++: the art of scientific computing, 2nd ed.; Cambridge University Press: Cambridge, 2002. [Google Scholar]
- Bevington P. R.; Robinson D. K.. Data reduction and error analysis for the physical sciences, 3rd ed.; McGraw-Hill: Boston, 2002. [Google Scholar]
Associated Data
This section collects any data citations, data availability statements, or supplementary materials included in this article.