

Abstract
Unraveling the atomistic structures of electric double layers (EDL) at electrified interfaces is of paramount importance for understanding the mechanisms of electrocatalytic reactions and rationally designing electrode materials with better performance. Despite numerous efforts dedicated in the past, a molecular level understanding of the EDL is still lacking. Combining the state-of-the-art ab initio molecular dynamics (AIMD) and recently developed computational standard hydrogen electrode (cSHE) method, it is possible to realistically simulate the EDL under well-defined electrochemical conditions. In this work, we report extensive AIMD calculation of the electrified Pt(111)-Had/water interfaces at the saturation coverage of adsorbed hydrogen (Had) corresponding to the typical hydrogen evolution reaction conditions. We calculate the electrode potentials of a series of EDL models with various surface charge densities using the cSHE method and further obtain the Helmholtz capacitance that agrees with experiment. Furthermore, the AIMD simulations allow for detailed structural analyses of the electrified interfaces, such as the distribution of adsorbate Had and the structures of interface water and counterions, which can in turn explain the computed dielectric property of interface water. Our calculation provides valuable molecular insight into the electrified interfaces and a solid basis for understanding a variety of electrochemical processes occurring inside the EDL.
Keywords: electric double layer, interface structure, capacitance, hydrogen evolution reaction, pH effect
1. Introduction
Electrochemical devices enable energy conversion between chemicals and electricity, and one of their key components includes the interfaces immersed between the electrodes and the solution, where Faradaic processes occur. In order to understand the mechanisms of interfacial reactions and thereby rationally design electrode materials, the structures of electrochemical interfaces have been extensively studied both experimentally and theoretically.1−8 Measuring differential double-layer capacitance from voltammetry is one of the traditional means in electrochemistry to investigate the interfaces,9 which enables the early establishment of the well-known Gouy–Chapman–Stern (GCS) model for the electric double layers (EDL). To obtain a detailed microscopic picture of the electrochemical interfaces, many advanced experimental techniques have been developed in the past few decades, including surface enhanced infrared spectroscopy,6,10,11 Raman spectroscopy,5,12,13 sum frequency generation spectroscopy,14,15 X-ray absorption spectroscopy,2 and surface X-ray scattering.16,17 They have been very helpful for revealing the hydrogen bonding network of interface water,2,5,14 density distribution of ions and water,4,16,17 coverages and adsorption sites of surface adsorbates,18,19 and so on.
Theoretical computation, as a complementary tool to experimental techniques, also plays an important role in studying the structures of the electrochemical interfaces.5,7,20−27 For example, with the aid of ab initio molecular dynamics (AIMD) simulations, it has been shown that there exists a layer of chemisorbed water on metal electrodes such as Pd and Pt,23,28 which can induce electronic redistribution and significant potential shifts at the interfaces. More interestingly, it has been found recently that the coverage of the chemisorbed water is strongly dependent on the electrode potential at the Pt(111)/water interface.29 This can result in a peculiar negative component of Helmholtz capacitance, providing a molecular insight into the bell-shaped profile of the differential double-layer capacitance measured by experiment.30 It should be mentioned that the work29 focused on the double-layer region at the Pt(111)/water interface (0.4–0.6 V vs RHE),31 and hence, specifically adsorbed ions such as adsorbed H and OH were omitted in the models.
In the nondouble-layer region, e.g. < 0.4 V vs RHE, the Pt(111) surface is covered by certain amount of adsorbed H (Had). One would logically anticipate that the Had could compete for the surface chemisorption sites with water and hence would affect the interface structure and double-layer capacitance. Moreover, the Had on the electrode surface is the key intermediate of hydrogen evolution reaction (HER) and hydrogen oxidation reaction (HOR), and its adsorption energy is widely used as a descriptor for the reaction activity.32−36 In view of these interests, many efforts have been devoted to modeling the Pt(111)-Had/water interfaces in recent years.37−40 For example, Kristoffersen et al.39 have shown that the Had atoms are mostly distributed on the hollow and top sites on Pt(111) and effectively replace the chemisorbed water on the surface. It has been also reported that the Had on Pt(111) can ionize spontaneously at the high Had coverage condition during AIMD runs.37,39 Kronberg and Laasonen40 have found the presence of Had on Pt(111) surface can apparently accelerate the dynamics of the interface water. However, the EDL has not been realistically represented in their interface models, and as such, the electrochemical conditions are not well-defined, rendering it difficult to make direct comparison with experiment.
In this work, to unravel the microscopic structures of electrified Pt(111)-Had/water interfaces, the EDL is modeled at different potentials using AIMD simulations. The EDL is built by employing counterions at the vicinity of the surface to compensate the surface charge, representing a realistic Helmholtz layer. A detailed description of the interface model and the computational setup are given in the following Methods section. In the Results and Discussion section, we first calculate the Helmholtz capacitance of the Pt(111)-Had/water interface and compare with experimental data for validating the EDL model and the accuracy of the AIMD simulations. We then investigate the distribution of Had adsorption sites, interface water, and counterions on the Pt(111) surface at different potentials. In particular, we find that the saturation coverage of Had completely inhibits water chemisorption, thus removing the negative capacitive response owing to water adsorption/desorption processes at the interface, and giving rise to a ∼ 20 μF/cm2 Helmholtz capacitance consistent with the experimental value in the hydrogen underpotential deposition potential region. Finally, we end this paper with some conclusions.
2. Methods
2.1. Electrified Interface Models
The Pt(111) surface was modeled with a p(6 × 6) periodic slab of 4 atomic layers, and separated from its periodic images with a vacuum region. The overall size of the cell of the Pt(111) surface was 16.869 × 16.869 × 30 Å3, and the calculated work function (5.8 eV) was very close to the experimental value.41,42 Both sides of the clean Pt(111) surface model were then covered by 2/3 monolayer (ML) Had, which was suggested by Markovic43 as the saturation coverage of the H deposited at underpotential (Hupd) on Pt(111). The electrified Pt(111)-Had/water interfaces were modeled by fully filling the vacuum region with water molecules (the water density of the bulk region was kept close to 1 g/cm3). To represent Helmholtz layers in the models, Na atoms were initially placed at the vicinity of both Pt(111)-Had surfaces, as shown in Figure 1. It should be mentioned the Na ions do not diffuse into the bulk water in the time scale of ∼10 ps due to electrostatic attraction by the charged surface. It has been indicated in Figure S2 that the Na atoms are indeed ionized, and the Mulliken population analysis shows the charge of Na at Pt(111)-Had/water interfaces is ∼+0.85 e0. Since the overall model is kept charge neutral, the Pt(111)-Had surfaces are accordingly negatively charged. Varying the number of Na+ ions in the model amounts to controlling the surface charge density (σ), and with this approach, four electrified Pt(111)-Had/water interface models were built up with σ = −13, −19.5, −26, and −32.5 μC/cm–2, respectively. A neutral Pt(111)-Had/water interface was also modeled, and it was found that a few Had atoms on the surface are spontaneously ionized, forming hydronium ions at the interface. This indicates that the Had atoms are not stable at the neutral Pt(111)-Had/water interface. In addition, it should be mentioned that the Gouy–Chapman layers are not included in the interface models, and thus, our EDL models correspond to the high concentration limit when the surface charges are effectively balanced within the Helmholtz layer. The ion pairs in the bulk electrolyte are also ignored for accelerating the equilibrium of the interface because the interfacial potential is determined by the charge excess in the double layer, not the charge balanced ion pairs, and the capacitive behavior of the Helmholtz layer should not be considerably affected by missing of bulk electrolyte ions. Separating from the longer timescale of ion exchange with bulk solution, we did not observe the counterions diffusing away from the interface in our AIMD simulations of tens of ps, which in some sense resembles the equilibrium situation that there is dynamic ion flux but with no net charge passing the EDL boundary. Similar EDL models have been successfully used to simulate the Au(111) and Pt(111)/water interfaces.5,29
Figure 1.
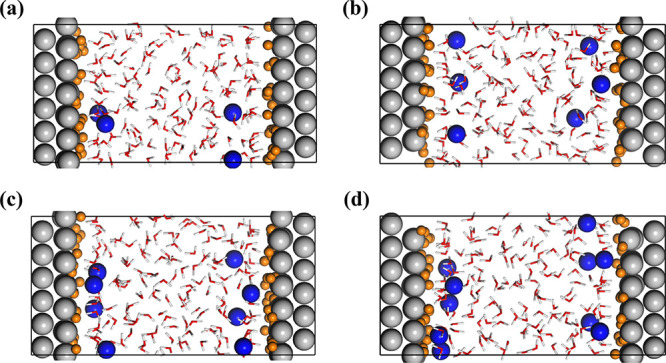
AIMD models of the electrified Pt(111)-Had/water interfaces with surface charge density (a) σ = −13 μC/cm–2, (b) σ = −19.5 μC/cm–2, (c) σ = −26 μC/cm–2, and (d) σ = −32.5 μC/cm–2. The Pt, O, Hw (H of water), Na, and Had (adsorbed H) atoms are colored by gray, red, white, blue, and orange, respectively. The Pt(111) surface is saturated with a 2/3 monolayer of Had.
2.2. Computational Details
All the calculations were performed with freely available CP2K/Quickstep package.44 The DFT implemented in CP2K is based on a hybrid Gaussian plane wave (GPW) scheme. The orbitals were described by an atom centered Gaussian-type basis set, and an auxiliary plane wave basis set was used to re-expand the electron density in the reciprocal space. The 2s, 2p electrons of O, 2s, 2p, 3s electrons of Na, and 5d, 6s electrons of Pt were treated as valence, and the remaining core electrons were represented by Goedecker–Teter–Hutter (GTH) pseudopotentials.45,46 The Gaussian basis sets were double-ζ with one set of polarization functions (DZVP),47 and the energy cutoff was set to 400 Ry. We employed the Perdew–Burke–Ernzerhof (PBE) functional48 to describe the exchange-correlation effects, and the dispersion correction was applied in all calculations with the Grimme D3 method.49
One of the AIMD families, the second generation Car–Parrinello molecular dynamics (SGCPMD)27,50,51 was used to sample configurations for these interface models, and the target temperature was set to 330 K. The correction step was obtained by 5 iterations of the orbital transformation (OT) optimization,52 and the integration time for each MD step was 0.5 fs. The Langevin friction coefficient (γL) was set to 0.001 fs–1, and the intrinsic friction coefficients (γD) were 5 × 10⁵ fs–1 for Pt, 2.2 × 10⁴ fs–1 for H2O and Na, and 2.2 × 10³ fs–1 for Had, respectively. For each AIMD simulation, an initial ∼5 ps (∼10 000 steps) of MD trajectory was used to equilibrate the system, which was then followed by a production period of ∼10 ps (∼20 000 steps) for data analysis. Because of the large size of the cells, only the Γ point in the reciprocal space was used in all the simulations. The velocity density of states (VDOS) of Had was calculated by the Fourier transformation of the velocity-velocity autocorrelation function from the AIMD trajectories. Note that the inner two layers of the Pt(111) slab were fixed during AIMD simulations, and to prevent water dissociation, all the O–H bonds of water were constrained by harmonic springs. In order to check if the constraint on the O–H bonds has any noticeable effect on the Pt(111)-Had/water interfaces, an independent simulation was performed, in which the O–H bonds of the water were relaxed. As shown in Table S1 and Figure S3, the difference in the electrode potential, the structure of water and Had are indeed very small by comparing the results from the unconstrained trajectory with the constrained trajectories.
In order to investigate the effect of Had adsorption on the work function of the Pt(111) surface in vacuum, we built a series of models with Pt(111) surfaces covered by 1/3, 2/3, and 1 ML Had on the top or hollow site (see Figure S4 in the Supporting Information (SI)). To avoid the dipole interaction with periodic images, the periodicity in the surface normal direction (z-coordinate) of these models was removed. The BFGS minimizer was employed to optimize the geometries of these models. Moreover, to study the effect of Had on surface charge distribution, the excess charge on Pt(111) surface was compensated by a counter charge plane, which was modeled by an array of classical point charges with the same amount of charge.
3. Results and Discussion
3.1. Helmholtz Capacitance
The electrode potential (U) corresponding to each interface model is first calculated with the recently developed computational standard hydrogen electrode (cSHE) method, which is briefly described in the SI.23,53 The four models containing 2, 3, 4, and 5 Na+ ions for each interface in Figure 1 correspond to −0.03, −0.36, −0.51, and −0.84 V vs SHE, respectively (the convergence of the computed U can be found in Figure S1). It should be mentioned that we only model the Pt(111)-Had/water interfaces at negative potentials because only under that experimental condition43,54 is the coverage of the Had saturated. As seen in Figure 2, it is clear that the data points σ-U can be well fitted by a straight line. It indicates the differential Helmholtz capacitance (CH = dσ/dU) of the Pt(111)-Had/water interface is almost constant in this negative potential region, and the obtained value of 24 μF/cm2 is in good agreement with the experimental double-layer capacitance30 measured under the same condition (i.e., electrode potential and Had coverage).
Figure 2.
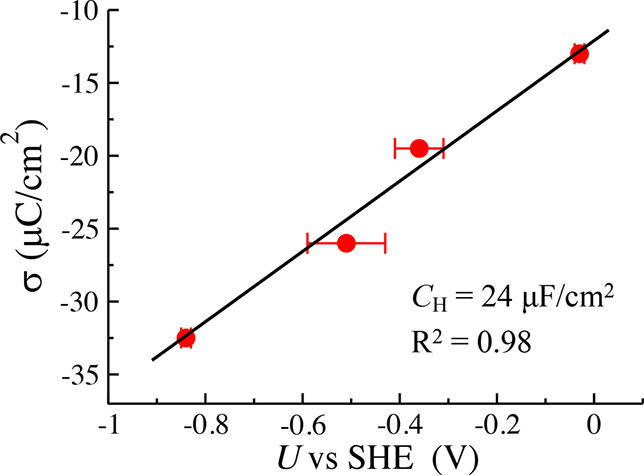
Plot of surface charge density (σ) as a function of computed electrode potential (U). The solid dots with error bars represent the computed data from AIMD simulations, which can be linearly fitted. The slope of the fitted line indicates the Helmholtz capacitance CH = 24 μF/cm2.
3.2. Had on Pt(111) Surface
We then study the properties of the adsorbed Had atoms
on Pt(111) surface at different potentials. Figure 3a shows the density distribution profiles
of Had ( ) along the surface normal direction, and
it is found that all the surface Had atoms are located
within 2 Å from the Pt(111) surface. This indicates that surface
Had does not spontaneously desorb from the negatively charged
surface during our AIMD simulations, in contrast to the neutral surface
where desorption of Had to form aqueous proton was observed
in the previous work.37,39 Also, we do not observe the production
of H2 molecule via the coupling of two Had,
which is in line with a previous calculation55 showing that there is a significant barrier of ∼0.6 eV for
the Tafel step (2Had → H2) to proceed
on Pt(111). Furthermore, it is interesting to notice from Figure 3a that there are
two peaks at ∼1 and ∼1.5 Å, indicating two types
of Had at Pt(111)-Had/water interface. Similar
to the previous work,38 these two peaks
at ∼1 Å and ∼1.5 Å can be assigned to the
Had at the hollow and top site of Pt(111), respectively.
At negative potentials below −0.5 V vs SHE, nearly half ML
of Had sits at the hollow site, while the remaining ∼1/6
ML is at the top site, and the abundance slightly shifts to the top
site when increasing the electrode potential. The adsorption sites
of Had can also be characterized by computing the vibrational
density of states (VDOS). As can be seen in Figure 3b, the sharp peak at ∼2100 cm–1 is attributable to the stretching vibrational mode
between the top site Had and Pt surface, in agreement with
the surface-enhanced infrared reflection absorption spectroscopy (SEIRAS)
experiment.18 We also note that there is
a small red-shift (∼20 cm–1) in the vibrational
frequency at negative potentials. The broad band around ∼1100
cm–1 corresponds to Had at the hollow
site of Pt(111), as also indicated by the previous calculation in
gas phase.55
) along the surface normal direction, and
it is found that all the surface Had atoms are located
within 2 Å from the Pt(111) surface. This indicates that surface
Had does not spontaneously desorb from the negatively charged
surface during our AIMD simulations, in contrast to the neutral surface
where desorption of Had to form aqueous proton was observed
in the previous work.37,39 Also, we do not observe the production
of H2 molecule via the coupling of two Had,
which is in line with a previous calculation55 showing that there is a significant barrier of ∼0.6 eV for
the Tafel step (2Had → H2) to proceed
on Pt(111). Furthermore, it is interesting to notice from Figure 3a that there are
two peaks at ∼1 and ∼1.5 Å, indicating two types
of Had at Pt(111)-Had/water interface. Similar
to the previous work,38 these two peaks
at ∼1 Å and ∼1.5 Å can be assigned to the
Had at the hollow and top site of Pt(111), respectively.
At negative potentials below −0.5 V vs SHE, nearly half ML
of Had sits at the hollow site, while the remaining ∼1/6
ML is at the top site, and the abundance slightly shifts to the top
site when increasing the electrode potential. The adsorption sites
of Had can also be characterized by computing the vibrational
density of states (VDOS). As can be seen in Figure 3b, the sharp peak at ∼2100 cm–1 is attributable to the stretching vibrational mode
between the top site Had and Pt surface, in agreement with
the surface-enhanced infrared reflection absorption spectroscopy (SEIRAS)
experiment.18 We also note that there is
a small red-shift (∼20 cm–1) in the vibrational
frequency at negative potentials. The broad band around ∼1100
cm–1 corresponds to Had at the hollow
site of Pt(111), as also indicated by the previous calculation in
gas phase.55
Figure 3.
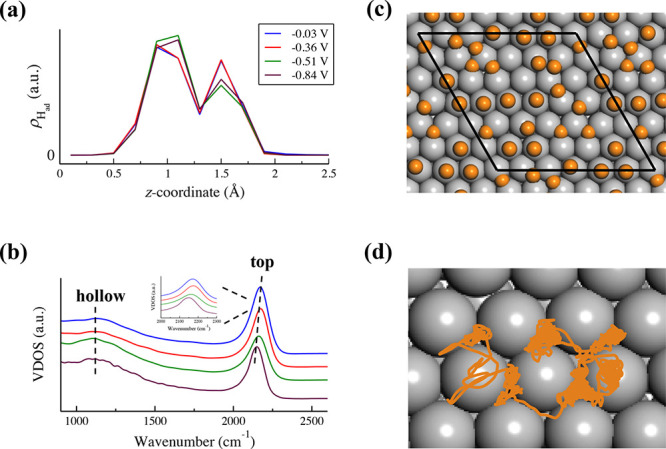
(a) Density distribution profiles of Had ( ) along the surface normal (z-coordinate) at −0.03, −0.36, −0.51, and −0.84
V vs SHE. The zero in z-coordinate indicates the
position of the nuclei of the uppermost layer of Pt(111). (b) Calculated
VDOS profiles of Had on Pt(111). (c) A representative snapshot
of Pt(111)-Had surface from an AIMD trajectory. The Pt
and Had atoms are represented by gray and orange balls,
respectively. The black parallelogram in the model denotes the periodic
boundary condition. (d) A ∼10 ps trajectory of one Had on Pt(111) surface.
) along the surface normal (z-coordinate) at −0.03, −0.36, −0.51, and −0.84
V vs SHE. The zero in z-coordinate indicates the
position of the nuclei of the uppermost layer of Pt(111). (b) Calculated
VDOS profiles of Had on Pt(111). (c) A representative snapshot
of Pt(111)-Had surface from an AIMD trajectory. The Pt
and Had atoms are represented by gray and orange balls,
respectively. The black parallelogram in the model denotes the periodic
boundary condition. (d) A ∼10 ps trajectory of one Had on Pt(111) surface.
Figure 3c shows a snapshot of Pt(111)-Had surface from the AIMD trajectory, which indicates the lateral distribution of Had on Pt(111). We do not observe an obvious pattern formed by the surface Had, other than the Had mainly populating at the top and hollow sites of Pt(111), consistent with the density distribution and VDOS analysis above. There is a small fraction of Had at the bridge site, which is supposed to be the intermediate state for Had diffusion on Pt(111). We keep track of one Had atom along the AIMD trajectory, as illustrated in Figure 3d, and we find that the Had can readily diffuse on Pt(111) surface through the bridge sites. This finding is consistent with the previous calculation showing a small barrier of ∼0.1 eV for Had diffusion on Pt(111).56
It would be interesting to understand how the Had adsorption
impacts the interface potential. Thus, we first investigate the effect
of adsorption site and coverage on the work function of the Pt(111)
surface ( ) in vacuum. As shown in Figure 4a, we find that the
  is strongly dependent on the Had coverage, decreasing from ∼6 eV to ∼5 eV by increasing
the Had coverage from 0 to 1 ML. A similar trend has been
observed in an experiment for work function versus Had coverage.57 The decrease in the work function indicates
that upon adsorption, there is a charge redistribution from Had to Pt(111) surface, inducing a dipole pointing upward to
the Had. This finding suggests that in the potential region
where the Had coverage changes (e.g., H underpotential
deposition (UPD) region), the change in
is strongly dependent on the Had coverage, decreasing from ∼6 eV to ∼5 eV by increasing
the Had coverage from 0 to 1 ML. A similar trend has been
observed in an experiment for work function versus Had coverage.57 The decrease in the work function indicates
that upon adsorption, there is a charge redistribution from Had to Pt(111) surface, inducing a dipole pointing upward to
the Had. This finding suggests that in the potential region
where the Had coverage changes (e.g., H underpotential
deposition (UPD) region), the change in  due to charge redistribution induced by
adsorption can lead to a significant capacitive response. Note that
this response is a dipole effect and should be distinguished from
the pseudocapacitive response for a Faradaic process like H UPD.
due to charge redistribution induced by
adsorption can lead to a significant capacitive response. Note that
this response is a dipole effect and should be distinguished from
the pseudocapacitive response for a Faradaic process like H UPD.
Figure 4.
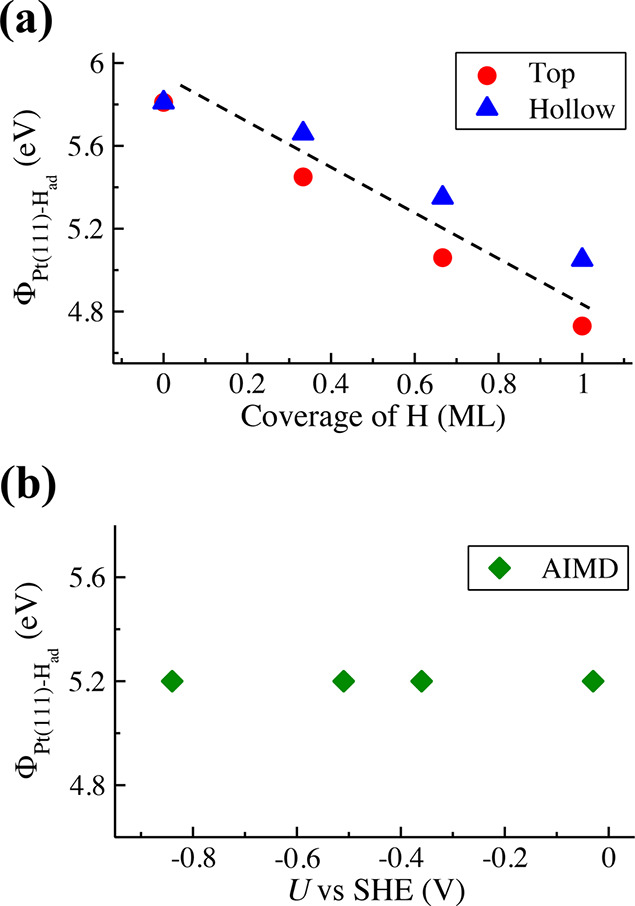
(a) Calculated work functions of Pt(111) surfaces with different coverages of Had at top (red circle) or hollow (blue triangle) site in vacuum. (b) Work functions of Pt(111)-Had surfaces, the configurations of which are taken from the AIMD trajectories of electrified interfaces at different potentials and with the solution removed.
In contrast, the work function  is less sensitive to the adsorption site
of Had, differing by ∼0.3 eV between the top and
hollow site at the 1 ML coverage. As for the interface structure,
we compute the work functions of the Pt(111)-Had slabs
taken from the AIMD trajectories at different potentials, as shown
in Figure 4b. Since
the Had coverage is fixed at 2/3 ML and there is only a
very small variation of site distribution of Had (see Figure 3a), the work function
is less sensitive to the adsorption site
of Had, differing by ∼0.3 eV between the top and
hollow site at the 1 ML coverage. As for the interface structure,
we compute the work functions of the Pt(111)-Had slabs
taken from the AIMD trajectories at different potentials, as shown
in Figure 4b. Since
the Had coverage is fixed at 2/3 ML and there is only a
very small variation of site distribution of Had (see Figure 3a), the work function  keeps rather constant under different potential
conditions. This implies that the small variation in Had adsorption has little impact on interface potential and capacitance,
and we thus conclude that the CH of the
Pt(111)-Had/water interface mainly stems from the response
of the interface water to the electrode potential.
keeps rather constant under different potential
conditions. This implies that the small variation in Had adsorption has little impact on interface potential and capacitance,
and we thus conclude that the CH of the
Pt(111)-Had/water interface mainly stems from the response
of the interface water to the electrode potential.
3.3. Interface Water
We then analyze the
structure of interface water at the electrified Pt(111)-Had/water interfaces. Figure 5a shows the profiles of water density profiles ( ) at different potentials, and there is
a distinct peak at z = 3.3 Å in all the profiles.
When we make comparisons to the Pt(111)/water interface,23,28,29,58 we notice the peak at z = 2.3 Å disappears
at the Pt(111)-Had/water interface, which indicates no
chemisorbed water present at the Pt(111)-Had/water interface
because the 1 ML Had blocks all the adsorption sites for
water. Figure 5b plots
the profiles of dipole orientation (
) at different potentials, and there is
a distinct peak at z = 3.3 Å in all the profiles.
When we make comparisons to the Pt(111)/water interface,23,28,29,58 we notice the peak at z = 2.3 Å disappears
at the Pt(111)-Had/water interface, which indicates no
chemisorbed water present at the Pt(111)-Had/water interface
because the 1 ML Had blocks all the adsorption sites for
water. Figure 5b plots
the profiles of dipole orientation ( , where φ is the angle between the
bisector of water and the surface normal) and shows that the dipole
of the interface water becomes more oriented toward the surface when
the potential shifts to negative, as expected. It is interesting to
note that the dipole orientation of the interface water has almost
no further change at the potential more negative than −0.51
V vs SHE, suggesting that the dielectric saturation of the interface
water is reached. Figure 5c shows the probability distribution profiles of the angle
φ, and the prominent peak at 135° indicates most interface
water molecules take the “one-H-down” configuration
orienting one O–H bond of the water toward the surface and
the other parallel to (see the inset in Figure 5b), which is beneficial to forming hydrogen
bonding network with the neighboring water as reported in the recent
work.5 Consistently, the hydrogen bond
analysis shown in Figure 5d reveals the number of the hydrogen bond donor (Ndonor) of the interface water is close to 1.
, where φ is the angle between the
bisector of water and the surface normal) and shows that the dipole
of the interface water becomes more oriented toward the surface when
the potential shifts to negative, as expected. It is interesting to
note that the dipole orientation of the interface water has almost
no further change at the potential more negative than −0.51
V vs SHE, suggesting that the dielectric saturation of the interface
water is reached. Figure 5c shows the probability distribution profiles of the angle
φ, and the prominent peak at 135° indicates most interface
water molecules take the “one-H-down” configuration
orienting one O–H bond of the water toward the surface and
the other parallel to (see the inset in Figure 5b), which is beneficial to forming hydrogen
bonding network with the neighboring water as reported in the recent
work.5 Consistently, the hydrogen bond
analysis shown in Figure 5d reveals the number of the hydrogen bond donor (Ndonor) of the interface water is close to 1.
Figure 5.

Profiles of water density ( , (a)) and dipole orientation (
 , (b)) along the surface normal (z-coordinate) at −0.03, −0.36, −0.51,
and −0.84 V vs SHE. The positions of water molecules are indicated
by those of the oxygen atoms, and the zero in z-coordinate
indicates the position of the nuclei of the uppermost layer of Pt(111).
The inset shows a representative snapshot of the electrified Pt(111)-Had/water interface. The Pt, O, Hw, and Had are colored by gray, red, white and orange, respectively. (c) Probability
distribution profiles of angle φ (between the bisector of water
and the surface normal, P(φ)) of interface water. (d) Number
of hydrogen-bond donors (Ndonor) of interface
water as a function of potential. A hydrogen bond is defined when
the O–O distance is shorter than 3.5 Å and the O–O–H
angle is less than 35°.
, (b)) along the surface normal (z-coordinate) at −0.03, −0.36, −0.51,
and −0.84 V vs SHE. The positions of water molecules are indicated
by those of the oxygen atoms, and the zero in z-coordinate
indicates the position of the nuclei of the uppermost layer of Pt(111).
The inset shows a representative snapshot of the electrified Pt(111)-Had/water interface. The Pt, O, Hw, and Had are colored by gray, red, white and orange, respectively. (c) Probability
distribution profiles of angle φ (between the bisector of water
and the surface normal, P(φ)) of interface water. (d) Number
of hydrogen-bond donors (Ndonor) of interface
water as a function of potential. A hydrogen bond is defined when
the O–O distance is shorter than 3.5 Å and the O–O–H
angle is less than 35°.
Moreover, we can deduce from Figure 5 that the layer of interface water becomes more ordered at more negative potentials, particularly the distribution of angle φ becoming much narrower and the Ndonor is reduced from 1.08 to ∼1 at very negative potentials. Thus, one can speculate that it would become more difficult to reorient an interface water at very negative potentials, not only due to alignment with the enhanced electric field but also due to the higher energy penalty required to break more ordered hydrogen bonding network. It is supported by the dipole–dipole autocorrelation analysis shown in Figure S5 that the interface water at −0.03 V has faster relaxation time (∼5 ps) compared with those at more negative potentials (∼11 ps). Indeed, water reorganization at interfaces has been proposed by Koper and co-workers59 as a pH-dependent descriptor for HER activity. This can also explain why modifying Pt(111) with a small amount of Ni(OH)2 can decrease the HER overpotential.60 It is because Ni(OH)2 lowers the potential of zero charge of Pt(111), leading to a weaker electric field at the interface.
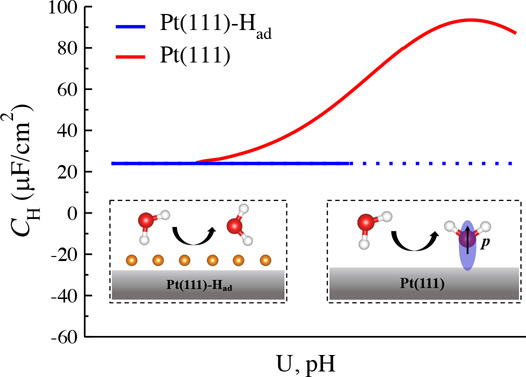
The main difference of interface water structure between the Pt(111)-Had/water and Pt(111)/water interface is that in the absence of surface Had, water can chemisorb on the Pt(111) surface, and moreover its coverage varies with the applied potential, leading to a significant capacitive response. Figure 6 compares the profiles of the differential capacitance CH at the Pt(111)/water interface and Pt(111)-Had/water interface (see CH as a function of σ in Figure S6). We can find that they converge to ∼20 μF/cm2 at a very negative potential, while they diverge when the potential shifts to positive. It has been shown in the recent work29 that the CH of the interface water at the Pt(111)/water interface can be decomposed into two capacitive components connected in series; one is the commonly known dielectric response due to water reorientation (Csol), usually having a nearly constant capacitance value of ∼20 μF/cm2 at metal/water interfaces,30,61−64 and the other is due to the variation of the coverage of the chemisorbed water in response to the electrode potential (CA). As sketched in the inset of Figure 6, the “one-H-down” water can reorient to chemisorb on the Pt(111) surface when shifting the potential positively. Electronic redistribution due to water chemisorption can induce a dipole (p) that compensates the electric field, giving rise to a peak in CH. In contrast, this capacitive component (CA) disappears at the Pt(111)-Had/water interface since the presence of Had completely inhibits water chemisorption (see Figure 5a), leaving only the Csol component. This discrepancy clearly demonstrates that the adsorption state of the Pt(111) surface has an important impact on the dielectric property of interface water.
Figure 6.
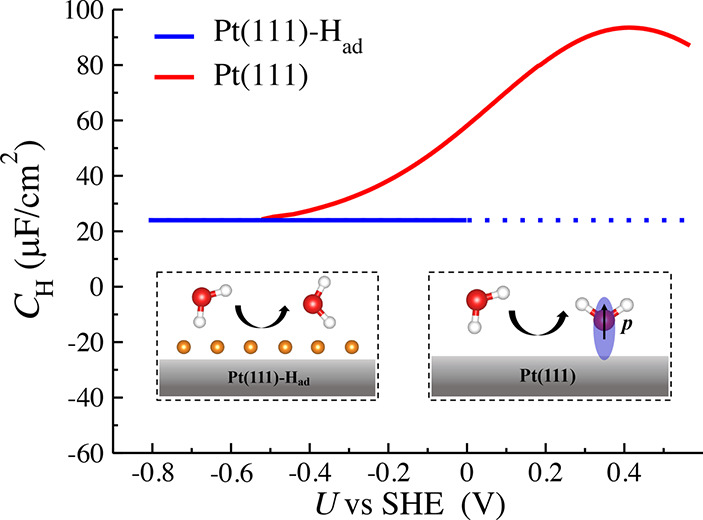
Plots of Helmholtz capacitance (CH) as a function of electrode potential (U) at the Pt(111)/water interface (red) and Pt(111)-Had/water interface (blue). The red curve is taken from the recent work.29 The insets show the change of the structure of interface water in response to the electrode potential on the Pt(111) and Pt(111)-Had surface. The red, white, and orange balls represent the O, Hw, and Had atom, respectively. The p denotes the induced dipole due to water chemisorption on Pt(111).
3.4. Charges in Helmholtz Layer
Counter ions (i.e., Na+) are an important component of EDL, and they serve as more than just counter charges to the charges of electrode surfaces. In recent years, many experimental studies have reported that the choice of ions has a significant impact on the double-layer capacitance,65 hydrogen adsorption,66 selectivity of CO reduction,67 and so on. However, the microscopic structures and behaviors of the ions at electrified interfaces are still lacking. We thus investigate the structures of counter Na+ ions at the Pt(111)-Had/water interface. Figure 7a shows the dependence of the distance between the Na+ ions and Pt(111) surface (dNa–Pt) on the electrode potential, that is, a monotonic decrease when shifting the potential from −0.03 V to −0.84 V vs SHE. Taking the averaged position of the Na+ ions in our simplified models as an approximate estimate to the width of Helmholtz layer, our calculation indicates that the width of the Helmholtz layer becomes smaller along with the negative shift in the electrode potential. It has been indeed suggested68 that the Helmholtz layer can become narrower at charged surfaces due to enhanced electrostatic force. In the absence of chemisorbed water, the Helmholtz layer resembles a parallel-plate capacitor, and thus, its capacitance can be expressed as CH = εHε0/lH, in which lH denotes the Helmholtz layer width, and εH and ε0 are the relative permittivity of interface water in the Helmholtz layer and vacuum permittivity, respectively. A decrease of lH would suggest an increase of CH when the potential shifts more negative, which however is not what our calculation in Figure 2 shows. We suppose that εH would also become smaller with the negative sweep of the potential due to the saturation of the dipole orientation of the interface water at the negative potential, as illustrated in Figure 5b. Thus, the compensating effect between lH and εH may result in a nearly constant Helmholtz capacitance CH.
Figure 7.
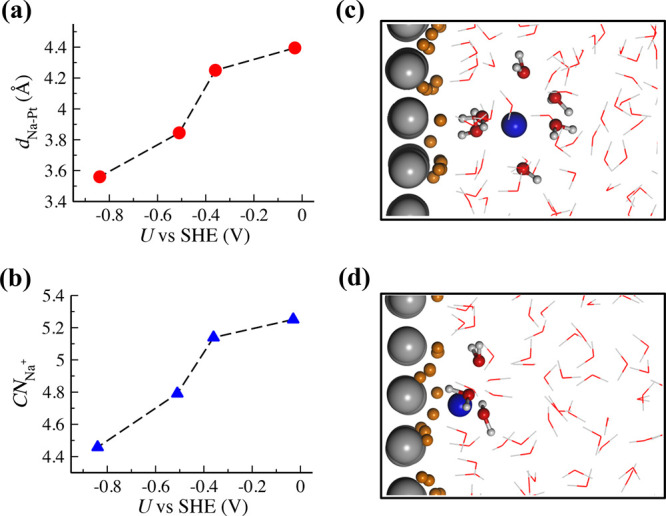
(a) Plot of the distance between the averaged positions of the
Na+ ions and the uppermost Pt layer (dNa–Pt) at Pt(111)-Had/water interfaces
as a function of potential. (b) The averaged number of water molecules
coordinated to Na+ ions ( ) at different potentials. (c,d) Snapshots
of the Pt(111)-Had/water interfaces at −0.03 and
−0.86 V vs SHE. Pt, O, Hw, Na, and Had are colored by gray, red, white, blue, and orange, respectively.
The water molecules coordinated to Na+ are highlighted
with the ball–stick model in comparison to other water with
the line model.
) at different potentials. (c,d) Snapshots
of the Pt(111)-Had/water interfaces at −0.03 and
−0.86 V vs SHE. Pt, O, Hw, Na, and Had are colored by gray, red, white, blue, and orange, respectively.
The water molecules coordinated to Na+ are highlighted
with the ball–stick model in comparison to other water with
the line model.
Furthermore, we analyze the solvation structure of Na+ ions as a function of the potential. As shown in Figure 7b, the coordination number
of Na+ ions ( ) shows a similar decreasing trend to dNa–Pt when shifting the potential to
negative. At a slightly negative potential of −0.03 V vs SHE,
the
) shows a similar decreasing trend to dNa–Pt when shifting the potential to
negative. At a slightly negative potential of −0.03 V vs SHE,
the  is 5.3, which is very similar to that of
Na+ ions in aqueous solution.69 This indicates that the Na+ ions have a full solvation
shell at this potential, as illustrated in Figure 7c (see also the radial distribution function
(RDF) of Na+ and O atoms in water in Figure S7 in the SI). The partial desolvation of Na+ starts at ∼ −0.4 V vs SHE, and the
is 5.3, which is very similar to that of
Na+ ions in aqueous solution.69 This indicates that the Na+ ions have a full solvation
shell at this potential, as illustrated in Figure 7c (see also the radial distribution function
(RDF) of Na+ and O atoms in water in Figure S7 in the SI). The partial desolvation of Na+ starts at ∼ −0.4 V vs SHE, and the  decreases to 4.5 at the potential of −0.84
V vs SHE, that is, almost one water in the solvation shell of Na+ is removed, which is in line with the surface enhanced Raman
spectroscopic measurement.12 It is worth
mentioning that the ion desolvation at the interface is the consequence
of the competition between the strength of the electrostatic attraction
to the charged surface and the coordination of the ion solvation shell,
and it should be less affected by ion packing at the interface. Note
that we do not see any obvious decrease of the Mulliken charges on
Na+ ions upon partial desolvation, which can also be confirmed
by the projected density of states of Na in Figure S8 in the SI. Without partial charge transfer,70 the inert Na+ ions do not specifically adsorb
on the Pt surface, as commonly accepted in the field. In addition,
we notice that as the Na+ ions approach closer to the surface
with the negative shift of the potential, the surface Had atoms become in close proximity within ∼3 Å to the Na+ ions (see a representative snapshot in Figure 7d and the RDF between Na+ and
Had in Figure S7b in the SI),
probably driven in part by the attraction between the fractional negative
charge on Had and the cations. We suspect that a similar
attraction between surface intermediates and ions in the Helmholtz
layer will have a direct impact on the catalytic activity of the interfaces,
which would merit future investigations.
decreases to 4.5 at the potential of −0.84
V vs SHE, that is, almost one water in the solvation shell of Na+ is removed, which is in line with the surface enhanced Raman
spectroscopic measurement.12 It is worth
mentioning that the ion desolvation at the interface is the consequence
of the competition between the strength of the electrostatic attraction
to the charged surface and the coordination of the ion solvation shell,
and it should be less affected by ion packing at the interface. Note
that we do not see any obvious decrease of the Mulliken charges on
Na+ ions upon partial desolvation, which can also be confirmed
by the projected density of states of Na in Figure S8 in the SI. Without partial charge transfer,70 the inert Na+ ions do not specifically adsorb
on the Pt surface, as commonly accepted in the field. In addition,
we notice that as the Na+ ions approach closer to the surface
with the negative shift of the potential, the surface Had atoms become in close proximity within ∼3 Å to the Na+ ions (see a representative snapshot in Figure 7d and the RDF between Na+ and
Had in Figure S7b in the SI),
probably driven in part by the attraction between the fractional negative
charge on Had and the cations. We suspect that a similar
attraction between surface intermediates and ions in the Helmholtz
layer will have a direct impact on the catalytic activity of the interfaces,
which would merit future investigations.
Finally, we calculate the location of net electronic charge on the Pt surface by taking the difference in charge density between the neutral Pt slab and the one with one excess electron. The solvent is ignored in this analysis because it has no charge transfer with the Pt–Had surface, as shown in Figure S2, and thus should not affect the distribution of the excess electron on the surface. As illustrated in Figure 8, we can find that the excess electron is located at ∼1.8 Å and ∼1.3 Å from the uppermost layer of the Pt(111) surface for Had adsorbed at the top and hollow site, respectively. For comparison, the excess electron is located at ∼1.3 Å from the uppermost layer on clean Pt(111). Thus, it is clear that Had at the hollow site hardly changes the position of the surface charge, while Had at the top site can push the net charge away from the Pt(111) surface by as much as 0.5 Å. Furthermore, Mulliken charge analysis indicates that the top site Had (+0.17 e0) donates more electrons to the neutral Pt(111) surface than the hollow site Had (+0.06 e0). The former decreases to +0.15 e0 at the negatively charged surface, confirming that the Had at the top site carries the surface excess electron (see the iso-surfaces of excess electron density in Figure 8a). This may weaken the Had binding and thus lead to the red-shift of the vibrational frequency of Had on Pt(111) at negative potentials observed by the SEIRAS experiment,6 as well as in our calculated VDOS in Figure 3b. Considering Had at the top site is the key intermediate for HER and HOR on Pt(111), we suppose the change of its charge state and binding energy at varying potentials will have direct impact on the thermodynamics and kinetics of these reactions.
Figure 8.
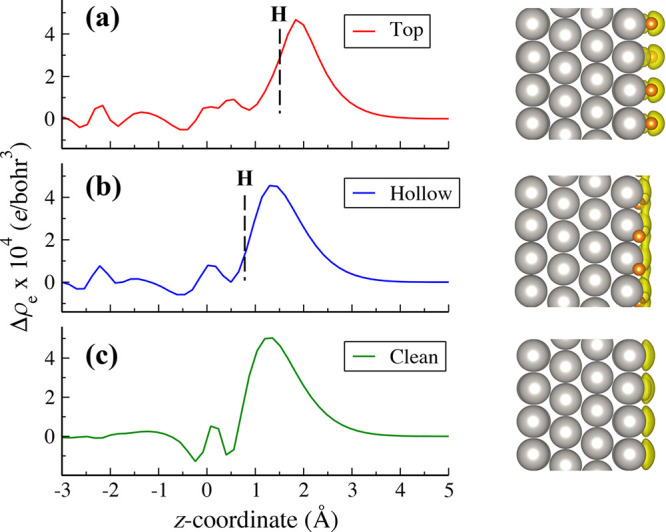
Net charge distribution on Pt(111) with 2/3 ML Had at the top site (a) and hollow site (b), and without Had (c). The profiles for the net negative charge distribution are averaged along the surface normal (z-coordinate), and the dashed lines in profiles indicate the positions of surface Had. The Pt and Had atoms are colored by gray and orange, respectively. The yellow isosurfaces in the models indicate the excess electron.
3.5. pH Effects
In the electrochemical experiment, the pH, on a par with the potential, is a key parameter that determines the state of the electrode surface and thus the structure and dielectric properties of the interface, consequently having a significant impact on electrode activity for catalytic processes such as HER. Our simulated models at saturated 2/3 ML coverage of Had at different surface charge densities (i.e., potentials) can be related to electrochemical conditions at different pH, by applying the Nernstian relation. It has been shown that the saturated coverage of Had on Pt(111) can be reached at ∼0.05 V vs RHE for a wide range of pH conditions (e.g., ∼0 V vs SHE at pH = 1.2 and ∼−0.8 V vs SHE at pH = 13.1).54 As for our simulated models at fixed coverage of Had, assuming the Nernstian relation is valid for the electrochemical condition range, varying the surface charge density and potential amounts to changing the pH condition with a rate of 59 meV per pH unit. In other words, the electrified interface models at −0.03 V and −0.84 V vs SHE can be estimated to correspond to solution pH = 1 and 15, respectively. Therefore, our calculation can actually offer information on electrified interfaces at different pH.
Informed by the differences of interface structures and capacitances caused by H adsorption, which in turn is affected by pH, we can envision how the pH may affect the hydrogen UPD. In acidic conditions, hydrogen starts to adsorb already at positive potential (e.g., 0.3 V vs SHE at pH = 2).54 In these conditions, there are still some chemisorbed water molecules, which can lead to a high, total Helmholtz capacitance CH (red curve in Figure 6). Upon hydrogen adsorption, surface water desorbs at the same time, rendering the potential changing to a lesser extent. However, under alkaline conditions, hydrogen UPD occurs at rather negative potentials (e.g., −0.4 V vs SHE at pH = 1354), when there is no chemisorbed water any more. The Helmholtz capacitance is expected to be low and constant (∼20 μF/cm2). This may explain the subtle difference observed in the hydrogen UPD regions in cyclic voltammetries at different pH.
As for HER which happens under the conditions at which the Pt(111) surface is saturated with adsorbed H atoms, our simulated models in this work can be regarded as the onset conditions at different pH. As mentioned above, the model at −0.84 V vs SHE, equivalent to a very basic solution pH = 15, has a rather rigid hydrogen bond network of interface water and a long relaxation time for dipole reorientation of interface water. This would indicate slower charge transfer kinetics than those under acidic conditions.59
4. Conclusions
In order to understand the atomistic structure and Helmholtz capacitance of the Pt(111)-Had/water interface, a series of EDL models with various surface charge densities have been computed with extensive AIMD simulations. We have calculated the electrode potentials using the computational standard hydrogen electrode method as a function of surface charge density and obtained the capacitance of the Helmholtz layer. We have further analyzed the structures of water, Had, and counterions at the electrified interfaces and discussed the possible pH effects. The following main conclusions have been obtained.
-
(i)
The diffusion of surface Had atoms is fast on Pt(111), and neither spontaneous Had desorption nor H2 formation has been observed at negatively charged interfaces during the tens of ps AIMD simulations. We find that the majority of the Had adsorb at the hollow site and the rest sit at the top site, with the electrode potential hardly affecting the Had distribution. Interestingly, at the negatively charged interface, the Had atoms at the top site carry a fraction of surface charge and can push the negative charge away from the Pt surface compared with the clean Pt surface and the surface with the Had at the hollow sites.
-
(ii)
The saturation coverage of Had on Pt(111) eliminates the chemisorption of water and consequently the negative capacitive response induced by water adsorption/desorption processes at the interface. Thus, the calculated Helmholtz capacitance of the Pt(111)-Had/water interface, as expected from the usual dielectric property of interface water, is ∼20 μF/cm2 in the potential window of −1 to 0 V vs SHE, consistent with the experiment.
-
(iii)
Our simulated models can be connected to different pH conditions if applying the Nernstian relation. Understanding the surface state controlled by potential and pH, that is, with coadsorption of hydrogen and water, can help explain the differences in hydrogen UPD regions in cyclic voltammetries and HER kinetics at different pH.
-
(iv)
The width of the Helmholtz layer of the Pt(111)-Had/water interface becomes smaller when the potential shifts to the more negative direction, due to increased electrostatic attraction between the charged surface and counterions. Yet, the differential Helmholtz capacitance of the Pt(111)-Had/water interface at negative potentials remains almost constant, which must result from the compensating effect of dielectric (i.e., water orientation) saturation of interface water.
Finally, we believe that AIMD simulations of electrified interfaces can offer valuable atomic level understanding of the EDL structures and capacitive behaviors, which would be helpful to elucidating the molecular mechanisms of electrocatalytic reactions and searching for better performing catalysts.
Acknowledgments
We are grateful for the financial support from the National Natural Science Foundation of China (Grant Nos. 21991151, 21991150, 21902136, 21861132015, and 21621091), the Principal’s fund of Xiamen University (Grant No. 20720190047) and the China Postdoctoral Science Foundation (Grant Nos. 2018M642563 and 2020T130361).
Supporting Information Available
The Supporting Information is available free of charge at https://pubs.acs.org/doi/10.1021/jacsau.1c00108.
Electrode potential calculation method; excess charge distributions at the Pt(111)-Had/water interface; models for Pt(111)-Had surface; time accumulative Fermi energies and electrostatic potentials; solvation structures of Na+; projected density of states; dipole–dipole autocorrelation of the interface water; plots of Helmholtz capacitance as a function of surface charge; verification of simulation time and the constraint of the O–H bonds in water (PDF)
The authors declare no competing financial interest.
Dedication
This paper is dedicated to the 100th Anniversary of Xiamen University.
Supplementary Material
References
- Schmickler W.; Santos E.. Interfacial Electrochemistry, 2nd ed.; Springer Berlin Heidelberg: Berlin, Heidelberg, 2010; pp 1–267. [Google Scholar]
- Velasco-Velez J.-J.; Wu C. H.; Pascal T. A.; Wan L. F.; Guo J.; Prendergast D.; Salmeron M. The structure of interfacial water on gold electrodes studied by x-ray absorption spectroscopy. Science 2014, 346, 831. 10.1126/science.1259437. [DOI] [PubMed] [Google Scholar]
- Zhang C.; Hutter J.; Sprik M. Coupling of Surface Chemistry and Electric Double Layer at TiO 2 Electrochemical Interfaces. J. Phys. Chem. Lett. 2019, 10, 3871–3876. 10.1021/acs.jpclett.9b01355. [DOI] [PubMed] [Google Scholar]
- Liu Y.; Kawaguchi T.; Pierce M. S.; Komanicky V.; You H. Layering and Ordering in Electrochemical Double Layers. J. Phys. Chem. Lett. 2018, 9, 1265–1271. 10.1021/acs.jpclett.8b00123. [DOI] [PubMed] [Google Scholar]
- Li C.-Y.; Le J.-B.; Wang Y.-H.; Chen S.; Yang Z.-L.; Li J.-F.; Cheng J.; Tian Z.-Q. In situ probing electrified interfacial water structures at atomically flat surfaces. Nat. Mater. 2019, 18, 697. 10.1038/s41563-019-0356-x. [DOI] [PubMed] [Google Scholar]
- Zhu S.; Qin X.; Yao Y.; Shao M. pH-Dependent Hydrogen and Water Binding Energies on Platinum Surfaces as Directly Probed through Surface-Enhanced Infrared Absorption Spectroscopy. J. Am. Chem. Soc. 2020, 142, 8748–8754. 10.1021/jacs.0c01104. [DOI] [PubMed] [Google Scholar]
- Bouzid A.; Pasquarello A. Atomic-Scale Simulation of Electrochemical Processes at Electrode/Water Interfaces under Referenced Bias Potential. J. Phys. Chem. Lett. 2018, 9, 1880. 10.1021/acs.jpclett.8b00573. [DOI] [PubMed] [Google Scholar]
- Zhang C.; Sayer T.; Hutter J.; Sprik M. Modelling electrochemical systems with finite field molecular dynamics. J. Phys. Energy 2020, 2, 032005. 10.1088/2515-7655/ab9d8c. [DOI] [Google Scholar]
- Gileadi E.Physical Electrochemistry. Fundamentals, Techniques and Applications; Wiley-VCH, 2011; pp 1–374. [Google Scholar]
- Ataka K.-i.; Yotsuyanagi T.; Osawa M. Potential-Dependent Reorientation of Water Molecules at an Electrode/Electrolyte Interface Studied by Surface-Enhanced Infrared Absorption Spectroscopy. J. Phys. Chem. 1996, 100, 10664. 10.1021/jp953636z. [DOI] [Google Scholar]
- Osawa M.; Tsushima M.; Mogami H.; Samjeské G.; Yamakata A. Structure of Water at the Electrified Platinum-Water Interface: A Study by Surface-Enhanced Infrared Absorption Spectroscopy. J. Phys. Chem. C 2008, 112, 4248. 10.1021/jp710386g. [DOI] [Google Scholar]
- Tian Z.-Q.; Ren B.; Chen Y.-X.; Zou S.-Z.; Mao B.-W. Probing electrode/electrolyte interfacial structure in the potential region of hydrogen evolution by Raman spectroscopy. J. Chem. Soc., Faraday Trans. 1996, 92, 3829. 10.1039/ft9969203829. [DOI] [Google Scholar]
- Li J. F.; Huang Y. F.; Ding Y.; Yang Z. L.; Li S. B.; Zhou X. S.; Fan F. R.; Zhang W.; Zhou Z. Y.; Wu D. Y.; et al. Shell-isolated nanoparticle-enhanced Raman spectroscopy. Nature 2010, 464, 392. 10.1038/nature08907. [DOI] [PubMed] [Google Scholar]
- Tong Y.; Lapointe F.; Thamer M.; Wolf M.; Campen R. K. Hydrophobic Water Probed Experimentally at the Gold Electrode/Aqueous Interface. Angew. Chem., Int. Ed. 2017, 56, 4211–4214. 10.1002/anie.201612183. [DOI] [PubMed] [Google Scholar]
- Noguchi H.; Okada T.; Uosaki K. Molecular structure at electrode/electrolyte solution interfaces related to electrocatalysis. Faraday Discuss. 2009, 140, 125–137. 10.1039/B803640C. [DOI] [PubMed] [Google Scholar]
- Toney M. F.; Howard J. N.; Richer J.; Borges G. L.; Gordon J. G.; Melroy O. R.; Wiesler D. G.; Yee D.; Sorensen L. B. Voltage-dependent ordering of water molecules at an electrode-electrolyte interface. Nature 1994, 368, 444. 10.1038/368444a0. [DOI] [Google Scholar]
- Lucas C. A.; Thompson P.; Gründer Y.; Markovic N. M. The structure of the electrochemical double layer: Ag(111) in alkaline electrolyte. Electrochem. Commun. 2011, 13, 1205. 10.1016/j.elecom.2011.08.043. [DOI] [Google Scholar]
- Kunimatsu K.; Senzaki T.; Tsushima M.; Osawa M. A combined surface-enhanced infrared and electrochemical kinetics study of hydrogen adsorption and evolution on a Pt electrode. Chem. Phys. Lett. 2005, 401, 451–454. 10.1016/j.cplett.2004.11.100. [DOI] [Google Scholar]
- Carrasco E.; Aumer A.; Brown M. A.; Dowler R.; Palacio I.; Song S.; Sterrer M. Infrared spectra of high coverage CO adsorption structures on Pt(111). Surf. Sci. 2010, 604, 1320–1325. 10.1016/j.susc.2010.04.021. [DOI] [Google Scholar]
- Cheng J.; Sprik M. The electric double layer at a rutile TiO(2) water interface modelled using density functional theory based molecular dynamics simulation. J. Phys.: Condens. Matter 2014, 26, 244108. 10.1088/0953-8984/26/24/244108. [DOI] [PubMed] [Google Scholar]
- Otani M.; Hamada I.; Sugino O.; Morikawa Y.; Okamoto Y.; Ikeshoji T. Electrode dynamics from first principles. J. Phys. Soc. Jpn. 2008, 77, 024802. 10.1143/JPSJ.77.024802. [DOI] [PubMed] [Google Scholar]
- Surendralal S.; Todorova M.; Finnis M. W.; Neugebauer J. First-Principles Approach to Model Electrochemical Reactions: Understanding the Fundamental Mechanisms behind Mg Corrosion. Phys. Rev. Lett. 2018, 120, 246801. 10.1103/PhysRevLett.120.246801. [DOI] [PubMed] [Google Scholar]
- Le J.; Iannuzzi M.; Cuesta A.; Cheng J. Determining potentials of zero charge of metal electrodes versus the standard hydrogen electrode from based on density-functional-theory-based molecular dynamics. Phys. Rev. Lett. 2017, 119, 16801. 10.1103/PhysRevLett.119.016801. [DOI] [PubMed] [Google Scholar]
- Cheng J.; Sprik M. Alignment of electronic energy levels at electrochemical interfaces. Phys. Chem. Chem. Phys. 2012, 14, 11245. 10.1039/c2cp41652b. [DOI] [PubMed] [Google Scholar]
- Magnussen O. M.; Groß A. Toward an Atomic-Scale Understanding of Electrochemical Interface Structure and Dynamics. J. Am. Chem. Soc. 2019, 141, 4777–4790. 10.1021/jacs.8b13188. [DOI] [PubMed] [Google Scholar]
- Huang P.; Pham T. A.; Galli G.; Schwegler E. Alumina(0001)/Water Interface: Structural Properties and Infrared Spectra from First-Principles Molecular Dynamics Simulations. J. Phys. Chem. C 2014, 118, 8944–8951. 10.1021/jp4123002. [DOI] [Google Scholar]
- Lan J.; Rybkin V. V.; Iannuzzi M. Ionization of Water as an Effect of Quantum Delocalization at Aqueous Electrode Interfaces. J. Phys. Chem. Lett. 2020, 11, 3724–3730. 10.1021/acs.jpclett.0c01025. [DOI] [PubMed] [Google Scholar]
- Le J.; Fan Q.; Perez-Martinez L.; Cuesta A.; Cheng J. Theoretical insight into the vibrational spectra of metal-water interfaces from density functional theory based molecular dynamics. Phys. Chem. Chem. Phys. 2018, 20, 11554. 10.1039/C8CP00615F. [DOI] [PubMed] [Google Scholar]
- Le J.-B.; Fan Q.-Y.; Li J.-Q.; Cheng J. Molecular origin of negative component of Helmholtz capacitance at electrified Pt(111)/water interface. Sci. Adv. 2020, 6, eabb1219 10.1126/sciadv.abb1219. [DOI] [PMC free article] [PubMed] [Google Scholar]
- Pajkossy T.; Kolb D. M. Double layer capacitance of Pt(111) single crystal electrodes. Electrochim. Acta 2001, 46, 3063. 10.1016/S0013-4686(01)00597-7. [DOI] [Google Scholar]
- Ojha K.; Arulmozhi N.; Aranzales D.; Koper M. T. M. Double Layer of Pt(111)-Aqueous Electrolyte Interface: Potential of Zero Charge and Anomalous Gouy-Chapman Screening. Angew. Chem., Int. Ed. 2020, 59, 711. 10.1002/anie.201911929. [DOI] [PMC free article] [PubMed] [Google Scholar]
- Cheng T.; Wang L.; Merinov B. V.; Goddard W. A. Explanation of Dramatic pH-Dependence of Hydrogen Binding on Noble Metal Electrode: Greatly Weakened Water Adsorption at High pH. J. Am. Chem. Soc. 2018, 140, 7787. 10.1021/jacs.8b04006. [DOI] [PubMed] [Google Scholar]
- Sheng W.; Zhuang Z.; Gao M.; Zheng J.; Chen J. G.; Yan Y. Correlating hydrogen oxidation and evolution activity on platinum at different pH with measured hydrogen binding energy. Nat. Commun. 2015, 6, 5848. 10.1038/ncomms6848. [DOI] [PubMed] [Google Scholar]
- Zheng J.; Sheng W.; Zhuang Z.; Xu B.; Yan Y. Universal dependence of hydrogen oxidation and evolution reaction activity of platinum-group metals on pH and hydrogen binding energy. Sci. Adv. 2016, 2, e1501602 10.1126/sciadv.1501602. [DOI] [PMC free article] [PubMed] [Google Scholar]
- Nørskov J. K.; Bligaard T.; Logadottir A.; Kitchin J. R.; Chen J. G.; Pandelov S.; Stimming U. Trends in the Exchange Current for Hydrogen Evolution. J. Electrochem. Soc. 2005, 152, J23. 10.1149/1.1856988. [DOI] [Google Scholar]
- Briega-Martos V.; Ferre-Vilaplana A.; Herrero E.; Feliu J. M. Why the activity of the hydrogen oxidation reaction on platinum decreases as pH increases. Electrochim. Acta 2020, 354, 136620. 10.1016/j.electacta.2020.136620. [DOI] [Google Scholar]
- Sakong S.; Gross A. The electric double layer at metal-water interfaces revisited based on a charge polarization scheme. J. Chem. Phys. 2018, 149, 084705. 10.1063/1.5040056. [DOI] [PubMed] [Google Scholar]
- Hansen M. H.; Nilsson A.; Rossmeisl J. Modelling pH and potential in dynamic structures of the water/Pt(111) interface on the atomic scale. Phys. Chem. Chem. Phys. 2017, 19, 23505–23514. 10.1039/C7CP03576D. [DOI] [PubMed] [Google Scholar]
- Kristoffersen H. H.; Vegge T.; Hansen H. A. OH formation and H2adsorption at the liquid water-Pt(111) interface. Chem. Sci. 2018, 9, 6912. 10.1039/C8SC02495B. [DOI] [PMC free article] [PubMed] [Google Scholar]
- Kronberg R.; Laasonen K. Coupling Surface Coverage and Electrostatic Effects on the Interfacial Adlayer–Water Structure of Hydrogenated Single-Crystal Platinum Electrodes. J. Phys. Chem. C 2020, 124, 13706–13714. 10.1021/acs.jpcc.0c02323. [DOI] [Google Scholar]
- Michaelson H. B. The work function of the elements and its periodicity. J. Appl. Phys. 1977, 48, 4729. 10.1063/1.323539. [DOI] [Google Scholar]
- Cuesta A. Measurement of the surface charge density of CO-saturated Pt(111) electrodes as a function of potential: The potential of zero charge of Pt(111). Surf. Sci. 2004, 572, 11. 10.1016/j.susc.2004.08.014. [DOI] [Google Scholar]
- Markovic N. Surface science studies of model fuel cell electrocatalysts. Surf. Sci. Rep. 2002, 45, 117–229. 10.1016/S0167-5729(01)00022-X. [DOI] [Google Scholar]
- VandeVondele J.; Krack M.; Mohamed F.; Parrinello M.; Chassaing T.; Hutter J. Quickstep: Fast and accurate density functional calculations using a mixed Gaussian and plane waves approach. Comput. Phys. Commun. 2005, 167, 103. 10.1016/j.cpc.2004.12.014. [DOI] [Google Scholar]
- Goedecker S.; Teter M.; Hutter J. Separable dual-space Gaussian pseudopotentials. Phys. Rev. B: Condens. Matter Mater. Phys. 1996, 54, 1703. 10.1103/PhysRevB.54.1703. [DOI] [PubMed] [Google Scholar]
- Hartwigsen C.; Goedecker S.; Hutter J. Relativistic separable dual-space Gaussian pseudopotentials from H to Rn. Phys. Rev. B: Condens. Matter Mater. Phys. 1998, 58, 3641. 10.1103/PhysRevB.58.3641. [DOI] [PubMed] [Google Scholar]
- VandeVondele J.; Hutter J. Gaussian basis sets for accurate calculations on molecular systems in gas and condensed phases. J. Chem. Phys. 2007, 127, 114105. 10.1063/1.2770708. [DOI] [PubMed] [Google Scholar]
- Perdew J. P.; Burke K.; Ernzerhof M. Generalized Gradient Approximation Made Simple. Phys. Rev. Lett. 1996, 77, 3865. 10.1103/PhysRevLett.77.3865. [DOI] [PubMed] [Google Scholar]
- Grimme S.; Antony J.; Ehrlich S.; Krieg H. A consistent and accurate ab initio parametrization of density functional dispersion correction (DFT-D) for the 94 elements H-Pu. J. Chem. Phys. 2010, 132, 154104. 10.1063/1.3382344. [DOI] [PubMed] [Google Scholar]
- Kühne T. D.; Krack M.; Mohamed F. R.; Parrinello M. Efficient and accurate car-parrinello-like approach to born-oppenheimer molecular dynamics. Phys. Rev. Lett. 2007, 98, 66401. 10.1103/PhysRevLett.98.066401. [DOI] [PubMed] [Google Scholar]
- Lan J.; Hutter J.; Iannuzzi M. First-Principles Simulations of an Aqueous CO/Pt(111) Interface. J. Phys. Chem. C 2018, 122, 24068. 10.1021/acs.jpcc.8b05933. [DOI] [Google Scholar]
- VandeVondele J.; Hutter J. An efficient orbital transformation method for electronic structure calculations. J. Chem. Phys. 2003, 118, 4365–4369. 10.1063/1.1543154. [DOI] [Google Scholar]
- Cheng J.; Liu X.; VandeVondele J.; Sulpizi M.; Sprik M. Redox potentials and acidity constants from density functional theory based molecular dynamics. Acc. Chem. Res. 2014, 47, 3522. 10.1021/ar500268y. [DOI] [PubMed] [Google Scholar]
- Rizo R.; Sitta E.; Herrero E.; Climent V.; Feliu J. M. Towards the understanding of the interfacial pH scale at Pt(111) electrodes. Electrochim. Acta 2015, 162, 138. 10.1016/j.electacta.2015.01.069. [DOI] [Google Scholar]
- Skúlason E.; Karlberg G. S.; Rossmeisl J.; Bligaard T.; Greeley J.; Jónsson H.; Nørskov J. K. Density functional theory calculations for the hydrogen evolution reaction in an electrochemical double layer on the Pt(111) electrode. Phys. Chem. Chem. Phys. 2007, 9, 3241. 10.1039/B700099E. [DOI] [PubMed] [Google Scholar]
- Watson G. W.; Wells R. P. K.; Willock D. J.; Hutchings G. J. A comparison of the adsorption and diffusion of hydrogen on the {111} surfaces of Ni, Pd, and Pt from density functional theory calculations. J. Phys. Chem. B 2001, 105, 4889–4894. 10.1021/jp002864c. [DOI] [Google Scholar]
- Christmann K. Interaction of hydrogen with solid surfaces. Surf. Sci. Rep. 1988, 9, 1–163. 10.1016/0167-5729(88)90009-X. [DOI] [Google Scholar]
- Le J.; Cuesta A.; Cheng J. The structure of metal-water interface at the potential of zero charge from density functional theory-based molecular dynamics. J. Electroanal. Chem. 2018, 819, 87. 10.1016/j.jelechem.2017.09.002. [DOI] [Google Scholar]
- Ledezma-Yanez I.; Wallace W. D. Z.; Sebastián-Pascual P.; Climent V.; Feliu J. M.; Koper M. T. M. Interfacial water reorganization as a pH-dependent descriptor of the hydrogen evolution rate on platinum electrodes. Nat. Energy 2017, 2, 17031. 10.1038/nenergy.2017.31. [DOI] [Google Scholar]
- Subbaraman R.; Tripkovic D.; Strmcnik D.; Chang K.-C.; Uchimura M.; Paulikas A. P.; Stamenkovic V.; Markovic N. M. Enhancing Hydrogen Evolution Activity in Water Splitting by Tailoring Li+-Ni(OH)2-Pt Interfaces. Science 2011, 334, 1256–1260. 10.1126/science.1211934. [DOI] [PubMed] [Google Scholar]
- El-Aziz A. M.; Kibler L. A.; Kolb D. M. The potentials of zero charge of Pd(111) and thin Pd overlayers on Au(111). Electrochem. Commun. 2002, 4, 535. 10.1016/S1388-2481(02)00362-4. [DOI] [Google Scholar]
- Pajkossy T.; Kolb D. M. On the origin of the double layer capacitance maximum of Pt(111) single crystal electrodes. Electrochem. Commun. 2003, 5, 283. 10.1016/S1388-2481(03)00046-8. [DOI] [Google Scholar]
- Kolb D. M.; Schneider J. Surface reconstruction in electrochemistry: Au(100-(5*20), Au(111)-(1*23) and Au(110)-(1*2). Electrochim. Acta 1986, 31, 929. 10.1016/0013-4686(86)80005-6. [DOI] [Google Scholar]
- Valette G. Double layer on silver single crystal electrodes in contact with electrolytes having anions which are slightly specifically adsorbed. Part III. The (111) face. J. Electroanal. Chem. Interfacial Electrochem. 1989, 269, 191. 10.1016/0022-0728(89)80112-3. [DOI] [Google Scholar]
- Hussain G.; Pérez-Martínez L.; Le J.-B.; Papasizza M.; Cabello G.; Cheng J.; Cuesta A. How cations determine the interfacial potential profile: Relevance for the CO2 reduction reaction. Electrochim. Acta 2019, 327, 135055. 10.1016/j.electacta.2019.135055. [DOI] [Google Scholar]
- Chen X.; McCrum I. T.; Schwarz K. A.; Janik M. J.; Koper M. T. M. Co-adsorption of Cations as the Cause of the Apparent pH Dependence of Hydrogen Adsorption on a Stepped Platinum Single-Crystal Electrode. Angew. Chem., Int. Ed. 2017, 56, 15025–15029. 10.1002/anie.201709455. [DOI] [PMC free article] [PubMed] [Google Scholar]
- Li J.; Li X.; Gunathunge C. M.; Waegele M. M. Hydrogen bonding steers the product selectivity of electrocatalytic CO reduction. Proc. Natl. Acad. Sci. U. S. A. 2019, 116, 9220–9229. 10.1073/pnas.1900761116. [DOI] [PMC free article] [PubMed] [Google Scholar]
- Amokrane S.; Badiali J. P. A model for the determination of the distance of closest approach of a solvent molecule to a metal surface-application to a silver electrode. Electrochim. Acta 1989, 34, 39–45. 10.1016/0013-4686(89)80007-6. [DOI] [Google Scholar]
- Gaiduk A. P.; Zhang C.; Gygi F.; Galli G. Structural and electronic properties of aqueous NaCl solutions from ab initio molecular dynamics simulations with hybrid density functionals. Chem. Phys. Lett. 2014, 604, 89. 10.1016/j.cplett.2014.04.037. [DOI] [Google Scholar]
- Schmickler W.; Guidelli R. The partial charge transfer. Electrochim. Acta 2014, 127, 489. 10.1016/j.electacta.2014.02.057. [DOI] [Google Scholar]
Associated Data
This section collects any data citations, data availability statements, or supplementary materials included in this article.