

The structure of class IB PI3K (p110γ-p101) reveals mechanism of GPCR activation and differences from class IA PI3Ks.
Abstract
The class IB phosphoinositide 3-kinase (PI3K), PI3Kγ, is a master regulator of immune cell function and a promising drug target for both cancer and inflammatory diseases. Critical to PI3Kγ function is the association of the p110γ catalytic subunit to either a p101 or p84 regulatory subunit, which mediates activation by G protein–coupled receptors. Here, we report the cryo–electron microscopy structure of a heterodimeric PI3Kγ complex, p110γ-p101. This structure reveals a unique assembly of catalytic and regulatory subunits that is distinct from other class I PI3K complexes. p101 mediates activation through its Gβγ-binding domain, recruiting the heterodimer to the membrane and allowing for engagement of a secondary Gβγ-binding site in p110γ. Mutations at the p110γ-p101 and p110γ–adaptor binding domain interfaces enhanced Gβγ activation. A nanobody that specifically binds to the p101-Gβγ interface blocks activation, providing a novel tool to study and target p110γ-p101–specific signaling events in vivo.
INTRODUCTION
The class I phosphoinositide 3-kinase (PI3K) family of heterodimeric enzyme complexes are master regulators of numerous essential functions, including growth, survival, proliferation, and metabolism (1, 2). Activation of PI3K downstream of cell-surface receptors leads to production of the lipid signal phosphatidylinositol 3,4,5-trisphosphate (PIP3), which activates multiple downstream signaling pathways. The lipid kinase activity of class I PI3Ks is mediated by the p110 catalytic subunit, of which there are four isoforms split into class IA (p110α, p110β, and p110δ) and class IB (p110γ) on the basis of their association with distinct regulatory subunits. Class IB p110γ binds to either a p101 or p84 (also called p87) adaptor subunit (3, 4), which mediates activation by upstream stimuli.
The class IB p110 isoform p110γ, encoded by PIK3CG, is a master regulator of immune cell function (5), chemotaxis (6), cytokine release (7), and reactive oxygen species generation (8), which are important processes for both the innate and adaptive immune systems. It is a key factor in multiple inflammatory diseases, including rheumatoid arthritis (9), atherosclerosis (10), lupus (11), allergy (7), cardiovascular diseases (12), obesity-related changes in metabolism (13), and pulmonary fibrosis (14). The immunomodulatory effects of PI3Kγ are drivers of pancreatic ductal adenocarcinoma (15), and targeting PI3Kγ in combination with checkpoint inhibitors has shown promise as an anticancer therapeutic (16, 17). Its ability to mediate multiple immune cell functions is controlled by its activation downstream of diverse cell-surface receptors, including G protein–coupled receptors (GPCRs) (18), the immunoglobulin E (IgE) antigen receptor (7), receptor tyrosine kinases (19), and Toll-like receptors (TLRs) (20).
Structural and biophysical analysis have provided initial insight into the regulation of p110γ and its activation by upstream stimuli. The structure of a p110γ fragment revealed a conserved molecular architecture shared by all p110 subunits composed of a Ras-binding domain (RBD), which mediates activation by the small guanosine triphosphatase Ras (21), a C2 domain, an armadillo repeat helical domain, and an archetypal bilobal kinase domain, similar to protein kinases (Fig. 1A) (22). Sequence analysis suggested the presence of a ubiquitin-like domain at the N terminus, possibly playing a similar function as the adaptor binding domain (ABD) of class IA PI3Ks. Both p101 and p84 differ from the class IA PI3K regulatory subunits as they are not essential for p110 stability and do not inhibit lipid kinase activity (4) but, instead, mediate activation by upstream stimuli. The molecular basis for why regulatory subunits differentially regulate class IA and IB PI3Ks has remained elusive.
Fig. 1. Cryo-EM structure of the p110γ p101 complex.
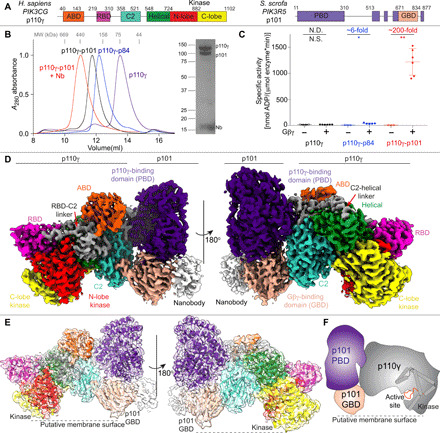
(A) Domain schematic of Homo sapiens p110γ and Sus scrofa p101 used in this study. (B) Gel filtration elution profile of different p110γ complexes (i.e., apo or bound to p84, p101, and p101-NB1-PIK3R5). An SDS–polyacrylamide gel electrophoresis image of the p110γ-p101-NB1-PIK3R5 complex is shown, with molecular weight (MW) standards indicated. (C) Lipid kinase activity assays of different p110γ complexes (concentration, 30 to 3000 nM) with and without lipidated Gβγ (1.5 μM concentration) using 5% phosphatidylinositol 4,5-bisphosphate (PIP2) vesicles mimicking the plasma membrane (20% phosphatidylserine, 50% phosphatidylethanolamine, 10% cholesterol, 10% phosphatidylcholine, 5% sphingomyelin, and 5% PIP2). The fold change upon Gβγ activation is indicated. Every replicate is plotted, with error shown as SD (n = 3 to 6). Two-tailed P values represented by the symbols as follows: ** < 0.001; * < 0.02; N.S. > 0.02. (D) Density map of the p110γ-p101-NB1-PIK3R5 complex colored according to the schematic in (A). (E) Cartoon representation of the p110γ-p101 complex colored according to the schematic in (A). (F) Cartoon schematic of the p110γ-p101 complex.
The class I PI3Ks are frequently misregulated in multiple human diseases (23). This is most evident by the high frequency of hotspot somatic-activating mutations found in PIK3CA (encodes for p110α) in multiple human cancers (24). The other class I PI3K isoforms are also potentially involved in cancer, with overexpression of these p110 catalytic subunits leading to oncogenic transformation in cells (25). Both overexpression of PIK3CG and rare point mutations spanning the catalytic subunit have been identified in tumor biopsies (26–28). The mechanisms by which these mutations affect lipid kinase activity cannot be clearly explained by the existing structure of the catalytic subunit alone, highlighting the importance of understanding the molecular details of PI3Kγ regulatory complexes.
PI3Kγ is mainly activated downstream of GPCRs, where the presence of different adaptor subunits greatly modulates activation. The p84 and p101 subunits show distinct expression profiles and alter PI3Kγ signaling responses to distinct upstream inputs (29). In vivo, the p110γ catalytic subunit alone is unable to be activated downstream of GPCRs and requires either the p101 or p84 regulatory subunits to respond to GPCRs (30). In vitro, the p101 subunit forms an obligate heterodimer with p110γ, while p84 forms a weaker transient interaction with p110γ (29). Both p101 and p84 play unique roles, with neutrophils lacking p84 having reduced reactive oxide species generation and neutrophils lacking p101 showing impaired migration (31). The distinct signaling responses were attributed to differential sensitivity of each of the PI3Kγ heterodimers to Gβγ subunits, with the p110γ-p101 complex being preferentially activated by Gβγ (4, 32) and p110γ-p84 requiring Ras binding for activation (33). To better understand how preferences for activating inputs translate into differences in function, there is a need for molecules that selectively inhibit one of the two p110γ complexes without affecting the other.
To decipher the molecular mechanism of how the p101 subunit regulates p110γ activation, we determined the structure of the p110γ-p101 complex using cryo–electron microscopy (cryo-EM). This structure reveals a novel binding interface between p101 and p110γ, which is completely distinct with the interface of class IA PI3K adaptors. Our structure also validates the presence of an ABD in p110γ similar to other class I PI3Ks, although with a unique orientation. Distinct from class IA PI3Ks, the ABD does not directly bind the p101 regulatory subunit but instead orients the RBD-C2 linker for productive binding to p101. Intriguingly, oncogenic mutations found in p110γ localize at the interface of the p110γ with the p101 subunit and at the interface of the ABD with the RBD-C2 linker that is critical for binding p101. Hydrogen-deuterium exchange mass spectrometry (HDX-MS) analysis revealed the altered dynamics of the p110γ-p101 interfaces upon mutation, leading to increased activation by Gβγ. The structure also showed that the Gβγ-binding domain (GBD) in p101 contains a putative membrane–binding surface that positions p110γ for catalysis. Single-molecule fluorescence microscopy experiments indicated that the full activation of the p110γ-p101 complex requires the engagement of two Gβγ molecules to p101 and p110γ, respectively. Last, a nanobody used in the cryo-EM analysis was found to be a potent inhibitor of GPCR activation of only p110γ-p101, with no effect on p110γ-p84. This nanobody could be used to decipher the complex specific roles of PI3Kγ in immune cell signaling while also providing a novel potential therapeutic strategy for targeting unique PI3Kγ complexes.
RESULTS
Structure of the p110γ-p101 complex
We purified full-length human p110γ alone, as well as the p110γ-p84 and p110γ-p101 complexes (Fig. 1, A and B). Gel filtration elution profiles of the p110γ-p84 and p110γ-p101 complexes confirmed their heterodimeric stoichiometry. Lipid kinase assays testing Gβγ activation revealed an ~100- to 200-fold activation of p110γ-p101, a less potent ~6-fold activation of p110γ-p84, and limited activation for p110γ alone—results that are consistent with previous work (32) (Fig. 1C). To delineate the molecular basis for how p101 protein controls the activation of p110γ, we examined its architecture using an approach combining HDX-MS and cryo-EM.
We first conducted cryo-EM analysis of the p110γ-p101 complex. Although negative stain analysis revealed that purified p110γ-p101 was homogeneous, and high-quality vitrified specimens from this relatively small-sized and asymmetric complex could be obtained, the region encompassing the p101 regulatory subunit was poorly resolved in our initial three-dimensional (3D) reconstruction of p110γ-p101. This could be attributed to the highly dynamic nature of the C-terminal region of p101. To obtain a more “rigid” complex for cryo-EM analysis, we screened nanobodies targeting p110γ-p101 and found one that specifically stabilized the p101 C-terminal domain (NB1-PIK3R5; full details to be published in a separate manuscript). We purified the nanobody-bound p110γ-p101 complex to homogeneity, with this complex eluting at a slightly higher-than-expected size on gel filtration (~430 kDa) (Fig. 1B). Using this sample, we were able to obtain a cryo-EM reconstruction of the ternary complex of nanobody-bound p110γ-p101 at 2.9-Å overall resolution from 320,179 particles (figs. S1 to S3 and table S2). The density map was of sufficient quality to allow for automated and manual building of most p110γ and p101 subunits (Fig. 1, D to F). We were able to unambiguously fit available crystal structures of p110γ (144-1102) (34) into our map and build an additional 210 residues that constitute the ABD, the linkers connecting the RBD-C2 and C2-helical domains, and the kinase domain activation loop (fig. S3C). The region with the lowest local resolution was the GBD of p101, along with the bound nanobody. The GBD forms a β sandwich structure composed of two sheets, and the initial automated and manual model building only allowed for partial building of one of the two sheets. To build the remainder of the GBD, we used a combination of Rosetta de novo modeling (35) and a trRosetta-guided protein folding method (fig. S2) (36). This allowed us to build a complete model of the structured regions of p101 (fig. S4).
The p101 regulatory subunit structure (fig. S4, A to C) features a helical solenoid (11 to 149, 186 to 267) and an α/β barrel (150 to 185, 268 to 670, 867 to 877)—which together we refer to as the p110γ-binding domain (PBD)—and a β sandwich GBD (671 to 834). In addition to these motifs, there are four linker regions that were not resolved in the electron density map (311 to 512, 560 to 603, 623 to 650, and 835 to 866). Comparisons between p101 and p84 revealed that the structured regions of the PBD and GBD are partially conserved (28% identity and 47% similarity for the PBD and 24% identity and 44% similarity for the GBD) (fig. S4E). We analyzed our p101 model using the distance matrix alignment (DALI) server (37) and found multiple lipid kinases that shared a similar arrangement of an α/β barrel and β sandwich domain, including diacylglycerol kinase, the phosphatidyl kinase YegS, and sphingosine kinase 1 (fig. S4D). The catalytic residues at the active site were not conserved, suggesting that p101 has no kinase activity. However, comparing the previously identified lipid-binding region of sphingosine kinase 1 (38) with p110γ-p101 showed that the corresponding region of p101 is oriented toward the putative membrane interface (Fig. 1, E and F), indicating a membrane-binding site in p101. The p110γ kinase domain is also oriented in a productive orientation for membrane binding, with the previously identified membrane-binding sites (kα1-kα2 loop and the C terminus of the kinase domain) oriented toward the membrane surface. The active site in this conformation would be ~5 to 10 Å from the putative membrane surface.
Molecular details of the p110γ-p101 interface
Our cryo-EM structure revealed that p101 engages p110γ in an extended interface resulting in a buried surface area of ~1202 Å2 (Fig. 2, A and B, and fig. S5, A and B). There are three specific regions of p110γ that bound to p101: the C2 domain and the two linkers between the RBD-C2 and the C2-helical domains (Fig. 2A). These interdomain linkers were not resolved in previous structures of p110γ alone and contain critical contact residues with p101. The primary binding interface on p101 is composed of the helices α5 and 6 and the intervening turn in the PBD, which interacts with the C2 domain and linkers. This is consistent with previous cellular data that showed that residues 25 to 175 of the PBD of p101 were sufficient for interaction with p110γ (39). The C2 domain also makes an additional interaction with the C-terminal proline of p101. These interfacial residues are strongly conserved across evolution (fig. S4E). Intriguingly, we found that the PBD contact residues in p101 were also conserved with p84 (78% identical, 89% similar), revealing a likely shared mode of binding for both regulatory subunits.
Fig. 2. Structural basis of the p110γ-p101 binding interface.
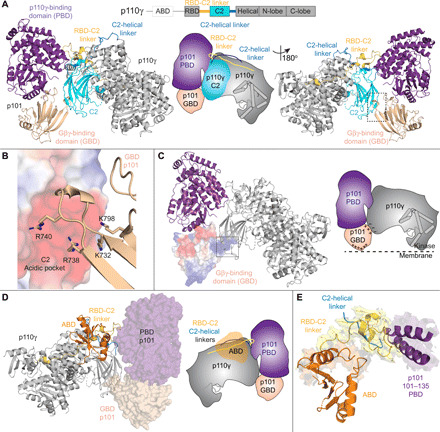
(A) Cartoon representation of the p110γ-p101 complex, with p101 colored as in Fig. 1 and p110γ colored according to the attached schematic, with p101-interacting regions (RBD-C2 linker, C2, and the C2-helical linker) indicated. Important features are shown in a cartoon schematic. (B) Interaction between the GBD of p101 and the C2 domain of p110γ. The p110γ C2 domain is shown as an electrostatic surface with p101 shown as sticks. (C) The electrostatic surface of the GBD of p101. A cartoon schematic highlighting potential electrostatic interactions between the GBD of p101 and the C2 domain of p110γ and membranes. (D) The structure of p110γ-p101 complex highlighting the orientation of the p110γ ABD, with p101 shown as a transparent surface. The different domains are colored as indicated according to the cartoon schematic. (E) The ABD of p110γ coordinates the RBD-C2 linker of p110γ to interact with p101. The RBD-C2 linker, ABD, and the region of p101 that binds the RBD-C2 linker are shown in a cartoon representation. The electron densities of the ABD interface, RBD-C2 linker, and region of p101 that binds the RBD-C2 linker are visible.
A secondary contact site between p101 and p110γ is formed between two β strands in the GBD of p101 (729 to 741) and the C2 domain of p110γ (fig. S5B). This interface is formed by multiple electrostatic interactions between positively charged residues from the GBD of p101 and an anionic surface in the C2 domain of p110γ (Fig. 2B and fig. S5B). This anionic surface in the C2 is absent in all other class I PI3Ks. Residues forming this contact site are conserved in the evolutionary history of both p101 and p110γ but are only partially conserved in p84 (57% identical, 86% similar), suggesting that the dynamics of this contact may be altered between the two complexes. This unique interface could explain how a previously designed C2-binding antibody specifically inhibited GPCR activation of p110γ-p84 over p110γ-p101 (40).
To verify the contacts observed in the cryo-EM structure of p110γ-p101 and to compare to dynamics at the p110γ-p84 interfaces, we carried out HDX-MS experiments on p110γ alone and with the two regulatory subunits. Consistent with our previous work (32, 41), we found that with both p84 and p101, there was protection of large sections of the ABD and C2 domains along with the RBD-C2 and C2-helical linkers (fig. S6, A to C, and table S3). The same regions were protected in both complexes; however, the differences were larger in the presence of p101, indicating enhanced stability of the p101-bound complex. These differences in stability can be explained by the only partial conservation of the secondary interface residues between p101 and p84, in line with previous data (29).
Previous work showed that the interaction of the p110γ with its regulatory partners required the presence of the N-terminal ABD (41). Intriguingly, the ABD in p110γ does not directly interact with the regulatory subunit but instead forms extensive contacts with the RBD-C2 linker (Fig. 2D and fig. S5, C and D) to orient the two linkers for binding the PBD of p101 (Fig. 2E and fig. S5E). Consistent with this structural information, HDX-MS analysis of full-length p110γ compared to a ΔABD construct (144 to 1102) showed clear protection of the RBD-C2 linker by the ABD (fig. S6D).
Comparison of regulatory subunit interactions in class IB to class IA PI3Ks
All class I PI3Ks bind to regulatory subunits, with the class IA PI3Ks binding to five different p85 regulatory subunits. p85 binding has three main effects: (i) It stabilizes the p110 catalytic subunit, (ii) inhibits basal lipid kinase activity, and (iii) allows activation downstream of pYXXM motifs (42). In contrast, association with class IB regulatory subunits neither stabilizes nor inhibits the p110γ catalytic subunit. To explain these differences in regulation, we compared the orientation of adaptor subunits and the ABD between class IA and class IB PI3Ks (Fig. 3, A to D).
Fig. 3. Class IA and IB PI3Ks form distinct interfaces with regulatory subunits and the ABD.
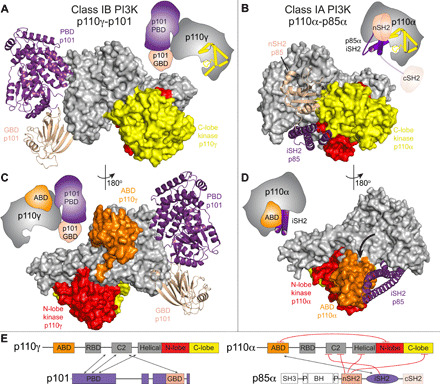
(A) The structure of p110γ-p101 complex, with p110γ shown as a surface, p101 shown as a ribbon, and the domains colored according to the cartoon schematic as indicated in (E). (B) The structure of p110α-p85α complex [Protein Data Bank (PDB): 4JPS], with p110α shown as a surface, the nSH2 and iSH2 domains of p85α shown as a ribbon, and the domains colored according to the cartoon schematic as indicated in (E). (C) The ABD of p110γ does not interact with either the regulatory subunit or kinase domain. The p110γ-p101 complex is shown as in (A). (D) The ABD of p110α interacts with both the regulatory subunit and the kinase domain. The p110α-p85α complex is shown as in (B). The altered orientation of the ABD compared to p110γ is indicated by the black arrow. (Cartoon schematics indicating the differences between class IA and class IB are shown for (A) to (D). (E) Domain schematic comparing the interactions between p110 catalytic and the p101/p85 regulatory subunits. Inhibitory interactions are colored in red, with interacting regions indicated by the arrows.
The binding interface with regulatory subunits is completely distinct in class IA PI3Ks compared to class IB. While the C2 domain of class IA PI3Ks does interact with the iSH2 and nSH2 domains of p85 regulatory subunits, the interface is different from the one that binds the PBD and GBD of p101. Regulatory subunits in class IA PI3Ks make extensive inhibitory interactions with the C-lobe of the kinase domain, while no such contact is observed in the p110γ-p101 complex. Although ABDs of class IA and IB share a similar overall fold (fig. S7, A and B), there are extensive conformational differences in secondary structure elements, consistent with the limited sequence conservation (identity ranging from 13 to 16% for p110α, p110β, and p110δ). The ABD from class IA PI3Ks is required for forming a high-affinity interaction with the iSH2 from p85, mediated by contacts between strands β1 and β2 and helix α3. This region is at the surface in the p110γ ABD, making no interactions with the rest of the p110γ subunit (fig. S7, C and D). For all class IA PI3Ks, the ABD forms an inhibitory contact with the N-lobe of the kinase domain through its N terminus and the β4-α3 loop. The ABD in p110γ is rotated 180° around the ABD-RBD linker, allowing the β4-α3 loop to bind to the RBD-C2 linker. The residues in these regions are highly conserved in the evolution of p110γ, with no conservation with other class I PI3Ks (fig. S7, E and F). Overall, this comparison reveals why p110γ is not inhibited by p101 unlike class IA PI3Ks, which are potently inhibited by extensive intra- and intersubunit contacts with regulatory partners. (Fig. 3E).
Rare oncogenic mutations cluster at the p101 and ABD interfaces in p110γ
The PI3K-Akt pathway is the most commonly activated pathway in human cancer, primarily driven by activating oncogenic mutations in the PIK3CA gene encoding p110α. The role of the p110γ isoform in cancer development has been ambiguous, with overexpression and rare somatic mutations of PIK3CG implicated in multiple cancers, including pancreatic, prostate, renal, and breast. To further explore whether activating mutations potentially exist in PIK3CG, we analyzed the Catalog Of Somatic Mutations In Cancer (COSMIC) (43), which showed mutations spanning the primary sequence of p110γ. Intriguingly, many of the most frequent mutations in p110γ mapped to interfaces with either the ABD or p101 (Fig. 4A).
Fig. 4. Disease-linked and engineered p110γ mutations at the interface with p101 and the ABD modulate Gβγ activation.
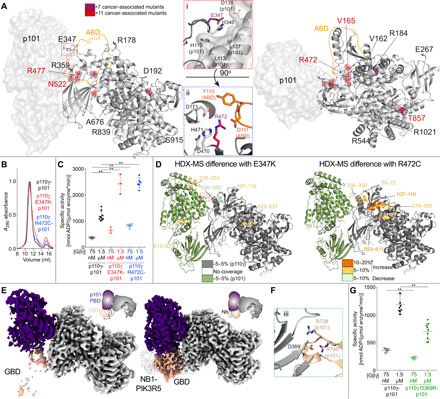
(A) Somatic mutations found in PIK3CG from the COSMIC database are indicated on the structure, with frequency indicated by the legend. Mutations found in more than 7 tumors are shown as sticks, with mutations found in more than 11 tumors shown as spheres. The orientation of residues around mutations located at the p110γ-p101 interface (i, E347) and ABD interface (ii, R472) are shown. (B) Mutations do not disrupt the p110γ-p101 complex. Gel filtration elution profiles of complexes of p110γ (WT, E347, and R472) bound to p101. (C) Mutations at the p110γ-p101 and ABD interface can lead to enhanced activation by Gβγ. Lipid kinase activity assays of different p110γ complexes (concentration, 10 to 1000 nM) with and without Gβγ (concentration indicated). (D) HDX-MS revealed enhanced protein dynamics at p101 and ABD interfaces induced by E347K and R472 mutants. Peptides showing significant deuterium exchange differences (>5%, >0.4 kDa, and P < 0.01 in an unpaired two-tailed t test) between p110γ-p101 complexes of WT and E347K (left) and WT and R472C (right) are colored on a cartoon model of p110γ-p101 according to the legend. (E) The GBD is dynamic in solution but is stabilized by nanobody (NB1-PIK3R5) binding. Electron density maps of p110γ-p101 alone (left) and p110γ-p101 bound to NB1-PK3R5 (right). (F) Charged residues in p110γ-p101 mediate the interaction of the p110γ C2 domain to the p101 GBD. (G) Mutation of the p110γ-C2 p101-GBD interface (p110γ D369R) leads to decreased activation by Gβγ. Biochemical assays in (C) and (G) were carried out with p110γ-p101 complexes (concentration, 10 to 1000 nM) and Gβγ (concentration indicated). Five percent PIP2 membranes were made mimicking the plasma membrane. Every replicate is plotted, with error shown as SD (n = 3 to 9). Two-tailed P values represented by the symbols in panels C+G as follows: ** < 0.001; * < 0.02.
To identify the consequence of these interfacial mutations, we purified mutant complexes of p101 with p110γ E347K (p101 interface) and p110γ R472C (ABD interface). Mutant complexes eluted from gel filtration similar to wild type (WT) (Fig. 4B), demonstrating that they can still form heterodimers. Lipid kinase assays showed that the mutations resulted in an approximately two to threefold increased activity at both saturating and subsaturating amounts of Gβγ (Fig. 4C). To understand the mechanism of how these mutations lead to increased kinase activity, we carried out comparative HDX-MS experiments between the WT and mutant p110γ-p101 complexes. The E347K mutant caused increased dynamics at the p101 interface with p110γ, while the R472C mutant led to increased dynamics of the ABD and the RBD-C2 linker (Fig. 4D and fig. S8, A and B). This suggests that altering the orientation of p101 and ABD relative to the rest of p110γ may allow for increased access to membrane-localized Gβγ subunits.
In addition to the mutations at the primary interface between p110γ and p101, we also wanted to determine the role of the GBD-C2 interface in regulating Gβγ activation. This was motivated by analysis of the electron density maps between the free p110γ-p101 complex and the p110γ-p101 complex with the NB1-PIK3R5 nanobody, which showed that the GBD is highly dynamic in the absence of the nanobody (Fig. 4E). We mutated a residue in the C2 domain (D369R) that interacts with R738 and R740 in the GBD (Fig. 4F). The p110γ D369R-p101 mutant eluted from gel filtration as a heterodimer, showing that this contact is not required for p101 binding. Lipid kinase activity assays revealed that this mutation led to an approximately twofold decrease in activation by Gβγ subunits, indicating that the secondary p110γ-p101 interface is crucial in mediating full activation (Fig. 4G).
The GBD is critical for membrane binding and Gβγ activation
To decipher how p101 mediates activation by Gβγ, we have previously examined the dynamic consequences of p110γ-p101 binding to membranes and membrane-localized Gβγ subunits using HDX-MS (32). Our current model of p110γ-p101 allowed us to better understand these data in the context of the full complex. Analysis of the HDX differences upon membrane binding indicated the presence of a membrane-binding region in the GBD and protection at the secondary interface between p110γ and p101 (Fig. 5A, and fig. S8, C and E). Upon binding to Gβγ subunits, many of these same regions showed greatly decreased exchange indicating enhanced membrane recruitment. In addition, the Gβγ-binding sites (p101 GBD and p110γ helical domain) showed decreases in exchange (Fig. 5B, and fig. S8, D and E). Combined with our observations of the GBD flexibility in cryo-EM and activity assays with the p110γ D369R mutant, this HDX-MS data indicated that the GBD forms the secondary interface upon membrane binding, potentially explaining the inability of nonlipidated soluble Gβγ (C68S, Gγ) to interact with p110γ-p101.
Fig. 5. Full activation of p110γ by lipidated Gβγ requires the GBD domain of p101, and the GBD-Gβγ interface can be disrupted by a p101-specific nanobody.
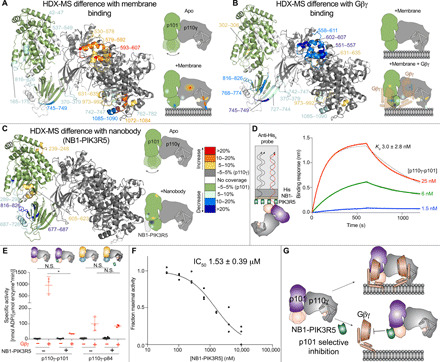
(A) HDX-MS revealed that interaction of p110γ-p101 with membranes leads to altered protein dynamics in both the p110γ and p101 subunits, with stabilization of the GBD of p101. For (A) to (C), peptides showing significant deuterium exchange differences (>5%, >0.4 kDa, and P < 0.01 in an unpaired two-tailed t test) between conditions are colored on a cartoon model of p110γ-p101 according to the legend in (B). A cartoon schematic is shown indicating the two conditions compared using HDX-MS. (B) HDX-MS revealed that interaction of p110γ-p101 with lipidated Gβγ subunits stabilizes the GBD and C2-helical/helical domain of p110γ. The HDX-MS data from (A) and (B) are from our previous study (32) and have been mapped onto the p110γ-p101 structure. (C) HDX-MS revealed that interaction of p110γ-p101 with NB1-PIK3R5 protects the same surface of GBD that is stabilized upon binding Gβγ on membranes. (D) Biolayer interferometry analysis of the binding of the immobilized NB1-PIK3R5 nanobody to p110γ-p101. (E) The NB1-PIK3R5 nanobody specifically inhibits only the p110γ-p101 complex from GPCR activation while not affecting the p110γ-p84 complex. Biochemical assays were carried out with p110γ-p101 (50 to 3000 nM) and p110γ-p84 (1500 to 3000 nM) using plasma membrane mimic vesicles with and without NB1-PK3R5 (6 μM). Lipidated Gβγ was present at 1.5 μM concentration. (F) IC50 measurement of p110γ-p101 inhibition using varying concentrations of the NB1-PIK3R5 nanobody in the presence of 600 nM Gβγ. For (E) and (F), every replicate is plotted, with error shown as SD (n = 3 to 6). Two-tailed P values represented by the symbols in panel E as follows: ** < 0.001; * < 0.02; N.S. > 0.02. (G) Model of the inhibition of GPCR activation of the p110γ-p101 complex by the NB1-PIK3R5 nanobody.
A p101-binding nanobody prevents activation by Gβγ subunits
HDX-MS analysis of the NB1-PIK3R5 nanobody used in cryo-EM experiments of p110γ-p101(Figs. 1D and 5C and fig. S8F) showed that it binds with high affinity (~3 nM) to the identified Gβγ-binding site in the GBD (Fig. 5D). This suggested that this nanobody might be useful in specifically disrupting Gβγ activation of the p110γ-p101 complex. We used lipid kinase assays with both p110γ-p101 and p110γ-p84 to study the effects of NB1-PIK3R5 on GPCR activation. The NB1-PIK3R5 nanobody at 6 μM led to a ~50 to 100-fold reduction in Gβγ activation for p110γ-p101 with no effect on p110γ-p84 activation (Fig. 5E). The nanobody was capable of potently inhibiting the p110γ-p101 complex [median inhibitory concentration (IC50) ~ 1.5 μM] at superphysiological levels of Gβγ (600 nM) (Fig. 5F), thereby providing a novel tool that may aid in deciphering the exact roles of the p110γ-p101 complex in cells/tissues (Fig. 5G) and in designing complex-specific therapeutic strategies.
Defining the molecular basis of how Gβγ subunits activate the p110γ-p101 complex
Structural analysis of the Gβγ-binding sites in p110γ and p101 from HDX-MS indicated that these regions are separated by ~50 Å, which is greater than the ~40-Å diameter of the Gβγ propeller domain. This suggested that activation of p110γ-p101 is potentially mediated by interactions with two membrane-anchored Gβγ molecules. To gain new insight about the mechanism of Gβγ-dependent activation of p110γ-p101, we performed single-molecule total internal reflection fluorescence (TIRF) microscopy experiments on supported lipid bilayers (SLBs) (Fig. 6A and fig. S9). Experiments were carried out using fluorescently tagged proteins [Dyomics647 (DY647)–p110γ, DY647-p110γ-p101, and Alexa Fluor 488–soluble N-ethylmaleimide–sensitive factor attachment protein (SNAP)–Gβγ] to track membrane binding. For these experiments, we flowed farnesylated Alexa Fluor 488–SNAP–Gβγ over an SLB, leading to passive insertion into the membrane (t1/2 ~ 8 min; fig. S9). Single-molecule dwell time measurements of fluorescently tagged DY647-p110γ and DY647-p101-p110γ revealed no appreciable membrane binding in the absence of Gβγ (Fig. 6B). In the presence of membrane-anchored Gβγ, we observed an increased binding frequency of DY647-p110γ and transient dwell times that lasted 10 to 100 ms (Fig. 6, B and C). By contrast, DY647-p101-p110γ bound strongly to membrane-anchored Gβγ and exhibited single-molecule dwell times that lasted several seconds (Fig. 6, B and D, and table S4).
Fig. 6. Single-molecule characterization of p110γ-p101 reveals that both subunits can engage membrane-anchored Gβγ.
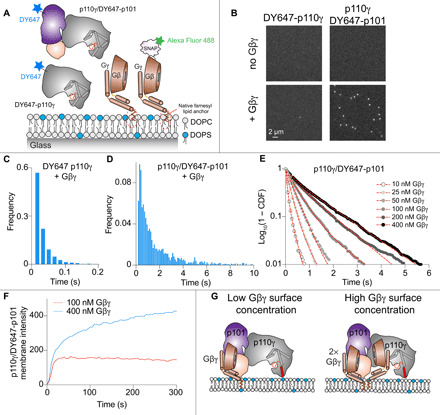
(A) Schematic showing proteins examined using the single-molecule fluorescence approach. Experiments measured the association of fluorescently tagged proteins (Alexa Fluor 488–SNAP–Gβγ, DY647-p110γ, and DY647-p101-p110γ) to an SLB. DOPC, 1,2-dioleoyl-sn-glycero-3-phosphocholine; DOPS, 1,2-dioleoyl-sn-glycero-3-phospho-l-serine. (B) Membrane association of DY647-p110γ or DY647-p101-p110γ requires membrane-anchored Gβγ. Single-molecule localization measurements were measured in the presence of either 100 pM DY647-p110γ or 10 pM DY647-p101-p110γ. The small number of DY647-p110γ (+Gβγ) seen in the snap shot image reflects the transient nature of the interaction between DY647-p110γ and Gβγ. (C and D) Single-molecule dwell time distributions of DY647-p110γ or DY647-p101-p110γ, measured in the presence of membrane-anchored Gβγ. DY647-p110γ transiently associates with membrane-anchored Gβγ (C, τ1 = 22 ms, n = 2832 events). DY647-p101-p110γ binds strongly to membrane-anchored Gβγ [τ1 = 0.334 s (31%), τ2 = 1.31 s (69%), n = 3996 events]. (E) Gβγ membrane density–dependent changes in the membrane binding behavior of DY647-p101-p110γ. Concentration of Gβγ represents the solution concentration. (F) DY647-p101-p110γ absorption kinetics at different Gβγ membrane densities. (G) Model of p110γ-p101 recruitment to Gβγ subunits at both low and high membrane densities.
Because both subunits in the p110γ-p101 complex contain Gβγ-binding interfaces, we hypothesized that the single-molecule dwell times of DY647-p101-p110γ would strongly depend on the concentration of membrane-anchored Gβγ. When we titrated the concentration of Gβγ, we observed a density-dependent switch in p110γ-p101 membrane binding behavior (Fig. 6E and table S4). In the presence of low Gβγ concentration (i.e., ≤ 100 nM), the dwell time distribution of DY647-p101-p110γ was best described by a single exponential decay curve with dwell times ranging from 100 to 400 ms (table S4). In contrast, we observed longer-lived membrane binding interactions when our measurements were performed using more than 100 nM Gβγ. Under these conditions, the dwell time distribution shifted from a single to double exponential decay curve (table S4).
Consistent with the concentration of Gβγ modulating the dwell time of DY647-p101-p110γ, we also observed changes in the bulk membrane absorption kinetics of p110γ-p101 (Fig. 6F). In the presence of low Gβγ concentrations (100 nM), DY647-p101-p110γ rapidly associated with the membrane and reached an equilibrium within ~30 s (Fig. 6F). This is the expected kinetic profile for a simple biomolecular interaction between two proteins. In contrast, the membrane absorption kinetics of DY647-p101-p110γ was biphasic in the presence of 400 nM Gβγ (Fig. 6F). Under these conditions, DY647-p101-p110γ association kinetics are described by rapid binding to the first Gβγ, followed by slow engagement with a second Gβγ (Fig. 6F). This type of biphasic membrane absorption is similar to how Bruton’s Tyrosine Kinase (BTK) reportedly interacts with two PIP3 lipids (44). In summary, our TIRF microscopy measurements show that the p110γ-p101 can engage up to two Gβγ molecules depending on the level of GPCR activation (Fig. 6G).
DISCUSSION
Understanding how p110γ activity is regulated by p84 or p101 regulatory subunits has been critical in deciphering physiological roles (30, 31, 45) and will be important in effective PI3K therapeutic design. The class IB p110γ catalytic subunit is a key regulator of immune cell signaling and is a therapeutic target for inflammatory diseases (9) and immunomodulatory cancer treatment (16, 17). Here, we report the architecture of the p110γ-p101 complex and a new mechanism of how it can be activated during GPCR signaling.
Our cryo-EM structure of p110γ-p101 reveals important differences in the assembly of catalytic and regulatory subunits between class IA and class IB PI3Ks and provides novel insight into PI3K regulation. Previous x-ray crystallographic studies of a p110γ fragment revealed its domain organization and the molecular basis for interaction with the upstream activator Ras (21, 22, 34). Our cryo-EM structure showed an evolutionarily well-conserved binding surface between the regulatory p101 subunit and p110γ. The primary interface of p101 with p110γ is composed of the PBD of p101 and the C2 domain and C2-helical/RBD-C2 linkers of p110γ. This p101 interface in the PBD is well conserved in p84. There is a secondary site in the GBD of p101, with this site being less conserved in p84, which may explain the decreased stability of the p110γ-p84 complex compared to the obligate p110γ-p101 heterodimer. The p110γ ABD does not directly bind p101 but instead coordinates the p101 interaction site on the RBD-C2 linker. This unique architecture is distinct from the ABD in class IA PI3Ks, which mediates direct contacts with the iSH2 of p85 and forms an inhibitory interface with the N-lobe of the kinase domain (46). The hydrophobic surface that mediates binding of class IA ABD domains to the iSH2 of p85 regulatory subunits is absent in the ABD of p110γ, and this may explain the decreased stability of the class IA p110 subunits in the absence of regulatory subunits compared to free class IB p110γ.
The architecture of the p110γ-p101 complex reveals how the GBD of p101 orients the kinase domain of p110γ toward the membrane upon Gβγ binding. The p101 protein was identified as a key regulator of the activation of p110γ by GPCRs (4, 47); however, defining the full details of this mechanism was hampered by a paucity of structural information. Complicating structural analysis of p101 is the lack of homologous proteins, with p84 being the only protein with greater than 20% sequence identity in the human proteome. Our p101 structural model validated and defined, at high resolution, the presence of a Gβγ-binding surface on the GBD of p101 (32). The structural similarity of the α/β barrel and the GBD of p101 with the lipid-binding surfaces of the lipid kinases diacylglycerol and sphingosine (38) supports the idea that the GBD participates in membrane binding upon Gβγ activation. Cellular studies revealed that Gβγ was able to activate membrane-localized p110γ, suggesting that Gβγ may orient p110γ in a catalytically competent state (48). Our structure reveals how the GBD participates in membrane and Gβγ binding, which orients the kinase domain for catalysis. Once recruited to the membrane, the p110γ-p101 complex can engage a second Gβγ-binding site located on the helical domain of p110γ, leading to full activation. Further structural analysis of the GBD bound to Gβγ will be required to narrow down the exact molecular details of GPCR activation.
The ability of p110γ to generate discrete PIP3 signals upon activation by a unique set of upstream stimuli is critical to their role in immune cells and is ultimately controlled by the p101 and p84 regulatory subunits. This has been highlighted by responses in neutrophils and mast cells, where p101 complexes mediate cell migration and p84 complexes mediate reactive oxide production and degranulation (31, 45). Various stimuli have been identified that can activate p110γ, including GPCRs (4), Ras (21), TLRs (mediated by Rab8 activation) (49), and the IgE antigen receptor (partially mediated by protein kinase C phosphorylation of p110γ) (41). The p101 and p84 regulatory subunits confer the ability to be preferentially stimulated by a specific subset of these stimuli. The p110γ-p84 complex is uniquely sensitive to Ras activation (33) and is less responsive to signals downstream of GPCRs in comparison to the p101 complex (30). Our TIRF microscopy data reveal how p110γ-p101 is uniquely situated to generate varying PIP3 responses depending on the different Gβγ membrane surface densities (Fig. 7A). The GBD of p101 uniquely responds to low Gβγ surface densities and allows for distinct p110γ-p101–stimulated PIP3 responses compared to p110γ-p84. Once p110γ-p101 is localized on the membrane surface through the p101-Gβγ interface, it can bind the secondary Gβγ-binding site on the helical domain, which situates the kinase domain in an orientation optimized for lipid kinase activity. In combination with the membrane-localized activators Ras and Rab8, this allows for a multifaceted set of PIP3 responses generated by p110γ-p101.The exact molecular details of activated p110 binding to phosphatidylinositol 4,5-bisphosphate (PIP2) substrate on a membrane surface will require additional biophysical and biochemical experimentation.
Fig. 7. Model for regulation of p110γ-p101 activation by Gβγ membrane density and modulation by nanobodies and disease-linked mutations.
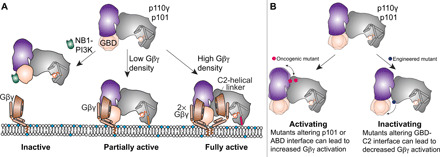
(A) Schematic of how Gβγ subunits can lead to p110γ-p101 activation at different Gβγ surface densities and how this can be disrupted by the NB1-PIK3R5 nanobody. (B) Schematic of how mutations at the p101 and ABD interfaces in p110γ can lead to enhanced Gβγ activation and how disruption of the GBD-C2 interface can lead to decreased Gβγ activation.
Activating mutations in the class I PI3K pathway are the most frequent alterations in human cancer (24), which are primarily driven by oncogenic mutations of p110α (50). p110γ is often overexpressed in cancer, specifically in pancreatic ductal adenocarcinoma (15, 27). Supporting this role of increased expression of p110γ in cancer is the knockdown of a microRNA targeting PIK3CG in patients, which promotes metastasis in triple-negative breast cancer (26). Tumor-associated mutations in p110γ are rare compared to p110α [1739 for PIK3CG compared to 17,359 for PIK3CA; from the COSMIC database as of April 2021 (43)]. However, multiple studies have found an association of somatic mutations in PIK3CG with cancer development and progression (51). Whether these mutants function within the tumor or the surrounding immune environment remains to be confirmed. Activating oncogenic mutants in the regulatory motif of the kinase domain of p110γ (R1021C) have been identified (52), with biallelic inactivating mutations involving the same site (R1021P, R982 frameshift) causing primary immunodeficiencies (53). We found rare oncogenic mutations clustered at ABD and p101 interfaces in PIK3CG. These mutants led to increased kinase activity upon Gβγ stimulation, which is explained by the altered interaction between p110γ and p101 as observed by HDX-MS. This may lead to a reorientation of the GBD, allowing for increased binding to membranes or lipidated Gβγ (Fig. 7B). Further analysis of the effect of these mutations on membrane recruitment, and their effects in cells and model organisms, will be required to understand their complete mechanism of regulation. Because of the rare occurrence of PIK3CG mutations in cancer, additional study in the context of cells, tissues, organoids, and animal cancer models will be required to confirm their potential role in cancer development or progression.
The association of p110γ in human disease has driven intense interest in the generation of PI3K-selective small-molecule inhibitors; however, severe side effects have limited their efficacy, particularly for pan-PI3K inhibitors (54). Multiple p110γ isoform-selective inhibitors are currently in clinical trials for cancer and are in development for chronic obstructive pulmonary disease and inflammatory disease. Inhibition of p110γ has also been found to improve antitumor properties of chimeric antigen receptor T cells (55). Regulatory subunits are differentially involved in the onset and progression of p110γ-associated diseases. Up-regulation of p110γ-p101 is involved in congestive heart failure (56), while p110γ-p84 plays a protective role by maintaining cardiac contractility (12). The p110γ-p101 complex could also be involved in TLR9-induced inflammation (57) because of its sensitivity to Rab8 activation downstream of TLRs (20). In pancreatic cancer models, targeting p110γ is protective in cancer development (27); however, its applicability is limited by hepatotoxicity. Therefore, targeting p110γ in these disease states could benefit from specifically inhibiting p110γ-p101 signaling. We have identified the structural basis for how the NB1-PIK3R5 nanobody can selectively inhibit Gβγ activation of the p110γ-p101 complex, which can be used to determine potential advantages of p110γ-p101–specific inhibition in p110γ-linked diseases, and may allow for design of novel therapeutic strategies.
Collectively, our detailed biochemical and structural analysis of the p110γ-p101 complex provides unique insight into the assembly and regulation of PI3Kγ complexes. This work provides a framework for the design of selective modulators outside of the adenosine 5′-triphosphate (ATP)–binding pocket, which will be useful to decipher PI3Kγ signaling roles and for the generation of potential therapeutics in inflammatory diseases and cancer.
MATERIALS AND METHODS
(Full resources for all experiments are found in table S1.)
Expression and purification of nanobody
Nanobody NB1-PIK3R5 with a C-terminal 6× His tag was expressed from a pMESy4 vector in the periplasm of WK6 Escherichia coli. A 1-liter culture was grown to an OD600 (optical density at 600 nm) of 0.7 in Terrific Broth containing 0.1% glucose and 2 mM MgCl2 in the presence of ampicillin (100 μg/ml) and was induced with 0.5 mM isopropyl-β-d-thiogalactoside. Cells were harvested the following day by centrifuging at 2500 relative centrifugal force (RCF) (Eppendorf Centrifuge 5810 R), and the pellet was snap-frozen in liquid nitrogen. The frozen pellet was resuspended in 15 ml of buffer containing 200 mM tris (pH 8.0), 0.5 mM EDTA, and 500 mM sucrose and was mixed for 1 hour at 4°C. To this mixture, 30 ml of resuspension buffer diluted four times in water was added and mixed for 45 min at 4°C to induce osmotic shock. The lysate was clarified by centrifuging at 14,000 rpm for 30 min (Beckman Coulter JA-20 rotor). Imidazole was added to the supernatant for a final concentration of 10 mM loaded onto a 5-ml HisTrap FF crude column (GE Healthcare) equilibrated in Ni–nitrilotriacetic acid (Ni-NTA) A buffer [20 mM tris (pH 8.0), 100 mM NaCl, 20 mM imidazole (pH 8.0), 5% (v/v) glycerol, and 2 mM β-mercaptoethanol (βME)]. The column was washed with high-salt Ni-NTA A buffer [20 mM tris (pH 8.0), 1 M NaCl, 20 mM imidazole (pH 8.0), 5% (v/v) glycerol, and 2 mM βME], Ni-NTA A buffer, and 6% Ni-NTA B buffer [20 mM tris (pH 8.0), 100 mM NaCl, 250 mM imidazole (pH 8.0), 5% (v/v) glycerol, and 2 mM βME], and the protein was eluted with 100% Ni-NTA B. The eluent was concentrated in a 10,000–molecular weight cutoff (MWCO) Amicon Concentrator (Millipore) to <1 ml and injected onto a Superdex 75 10/300 GL Increase size exclusion column (GE Healthcare) equilibrated in gel filtration buffer [20 mM tris (pH 8.5), 100 mM NaCl, 50 mM ammonium sulfate, and 0.5 mM tris(2-carboxyethyl) phosphine (TCEP)]. Following size exclusion, the protein was concentrated, frozen, and stored at −80°C.
Plasmid generation for PI3Kγ constructs
PI3Kγ constructs without the regulatory subunit (p110γ full length and p110γ 144-1102) were encoded in a pACEBac vector while the complexes were expressed from MutliBac (WT) or biGBac (mutants) vectors. For purification, a 10× histidine tag, a 2× strep tag, and a tobacco etch virus protease cleavage site were cloned to the N terminus of the regulatory subunits for the complex and to p110γ for constructs without regulatory subunits. All mutations were made in pLib vectors encoding p110γ using site-directed mutagenesis according to published commercial protocols (QuikChange Site-Directed Mutagenesis, Novagen). Oligonucleotides spanning the region of interest containing altered nucleotides were used in polymerase chain reactions (PCRs) (Q5 High-Fidelity 2X MasterMix, New England Biosciences no. M0492L), and the resulting reaction mixture was transformed into XL10 E. coli. Single colonies were grown overnight and purified using the QIAprep Spin Miniprep Kit (Qiagen no. 27104). Plasmid identity was confirmed by sequencing.
Virus generation and amplification
Virus generation and amplification for PI3Kγ constructs were carried out according to our standard protocol (58). The plasmid-encoding genes for insect cell expression were transformed into DH10MultiBac cells (MultiBac, Geneva Biotech) to generate baculovirus plasmid (bacmid) containing the genes of interest. Successful generation was identified by blue-white screening, and the bacmid was purified using a standard isopropanol-ethanol extraction method. Bacteria were grown overnight (16 hours) in 3 to 5 ml 2xYT (yeast tryptone media) (BioBasic no. SD7019). Cells were spun down, and the pellet was resuspended in 300 μl of 50 mM tris-HCl (pH 8.0), 10 mM EDTA, and RNase A (100 mg/ml). The pellet was lysed by the addition of 300 μl of 1% SDS (w/v) and 200 mM NaOH, and the reaction was neutralized by the addition of 400 μl of 3.0 M potassium acetate (pH 5.5). Following centrifugation at 21,130 RCF and 4°C (rotor no. 5424 R), the supernatant was mixed with 800 μl of isopropanol to precipitate bacmid DNA. Following centrifugation, the pelleted bacmid DNA was washed with 500 μl of 70% ethanol three times. The pellet was then air-dried for 1 min and resuspended in 50 μl of Buffer EB [10 mM tris-Cl (pH 8.5); all buffers from the QIAprep Spin Miniprep Kit; Qiagen no. 27104]. Purified bacmid was then transfected into Sf9 cells. Two milliliters of Sf9 cells at 0.6 × 10⁶ cells/ml were aliquoted into a six-well plate and allowed to attach to form a confluent layer. Transfection reactions were prepared by mixing 8 to 12 μg of bacmid DNA in 100 μl of 1× phosphate-buffered saline (PBS) and 12 μg of polyethyleneimine (Polyethyleneimine Max MW 40.000; Polysciences, no. 24765) in 100 μl of 1× PBS, and the reaction was allowed to proceed for 20 to 30 min before addition to an Sf9 monolayer–containing well. Transfections were allowed to proceed for 5 to 6 days before harvesting the virus-containing supernatant as a P1 viral stock.
Viral stocks were further amplified by adding P1 to Sf9 cells at ~2 × 10⁶ cells/ml (2/100 volume ratio). This amplification was allowed to proceed for 4 to 5 days and resulted in a P2 stage viral stock that was used in final protein expression. Harvesting of P2 viral stocks was carried out by centrifuging cell suspensions in 50-ml Falcon tubes at 2281 RCF (Beckman GS-15). To the supernatant-containing virus, 5 to 10% inactivated fetal bovine serum (VWR Canada no. 97068-085) was added, and the stock was stored at 4°C.
Expression and purification of PI3Kγ constructs
The PI3Kγ complexes (Human p110γ-porcine p101 WT/mutants and Human p110γ-mouse p84 WT) were expressed in Sf9 insect cells using the baculovirus expression system. Following 55 hours of expression, cells were harvested by centrifuging at 1680 RCF (Eppendorf Centrifuge 5810 R), and the pellets were snap-frozen in liquid nitrogen. Constructs without the regulatory subunit (Human p110γ full length and Human p110γ 144-1102) were expressed in insect cells for 55 hours from a pACEBac vector. Both the monomer and the complex were purified identically through a combination of nickel affinity, streptavidin affinity, and size exclusion chromatographic techniques.
Frozen insect cell pellets were resuspended in lysis buffer [20 mM tris (pH 8.0), 100 mM NaCl, 10 mM imidazole (pH 8.0), 5% glycerol (v/v), and 2 mM βME) and protease inhibitor (Protease Inhibitor Cocktail Set III, Sigma-Aldrich)] and sonicated for 2 min (15 s on, 15 s off, level 4.0; Misonix sonicator 3000). Triton-X was added to the lysate for a final concentration of 0.1% and clarified by spinning at 15,000 RCF for 45 min (Beckman Coulter JA-20 rotor). The supernatant was loaded onto a 5-ml HisTrap FF crude column (GE Healthcare) equilibrated in Ni-NTA A buffer [20 mM tris (pH 8.0), 100 mM NaCl, 20 mM imidazole (pH 8.0), 5% (v/v) glycerol, and 2 mM βME]. The column was washed with high-salt Ni-NTA A buffer [20 mM tris (pH 8.0), 1 M NaCl, 20 mM imidazole (pH 8.0), 5% (v/v) glycerol, and 2 mM βME], Ni-NTA A buffer, and 6% Ni-NTA B buffer [20 mM tris (pH 8.0), 100 mM NaCl, 250 mM imidazole (pH 8.0), 5% (v/v) glycerol, and 2 mM βME], and the protein was eluted with 100% Ni-NTA B. The eluent was loaded onto a 5-ml StrepTrap HP column (GE Healthcare) equilibrated in gel filtration buffer [20 mM tris (pH 8.5), 100 mM NaCl, 50 mM ammonium sulfate, and 0.5 mM TCEP]. The column was washed with the same buffer and loaded with tobacco etch virus protease. After cleavage on the column overnight, the protein was eluted in gel filtration buffer. For the complex with nanobody, the eluted protein was incubated with twofold molar excess of purified nanobody on ice for 15 min. The protein was concentrated in a 50,000-MWCO Amicon Concentrator (Millipore) to <1 ml and injected onto a Superdex 200 10/300 GL Increase size exclusion column (GE Healthcare) equilibrated in gel filtration buffer. After size exclusion, the protein was concentrated, aliquoted, frozen, and stored at −80°C.
Cryo-EM sample preparation and data collection
C-Flat 2/2-T 300 mesh grids were glow-discharged for 25 s at 15 mA using a Pelco easiGlow glow discharger. Three microliters of purified p110γ-p101 complex with or without bound nanobody was then applied to the grids at a concentration of 0.45 mg/ml. Grids were then prepared using a Vitrobot Mark IV (Thermo Fisher Scientific) by blotting for 1.5 s at 4°C and 100% humidity with a blot force of −5 followed by plunge freezing in liquid ethane. Grids were screened for particle and ice quality at the University of British Columbia High Resolution Macromolecular Cryo-Electron Microscopy (HRMEM) facility using a 200-kV Glacios transmission electron microscope (Thermo Fisher Scientific) equipped with a Falcon 3EC direct electron detector (DED). All datasets were then collected at the Pacific Northwest Cryo-EM Center (PNCC) using a Titan Krios equipped with a K3 DED and a BioQuantum K3 energy filter with a slit width of 20 eV (Gatan). For the apo p110γ-p101 complex, 6153 superresolution movies were collected using SerialEM with a total dose of 50e−/Å2 over 50 frames at a physical pixel size of 1.079 Å per pixel, using a defocus range of −0.8 to −2 μm. For the nanobody-bound p110γ-p101 complex, 6808 superresolution movies were collected using SerialEM with a total dose of 36.4e−/Å2 over 50 frames at a physical pixel size of 1.059 Å per pixel, using a defocus range of −1 to −2.4 μm.
Cryo-EM image analysis
All data processing was carried out using cryoSPARC v2.18+ unless otherwise specified. For the nanobody-bound p110γ-p101 complex dataset, patch motion correction using default settings was first applied to all movies to align the frames and Fourier-crop the outputs by a factor of 2. The contrast transfer function (CTF) of the resulting micrographs was estimated using the patch CTF estimation job with default settings. The 2D class averages from a previous dataset were low-pass–filtered to 15 Å and used as templates to autopick 3,762,631 particles, which were then extracted with a box size of 300 pixels. The particles were subjected to 2D classification with the 2D class recenter threshold set to 0.05 and a circular mask of 200 Å. The 2D class averages that had ice contamination or showed no features were discarded. The remaining 952,705 particles were next used for ab initio reconstruction and heterogeneous refinement using two classes. A total of 692,109 particles from the better 3D reconstruction were curated, and any particles from micrographs with a CTF estimation less than 3 Å or total frame motion greater than 30 Å were discarded. Per-particle local-motion correction was then carried out on the remaining 662,855 particles. The particles were then used for ab initio reconstruction and heterogeneous refinement using four classes. A total of 320,179 particles from the most complete class were used to carry out homogeneous refinement using the 3D reconstruction for that class as a starting model, yielding a reconstruction with an overall resolution of 2.99 Å based on the Fourier shell correlation (FSC) 0.143 criterion. The particles were further refined using local CTF refinement before being used for nonuniform refinement with simultaneous global CTF refinement, yielding a map with an overall resolution of 2.90 Å. Last, the map was subjected to a final nonuniform refinement using a mask enveloping the entire volume with the rotation fulcrum centered at the low-resolution nanobody-p101 interaction interface, producing the final map used for model building at a 2.89-Å overall resolution.
For the apo p110γ-p101 complex dataset, full-frame motion correction using default settings was first applied to all movies to align the frames. The CTF of the resulting micrographs was estimated using CTFFIND4 with default settings. The 2D class averages from a previous dataset were low-pass–filtered to 15 Å and used as a template to autopick 4,792,176 particles, which were then down-sampled by two (resulting pixel size of 1.079 Å per pixel) and extracted with a box size of 320 pixels. The particles were subjected to multiple rounds of 2D classification with the 2D class recenter threshold set to 0.05 and a circular mask of 200 Å. The 2D class averages that had ice contamination or did not align to high resolution were then discarded. The remaining 1,285,510 particles were next subjected to patch CTF estimation and per-particle motion correction before being used for two more rounds of 2D classification. A total of 731,169 particles classified to “good” classes were then used for ab initio reconstruction and heterogeneous refinement using two classes twice iteratively. A total of 196,390 particles from the better 3D reconstruction were used to carry out homogeneous refinement using the 3D reconstruction for that class as a starting model, yielding a reconstruction with an overall resolution of 3.49 Å based on the FSC 0.143 criterion. The map was further refined for nonuniform refinement, yielding a map with an overall resolution of 3.36 Å.
Building the structural model of p110γ-p101
The crystal structure of the ΔABD p110γ [Protein Data Bank (PDB) accession no. 1E8Y] (Walker:2000bb) was fit into the map using Chimera. Model building was carried out using iterative rounds of automated model building in Phenix, manual model building in Crystallographic Object-Oriented Toolkit (COOT) (59), and refinement in Phenix.real_space_refine using realspace, rigid body, and atomic displacement parameter refinement with tight secondary structure restraints (60). This allowed for building the ABD, activation loop of the kinase domain, the RBD-C2 and C2-helical linkers in p110γ, all structured regions of the PBD, and part of the GBD of p101 with high confidence. The regions of the GBD that were manually built included the N-terminal strand (residues 667 to 676) and the β hairpin (residues 725 to 745).
Because of the GBD being highly dynamic, further automated or manual model building was limited. Starting with this initial model of the GBD, we used a combination of Rosetta de novo modeling (35) and folding with trRosetta deep-learned constraints (36) to build the remaining GBD (667-837). Rosetta de novo model building was then run on the entire domain starting from this model. This placed an additional strand (residues 677 to 686). Unfortunately, additional rounds of de novo model building in Rosetta failed to identify additional regions of the sequence.
Next, we used trRosetta to predict contacts for this domain (36). The sequence input for trRosetta included the fasta sequence from residues 671 to 838, and this resulted in ~2000 aligned sequences, 206 of which (after filtering by 90% of maximum pairwise sequence identity and 50% of minimum coverage) were used to derive constraints. Unfortunately, structure predictions using constraints from trRosetta alone yielded structures that were inconsistent with the observed density data. Therefore, we instead turned to modeling simultaneously using density and constraints. The trRosetta constraints were input along with the density map as inputs to Rosetta comparative modeling, starting with the partially complete model from Rosetta de novo. A total of 10,000 modeling trajectories were sampled, yielding good convergence on a model with good agreement to the density (fig. S2). Compared to prior trRosetta modeling procedures (36), the constraint weight was reduced to balance the relative contributions of density and the constraints.
To further improve model-map agreement (and overall model geometry), the lowest energy model was used as the input for subsequent rounds of modeling. A total of three rounds of modeling were carried out in this way, each model producing 100 output models, of which the best 10 (by Rosetta + density energies) were carried over to the next round. The final model shows very good agreement with the predicted constraints (fig. S2). This final model of the GBD was combined with the rest of the p110γ-p101 complex, and final realspace refinement was carried out in Phenix using tight secondary structure restraints to give the final model, with full refinement and validation statistics shown in table S2.
Expression and purification of lipidated Gβγ for kinase activity assays
Full-length, lipidated human Gβγ (Gβ1γ2) was expressed in Sf9 insect cells and purified as described previously (61). After 65 hours of expression, cells were harvested, and the pellets were frozen as described above. Pellets were resuspended in lysis buffer [20 mM Hepes (pH 7.7), 100 mM NaCl, 10 mM βME, and protease inhibitor (Protease Inhibitor Cocktail Set III, Sigma-Aldrich)] and sonicated for 2 min (15 s on, 15 s off, level 4.0; Misonix sonicator 3000). The lysate was spun at 500 RCF (Eppendorf Centrifuge 5810 R) to remove intact cells, and the supernatant was centrifuged again at 25,000 RCF for 1 hour (Beckman Coulter JA-20 rotor). The pellet was resuspended in lysis buffer, and sodium cholate was added for a final concentration of 1% and stirred at 4°C for 1 hour. The membrane extract was clarified by spinning at 10,000 RCF for 30 min (Beckman Coulter JA-20 rotor). The supernatant was diluted three times with Ni-NTA A buffer [20 mM Hepes (pH 7.7), 100 mM NaCl, 10 mM imidazole, 0.1% C12E10, and 10 mM βME] and loaded onto a 5-ml HisTrap FF crude column (GE Healthcare) equilibrated in the same buffer. The column was washed with Ni-NTA A, 6% Ni-NTA B buffer [20 mM Hepes (pH 7.7), 25 mM NaCl, 250 mM imidazole (pH 8.0), 0.1% C12E10, and 10 mM βME], and the protein was eluted with 100% Ni-NTA B. The eluent was loaded onto HiTrap Q HP anion exchange column equilibrated in Hep A buffer [20 mM tris (pH 8.0), 8 mM CHAPS, and 2 mM dithiothreitol (DTT)]. A gradient was started with Hep B buffer [20 mM tris (pH 8.0), 500 mM NaCl, 8 mM CHAPS, and 2 mM DTT], and the protein was eluted in ~50% Hep B buffer. The eluent was concentrated in a 30,000-MWCO Amicon Concentrator (Millipore) to <1 ml and injected onto a Superdex 75 10/300 GL size exclusion column (GE Healthcare) equilibrated in gel filtration buffer [20 mM Hepes (pH 7.7), 100 mM NaCl, 10 mM CHAPS, and 2 mM TCEP]. Fractions containing protein were pooled, concentrated, aliquoted, frozen, and stored at −80°C.
Lipid vesicle preparation for kinase activity assays
Lipid vesicles containing 5% brain PIP2, 20% brain phosphatidylserine, 50% egg yolk phosphatidylethanolamine, 10% egg yolk phosphatidylcholine (PC), 10% cholesterol, and 5% egg yolk sphingomyelin were prepared by mixing the lipid solutions in organic solvent. The solvent was evaporated in a stream of argon, following which the lipid film was desiccated in a vacuum for 45 min. The lipids were resuspended in lipid buffer [20 mM Hepes (pH 7.0), 100 mM NaCl, and 10% glycerol], and the solution was sonicated for 15 min. The vesicles were subjected to five freeze-thaw cycles and extruded 11 times through a 100-nm filter (T&T Scientific, TT-002-0010). The extruded vesicles were sonicated again for 5 min, aliquoted, and stored at −80°C. Final vesicle concentration was 5 mg/ml.
Lipid kinase activity assays
All lipid kinase activity assays used the Transcreener adenosine 5′-diphosphate 2 (ADP2) fluorescence intensity (FI) assay (BellBrook Labs), which measures ADP production. For assays comparing the activities of p110γ, p110γ-p101, and p110γ-p84, plasma membrane mimic vesicles at a final concentration of 1 mg/ml, ATP at a final concentration of 100 μM ATP, and Gβγ at 1.5 μM final concentration were used. Final concentration of kinase was 3000 nM for all basal conditions. For conditions with Gβγ, p110γ: 3000 nM, p110γ-p84: 1000 nM, and p110γ-p101: 30 nM. Two microliters of kinase solution at 2× final concentration was mixed with 2 μl of substrate solution containing ATP, vesicles, and Gβγ or Gβγ gel filtration buffer, and the reaction was allowed to proceed for 60 min at 20°C. For assays comparing mutants, kinase was mixed with vesicles at 1 mg/ml, ATP at 100 μM, and Gβγ at 75 nM or 1.5 μM final concentrations, and the reaction was allowed to proceed for 60 min at 37°C. The reactions were stopped with 4 μl of 2× stop and detect solution containing Stop and Detect buffer, 8 nM ADP Alexa Fluor 594 tracer and ADP2 Antibody IRDye QC-1 (93.7 μg/ml) and incubated for 50 min. The FI was measured using a SpectraMax M5 plate reader at excitation 590 nm and emission 620 nm. These data were normalized against the measurements obtained for 100 μM ATP and 100 μM ADP. The % ATP turnover was interpolated from a standard curve (0.1 to 100 μM ADP). This was then used to calculate the specific activity of the enzyme.
For assays measuring nanobody inhibition at saturating Gβγ concentrations, kinase at 4× concentration was mixed with nanobody at 4× concentration to obtain 2× enzyme-nanobody solution (6 μM final nanobody). Final concentration of kinase was 3000 nM for all basal conditions. For conditions with Gβγ, p110γ-p84: 1500 nM and p110γ-p101: 50 nM. Two microliters of this solution was mixed with 2 μl of 2× substrate solution containing ATP (100 μM final) and vesicles (1 mg/ml final) with or without Gβγ (1.5 μM final) to start the reaction and allowed to proceed for 60 min at 20°C. Following this, the reaction was stopped, the intensity was measured, the data were normalized, and specific activity was calculated as described above. For the nanobody IC50 curve, kinase at 4× concentration was mixed with nanobody at 4× concentration to obtain 2× enzyme-nanobody solution (200 nM final kinase; 41 to 10,000 nM final nanobody). Two microliters of this solution was mixed with 2 μl of 2× substrate solution containing ATP (100 μM final), vesicles (2 mg/ml final), and Gβγ (600 nM final) to start the reaction and allowed to proceed for 60 min at 20°C. Following this, the reaction was stopped, the intensity was measured, and the data were normalized as described above. The normalized values for conditions with nanobody were then further normalized against the condition with maximal activity (no nanobody).
Biolayer interferometry
Biolayer interferometry was performed using Octet K2 (Fortebio Inc.). His-tagged nanobody was immobilized on an Anti-Penta-His biosensor for 600 s, and the sensor was dipped into solutions of p110γ-p101 at 1.5, 6, and 25 nM final concentrations diluted in kinetics buffer (KB) containing 20 mM tris (pH 8.5), 100 mM NaCl, 50 mM ammonium sulfate, 0.1% bovine serum albumin, and 0.02% Tween 20. The association step was allowed to proceed for 600 s followed by a dissociation step in KB without protein for 600 s. The baseline was obtained by dipping sensor without nanobody into a solution containing 25 nM p110γ-p101 in a similar fashion. The average Kd (dissociation constant) was calculated from the three binding curves on the basis of their global fit to a 1:1 binding model.
Hydrogen-deuterium exchange mass spectrometry
HDX-MS sample preparation
For HDX reactions comparing p110γ alone and p110γ in complex with p101 or p84, exchange was carried out in a 50 μl reaction containing 20 pmol of protein, either p110γ, p110γ-p84, or p110γ-p101. To initiate HDX, 1.5 μl of either protein was incubated with 48.5 μl of D2O buffer solution [20 mM Hepes (pH 7.5), 100 mM NaCl, and 94.3% D2O] for five time points (3 s on ice and 3, 30, 300, and 3000 s at room temperature) to give a final concentration of 91.5% D2O.
HDX reactions comparing full-length p110γ and ABD-truncated p110γ were conducted in 50-μl reaction volumes with a final p110γ amount of 15 pmol. Exchange was carried out for four time points (3, 30, 300, and 3000 s at room temperature). To initiate HDX, 1.2 μl of either protein was incubated with 48.8 μl of D2O buffer solution [20 mM Hepes (pH 7.5), 100 mM NaCl, and 94.3% D2O] to give a final concentration of 92% D2O.
HDX reactions comparing p110γ-p101 with and without nanobody were conducted in 50-μl reaction volumes with a final p110γ amount of 16 pmol and a final nanobody amount of 7 pmol. Exchange was carried out for two time points (3 and 300 s at room temperature). To initiate HDX, 1 μl of p110γ-p101 and 1 μl of nanobody were incubated with 48 μl of D2O buffer solution [20 mM Hepes (pH 7.5), 100 mM NaCl, and 94.3% D2O] to give a final concentration of 90.5% D2O.
HDX reactions comparing WT p110γ-p101, R472C p110γ-p101, and E347K p110γ-p101 were conducted in 50-μl reaction volumes with a final protein amount of 12.5 pmol. Exchange was carried out for five time points (3 s on ice and 3, 30, 300, and 3000 s at room temperature). To initiate HDX, 2 μl of protein was incubated with 48 μl of D2O buffer solution [20 mM Hepes (pH 7.5), 100 mM NaCl, and 94.3% D2O] to give a final concentration of 90.5% D2O. All exchange reactions were terminated by the addition of ice-cold quench buffer to give a final concentration 0.6 M guanidine-HCl and 0.9% formic acid, and samples were frozen in liquid nitrogen and stored at −80°C. All experiments were carried out in independent triplicate.
Protein digestion and tandem MS data collection
Protein samples were rapidly thawed and injected onto an integrated fluidics system containing an HDx-3 PAL liquid handling robot and climate-controlled chromatography system (LEAP Technologies), a Dionex Ultimate 3000 ultrahigh-performance liquid chromatography system, and an Impact high-definition quadrupole orthogonal acceleration–time-of-flight mass spectrometer (Bruker). The full details of the fluidics system are described in (62). The protein was run over either one (at 10°C) or two (at 10° and 2°C) immobilized pepsin columns (Applied Biosystems Poroszyme immobilized pepsin cartridge, 2.1 mm by 30 mm; Thermo Fisher Scientific, 2-3131-00; Trajan ProDx protease column, PDX.PP01-F32, 2.1 mm by 30 mm) at 200 μl/min for 3 min. The resulting peptides were collected and desalted on a C18 trap column [Acquity UPLC BEH C18 1.7-mm column (2.1 mm by 5 mm); Waters 186003975]. The trap was subsequently eluted in line with a C18 reverse-phase separation column (Acquity 1.7-mm particle, 100 × 1 mm2 C18 UPLC column, Waters 186002352), using a gradient of 5 to 36% B (buffer A, 0.1% formic acid; buffer B, 100% acetonitrile) over 16 min. MS experiments acquired over a mass range from 150 to 2200 mass/charge ratio (m/z) using an electrospray ionization source operated at a temperature of 200°C and a spray voltage of 4.5 kV.
Peptide identification
Peptides were identified from the nondeuterated samples of p110γ alone, p110γ-p84, or p110γ-p101 using data-dependent acquisition following tandem MS (MS/MS) experiments (0.5-s precursor scan from 150 to 2000 m/z; 12 0.25-s fragment scans from 150 to 2000 m/z). MS/MS datasets were analyzed using PEAKS7 (PEAKS), and peptide identification was carried out by using a false discovery–based approach, with a threshold set to 1% using a database of purified proteins and known contaminants (63). The search parameters were set with a precursor tolerance of 20 parts per million, fragment mass error 0.02 Da, and charge states from 1 to 8, with a selection criterion of peptides that had a −10logP score of 21.7.
Mass analysis of peptide centroids and measurement of deuterium incorporation
HD-Examiner Software (Sierra Analytics) was used to automatically calculate the level of deuterium incorporation into each peptide. All peptides were manually inspected for correct charge state, correct retention time, appropriate selection of isotopic distribution, etc. Deuteration levels were calculated using the centroid of the experimental isotope clusters. The results for these proteins are presented as the raw percent deuterium incorporation, as shown in the Supplementary Materials, with the only correction being applied correcting for the deuterium oxide percentage of the buffer used in the exchange (91.7% for comparing p110γ to p110γ-p101 and p110γ-p84, 86.8% for comparing p110γ-p101 with NB1-PIK3R5, 92% for the ABD deletion, and 90.5% for the oncogenic mutants). No corrections for back exchange that occurs during the quench and digest/separation were applied. Attempts to generate a fully deuterated class I PI3K sample were unsuccessful, which is common for large macromolecular complexes. Therefore, all deuterium exchange values are relative.
Differences in exchange in a peptide were considered significant if they met all three of the following criteria: ≥5% change in exchange, ≥0.4-Da difference in exchange, and a P value of <0.01 using a two-tailed Student’s t test. The raw HDX data are shown in two different formats.
The raw peptide deuterium incorporation graphs for a selection of peptides with significant differences are shown, with the raw data for all analyzed peptides in the source data. To allow for visualization of differences across all peptides, we used number of deuteron difference (#D) plots. These plots show the total difference in deuterium incorporation over the entire HDX time course, with each point indicating a single peptide. These graphs are calculated by summing the differences at every time point for each peptide and propagating the error (for example, fig. S6, A and B). For a selection of peptides, we are showing the %D incorporation over a time course, which allows for comparison of multiple conditions at the same time for a given region (fig. S6C). Samples were only compared within a single experiment and were never compared to experiments completed at a different time with a different final D2O level. The data analysis statistics for all HDX-MS experiments are in table S3 according to the guidelines in (64). The MS proteomics data have been deposited to the ProteomeXchange Consortium via the PRIDE partner repository (65) with the dataset identifier PXD025209.
TIRF microscopy
Purification of recombinant farnesyl Gβ1Gγ2 and SNAP-Gβ1Gγ2 for TIRF microscopy
Genes encoding bovine Gβ1 and Gγ2 were cloned into baculovirus expression vectors Gibson assembly. This was achieved using yellow fluorescent protein (YFP)–Gβ1 (Addgene plasmid no. 36397) and YFP-Gγ2 (Addgene plasmid no. 36102) as templates for PCR. These Gβ1- and Gγ2-containing plasmids were provided to Addgene by N. Gautam (66). We recombinantly expressed either Gβ1/his6-tobacco etch virus protease (TEV) cleavage site-Gγ2 or SNAP-Gβ1/his6-TEV-Gγ2 in High Five insect cells using a dual expression vector system with tandem polyhedron promoters. General procedures for making bacmid and baculovirus were performed as previously described (67). For Gβ1/his6-TEV-Gγ2 or SNAP-Gβ1/his6-TEV-Gγ2 expression, 2 to 4 liters of High Five cells (2 × 10⁶ cells/ml) were infected with 2% v/v of baculovirus. Cultures were then grown in 3-liter shaker flasks (120 rpm) for 48 hours at 27°C before harvesting. Insect cells were harvested by centrifugation and stored as 10g pellets in −80°C until initiating the purification.
To isolate farnesylated Gβ1/his6-TEV-Gγ2 or SNAP-Gβ1/his6-TEV-Gγ2 complexes from insect cells, we used a protocol based on (61). Cells were lysed by dounce homogenization into the buffer containing 50 mM Hepes-NaOH (pH 8), 100 mM NaCl, 3 mM MgCl2, 0.1 mM EDTA, 10 μM guanosine diphosphate (GDP), 10 mM βME, protease inhibitor tablets (Sigma-Aldrich), 1 mM phenylmethylsulfonyl fluoride, and deoxyribonuclease. Cell lysate was subjected to low-speed centrifugation (10 min at 800 RCF) to remove nuclei and large cell debris. Next, soluble cell membranes isolated from partially clarified lysate were centrifuged using a Beckman Ti45 rotor (100,000 RCF for 30 min). Pellets containing the membrane fraction of the cell lysate were solubilized in membrane extraction buffer: 50 mM Hepes-NaOH (pH 8), 50 mM NaCl, 3 mM MgCl2, 1% sodium deoxycholate (w/v) (Sigma-Aldrich, D6750), 10 μM GDP (Sigma-Aldrich, G7127), 10 mM βME, and protease inhibitor tablet (Sigma-Aldrich) to solubilize farnesylated Gβ1/his6-TEV-Gγ2 or SNAP-Gβ1/his6-TEV-Gγ2. Membranes were resuspended in enough membrane extraction buffer to reach a protein concentration of 5 mg/ml. We used a dounce homogenizer to break apart the membrane followed by stirring in a beaker at 4°C for 1 hour. Following membrane extraction, insoluble material was removed by 4°C ultracentrifugation at 100,000 RCF for 45 min. Clarified supernatant containing detergent-solubilized Gβ1/his6-TEV-Gγ2 or SNAP-Gβ1/his6-TEV-Gγ2 was diluted fivefold in post–membrane extraction buffer: 20 mM Hepes-NaOH (pH 7.7), 100 mM NaCl, 0.1% C12E10 [polyoxyethylene (10) lauryl ether; Sigma-Aldrich, P9769], 25 mM imidazole, and 2 mM βME. For affinity purification of Gβ1/his6-TEV-Gγ2 or SNAP-Gβ1/his6-TEV-Gγ2, 7 to 10 ml of Qiagen Ni-NTA resin (50% slurry) was added to diluted post–membrane extraction sample and incubated on a stir plate in a beaker at 4°C for 2 hours. Using a gravity flow column, Ni-NTA resin was washed with 20-column volumes of buffer containing 20 mM Hepes-NaOH (pH 7.7), 100 mM NaCl, 0.1% C12E10, 20 mM imidazole, and 2 mM βME. Next, the contaminating Gα subunit of the heterotrimeric G protein complex was eluted by washing with warm buffer (30°C) containing 20 mM Hepes-NaOH (pH 7.7), 100 mM NaCl, 0.1% C12E10, 20 mM imidazole, 2 mM βME, 50 mM MgCl2, 10 μM GDP, 30 μM AlCl3, and 10 mM NaF. When dissolving AlCl3 into water, we worked in a fume hood to prevent inhalation of gaseous HCl. Last, Gβ1/his6-TEV-Gγ2 or SNAP-Gβ1/his6-TEV-Gγ2 were eluted from Ni-NTA resin with buffer containing 20 mM tris-HCl (pH 8.0), 25 mM NaCl, 0.1% C12E10, 200 mM imidazole, and 2 mM βME. Eluate was combined with TEV protease and incubated overnight in the NTA elution buffer at 4°C. During day 2 of the purification, Gβ1Gγ2 or SNAP-Gβ1Gγ2 were desalted into buffer containing 20 mM tris-HCl (pH 8.0), 25 mM NaCl, 8 mM CHAPS, and 2 mM TCEP and loaded onto a MonoQ column equilibrated with the same buffer. Gβ1Gγ2 or SNAP-Gβ1Gγ2 eluted from the MonoQ column in the presence of 175 to 200 mM NaCl. A single peak was combined and concentrated using a Millipore Amicon Ultra-4 (10-kDa MWCO) centrifuge filter. Gβ1Gγ2 or SNAP-Gβ1Gγ2 were respectively loaded on either Superdex 75 or Superdex 200 gel filtration columns equilibrated 20 mM tris (pH 8.0), 100 mM NaCl, 8 mM CHAPS, and 2 mM TCEP. We pooled peak fractions and concentrated the protein using a Millipore Amicon Ultra-4 (10-kDa MWCO) centrifuge tube. Concentrated Gβ1Gγ2 or SNAP-Gβ1Gγ2 was aliquoted and flash-frozen with liquid nitrogen. Using single-molecule TIRF microscopy, we determined that the quality of the protein was similarly high when the protein was frozen in the absence or presence of 10% glycerol.
Fluorescent labeling of ybbr-p110γ and p110γ/ybbr-p101
The DY647–coenzyme A (CoA) derivative was generated in-house by combining 15 mM DY647 maleimide (Dyomics, catalog no. 647P1-03) in dimethyl sulfoxide with 10 mM CoA (Sigma-Aldrich, no. C3019, MW = 785.33 g/mol) dissolved in 1× PBS. This mixture was incubated overnight at 23°C. Unreacted DY647 maleimide was quenched by the addition of 5 mM DTT. DY647-CoA can be stored at −20°C for at least 1 year. We labeled recombinant p110γ/p101 containing an N-terminal ybbR13 motif (DSLEFIASKLA) using Sfp transferase and DY647-CoA (68). Chemical labeling was achieved by combining 5 μM p110γ/ybbr-p101 (or ybbr-p110γ), 4 μM Sfp-his6, and 10 μM DY647-CoA, in 2 ml of buffer containing 20 mM tris (pH 8), 150 mM NaCl, 10 mM MgCl2, 10% glycerol, 1 mM TCEP, and 0.05% CHAPS. Following a 4-hour labeling reaction on ice, excess DY647-CoA was removed using a gravity flow PD-10 column. p110γ/Dy647-ybbr-p101 (or Dy647-ybbr-p110γ) was concentrated in a 50-kDa MWCO Amicon centrifuge tube and loaded on a Superdex 200 gel filtration column equilibrated in 20 mM tris (pH 8), 150 mM NaCl, 10% glycerol, 1 mM TCEP, and 0.05% CHAPS. Peak fractions were pooled and concentrated to 5 to 10 μM before flash-freezing with liquid nitrogen and stored in −80°C freezer.
Preparation of SLBs
The following lipids were used to generated small unilamellar vesicles (SUVs) and subsequently SLBs: 1,2-dioleoyl-sn-glycero-3-phosphocholine (DOPC, 18:1; Avanti no. 850375C) and 1,2-dioleoyl-sn-glycero-3-phospho-l-serine (DOPS, 18:1; Avanti, no. 840035C). To make SUVs, 2 μmol of total lipids were combined in a 35-ml round-bottom glass flask containing 2 ml of chloroform. Lipids were dried to a thin film using rotary evaporation with the round-bottom glass flask submerged in a 42°C water bath. After evaporating all the chloroform, the round-bottom flask was flushed with nitrogen gas or placed in a vacuum desiccator for at least 30 min. The lipid film was resuspended in 2 ml of PBS (pH 7.2) to make a final concentration of 1 mM total lipids. All lipid mixtures expressed as percentages (e.g., 95% DOPC, 5% DOPS) are equivalent to molar fractions. To generate 30- to 50-nm SUVs, 1 mM total lipid mixtures were extruded through a 0.03-m pore size 19-mm polycarbonate membrane (Avanti, no. 610002) with filter supports (Avanti, no. 610014) on both sides of the polycarbonate membrane.
To create SLBs, cover glass (25 × 75 mm; IBIDI, catalog no. 10812) was initially cleaned with 2% Hellmanex III (Thermo Fisher Scientific, catalog no. 14-385-864) that was heated to 60° to 70°C in a glass Coplin jar and incubated for at least 30 min. After rinsing the Hellmanex-cleaned glass with MilliQ water, the cover glass was etched with Piranha solution (1:3, hydrogen peroxide:sulfuric acid) for 10 to 15 min. The etched cover glass that was rinsed and stored in MilliQ water was removed from the Coplin jar and rapidly dried with nitrogen gas before adhering to a six-well sticky-side chamber (IBIDI, catalog no. 80608). To create an SLB, a total lipid concentration of 0.25 mM SUVs in 1× PBS (pH 7.2) was flowed into the IBIDI chamber. After 30 min of incubation, supported membranes were washed with 5 ml of PBS (pH 7.2) to remove nonabsorbed SUVs. Membrane defects were then blocked for 5 to 10 min with beta casein (1 mg/ml; Thermo Fisher Scientific, catalog no. 37528) diluted in 1× PBS (pH 7.4). Before blocking the membranes, beta casein was clarified by centrifugation for 30 min at 21,370g and then passed through a 0.22-μm syringe filtration. After blocking SLBs with beta casein, membranes were washed again with 2 ml of PBS and then stored at room temperature for up to 2 hours before mounting on the microscope. Before single-molecule imaging experiments, supported membranes were washed into TIRF imaging buffer.
Single-molecule TIRF microscopy
All supported-membrane TIRF microscopy experiments were performed using the following reaction buffer: 20 mM Hepes (pH 7.0), 150 mM NaCl, 1 mM ATP, 5 mM MgCl2, 0.5 mM EGTA, 20 mM glucose, beta casein (200 μg/ml; Thermo Fisher Scientific, catalog no. 37528), 20 mM βME, glucose oxidase (320 μg/ml; Serva, no. 22780.01, Aspergillus niger), catalase (50 μg/ml; Sigma-Aldrich, no. C40-100MG, bovine liver), and 2 mM Trolox (67). Perishable reagents (i.e., glucose oxidase, catalase, and Trolox) were added 5 to 10 min before image acquisition.
Single-molecule imaging experiments were performed using an inverted Nikon Ti2 microscope using a 100× oil immersion Nikon TIRF objective (1.49 numerical aperture). The x-axis and y-axis positions were controlled using a Nikon motorized stage, joystick, and NIS element software. Fluorescently labeled proteins were excited with either a 488- or 637-nm diode laser (OBIS laser diode, Coherent Inc., Santa Clara, CA) controlled with a Vortran laser launch and acousto-optic tuneable filter control. The power output measured through the objective for single-particle imaging was 1 to 3 mW. Excitation and emission light was transmitted through a multi–band-pass quad filter cube (C-TIRF ULTRA HI S/N QUAD 405/488/561/638; Semrock) containing a dichroic mirror. Fluorescence emission was detected on an iXion Life 897 electron-multiplying charged coupled device (EMCCD) camera (Andor Technology Ltd., UK) after passing through a Nikon Ti2 emission filter wheel containing the following 25-mm emission filters: ET525/50 M, ET600/50 M, and ET700/75 M (Semrock). All experiments were performed at room temperature (21° to 23°C). Microscope hardware was controlled with Nikon NIS elements.
Single-particle tracking
Single fluorescent p110γ/Dy647-ybbr-p101 and Dy647-ybbr-p110γ molecules bound to SLBs were detected using the ImageJ/Fiji TrackMate plugin (69). Data in the form of .nd2 files were loaded in ImageJ, and the LoG detector was used to identify particles on the basis of brightness and their signal-to-noise ratio. After locating every fluorescent particle, we used the Lap tracker to generate particle trajectories that followed molecular displacement over time. Particle trajectories were then filtered on the basis of track start (remove particles at start of movie), track end (remove particles at end of movie), duration (particles track ≥ 2 frames), track displacement, and X-Y location (removed particles near the edge of the movie). The output files from TrackMate were then analyzed using custom MATLAB scripts to calculate the single-molecule dwell time of membrane-bound p110γ/Dy647-ybbr-p101 and Dy647-ybbr-p110γ. To calculate the dwell times of membrane-bound p110γ/Dy647-ybbr-p101 and Dy647-ybbr-p110γ, we generated cumulative distribution frequency (CDF) plots with the bin size set to image acquisition frame interval (i.e., 17 to 52 ms). The log10(1 − CDF) was plotted as a function dwell time and fit to a single or double exponential curve. For double exponential fit, α represents the percentage of the fast dissociating molecules characterized by τ1. A typical dataset contained dwell times measured for n = 2000 to 4000 particle trajectories from n = 3 movies.
Single exponential model
Two exponential model
Acknowledgments:
We appreciate help from T. Humphreys and R. M. Haynes with data collection at PNCC. Funding: J.E.B. is supported by the Canadian Institute of Health Research (CIHR, 168998), the Michael Smith Foundation for Health Research (MSFHR, scholar 17686), and the Cancer Research Society (CRS-24368). C.K.Y. is supported by CIHR (FDN-143228) and the Natural Sciences and Engineering Research Council of Canada (RGPIN-2018-03951). S.D.H. is supported by an NSF CAREER Award (MCB-2048060). F.D. is supported by NIH-GM123089. J.S. and E.P. acknowledge the support and the use of resources of Instruct-ERIC, part of the European Strategy Forum on Research Infrastructures (ESFRI), and the Research Foundation–Flanders (FWO). This research project was supported in part by the UBC HRMEM facility. A portion of this research was supported by NIH grant U24GM129547 and performed at the PNCC at OHSU and accessed through EMSL (grid.436923.9), a DOE Office of Science User Facility sponsored by the Office of Biological and Environmental Research. Author contributions: All protein expression and purification were carried out by M.K.R. HDX-MS experiments were performed by K.D.F., J.T.B.S., M.K.R., and J.E.B. Data collection and analysis for cryo-EM were carried out by U.D. and C.K.Y. Model building of p110 and p101 was carried out by M.K.R. and J.E.B. Rosetta modeling of the GBD of p101 was carried out by C.A., M.B., and F.D. TIRF microscopy experiments were carried out by S.D.H. Nanobody identification was carried out by E.P. and J.S. Experimental design was by M.K.R., U.D., O.V., C.K.Y., and J.E.B. The first draft of the manuscript was written by M.K.R., U.D., C.K.Y., and J.E.B. with input from all authors during edits/revision. Competing interests: The authors declare that they have no competing interests. Data and materials availability: All data needed to evaluate the conclusions in the paper are present in the paper and/or the Supplementary Materials. The EM data have been deposited in the EM data bank with accession numbers (EMDB: 23808 [p110γ-p101-NB1-PIK3R5] and 23812 [p110γ-p101]), and associated structural models have been deposited to the PDB with accession number (PDB: 7MEZ). The MS proteomics data have been deposited to the ProteomeXchange Consortium via the PRIDE (65) partner repository with the dataset identifier PXD025209. All raw data in all figures are available in the source data file.
SUPPLEMENTARY MATERIALS
Supplementary material for this article is available at http://advances.sciencemag.org/cgi/content/full/7/35/eabj4282/DC1
REFERENCES AND NOTES
- 1.Fruman D. A., Chiu H., Hopkins B. D., Bagrodia S., Cantley L. C., Abraham R. T., The PI3K pathway in human disease. Cell 170, 605–635 (2017). [DOI] [PMC free article] [PubMed] [Google Scholar]
- 2.Burke J. E., Williams R. L., Synergy in activating class I PI3Ks. Trends Biochem. Sci. 40, 88–100 (2015). [DOI] [PubMed] [Google Scholar]
- 3.Suire S., Coadwell J., Ferguson G. J., Davidson K., Hawkins P., Stephens L., p84, a new Gβγ-activated regulatory subunit of the type IB phosphoinositide 3-kinase p110γ. Curr. Biol. 15, 566–570 (2005). [DOI] [PubMed] [Google Scholar]
- 4.Stephens L. R., Eguinoa A., Erdjument-Bromage H., Lui M., Cooke F., Coadwell J., Smrcka A. S., Thelen M., Cadwallader K., Tempst P., Hawkins P. T., The Gβγ sensitivity of a PI3K is dependent upon a tightly associated adaptor, p101. Cell 89, 105–114 (1997). [DOI] [PubMed] [Google Scholar]
- 5.Okkenhaug K., Signaling by the phosphoinositide 3-kinase family in immune cells. Annu. Rev. Immunol. 31, 675–704 (2013). [DOI] [PMC free article] [PubMed] [Google Scholar]
- 6.Li Z., Jiang H., Xie W., Zhang Z., Smrcka A. V., Wu D., Roles of PLC-beta2 and -beta3 and PI3Kγ in chemoattractant-mediated signal transduction. Science 287, 1046–1049 (2000). [DOI] [PubMed] [Google Scholar]
- 7.Laffargue M., Calvez R., Finan P., Trifilieff A., Barbier M., Altruda F., Hirsch E., Wymann M. P., Phosphoinositide 3-kinase γ is an essential amplifier of mast cell function. Immunity 16, 441–451 (2002). [DOI] [PubMed] [Google Scholar]
- 8.Hirsch E., Katanaev V. L., Garlanda C., Azzolino O., Pirola L., Silengo L., Sozzani S., Mantovani A., Altruda F., Wymann M. P., Central role for G protein-coupled phosphoinositide 3-kinase γ in inflammation. Science 287, 1049–1053 (2000). [DOI] [PubMed] [Google Scholar]
- 9.Camps M., Rückle T., Ji H., Ardissone V., Rintelen F., Shaw J., Ferrandi C., Chabert C., Gillieron C., Françon B., Martin T., Gretener D., Perrin D., Leroy D., Vitte P. A., Hirsch E., Wymann M. P., Cirillo R., Schwarz M. K., Rommel C., Blockade of PI3Kγ suppresses joint inflammation and damage in mouse models of rheumatoid arthritis. Nat. Med. 11, 936–943 (2005). [DOI] [PubMed] [Google Scholar]
- 10.Fougerat A., Gayral S.´., Gourdy P., Schambourg A., Rückle T., Schwarz M. K., Rommel C., Hirsch E., Arnal J. F.ṃ., Salles J. P., Perret B., Breton-Douillon M., Wymann M. P., Laffargue M., Genetic and pharmacological targeting of phosphoinositide 3-kinase-γ reduces atherosclerosis and favors plaque stability by modulating inflammatory processes. Circulation 117, 1310–1317 (2008). [DOI] [PubMed] [Google Scholar]
- 11.Barber D. F., Bartolomé A., Hernandez C., Flores J. M., Redondo C., Fernandez-Arias C., Camps M., Rückle T., Schwarz M. K., Rodríguez S., Martinez-A C., Balomenos D., Rommel C., Carrera A. C., PI3Kγ inhibition blocks glomerulonephritis and extends lifespan in a mouse model of systemic lupus. Nat. Med. 11, 933–935 (2005). [DOI] [PubMed] [Google Scholar]
- 12.Patrucco E., Notte A., Barberis L., Selvetella G., Maffei A., Brancaccio M., Marengo S., Russo G., Azzolino O., Rybalkin S. D., Silengo L., Altruda F., Wetzker R., Wymann M. P., Lembo G., Hirsch E., PI3Kγ modulates the cardiac response to chronic pressure overload by distinct kinase-dependent and -independent effects. Cell 118, 375–387 (2004). [DOI] [PubMed] [Google Scholar]
- 13.Breasson L., Becattini B., Sardi C., Molinaro A., Zani F., Marone R., Botindari F., Bousquenaud M., Ruegg C., Wymann M. P., Solinas G., PI3Kγ activity in leukocytes promotes adipose tissue inflammation and early-onset insulin resistance during obesity. Sci. Signal. 10, eaaf2969 (2017). [DOI] [PubMed] [Google Scholar]
- 14.Campa C. C., Silva R. L., Margaria J. P., Pirali T., Mattos M. S., Kraemer L. R., Reis D. C., Grosa G., Copperi F., Dalmarco E. M., Lima-Júnior R. C. P., Aprile S., Sala V., Dal Bello F., Prado D. S., Alves-Filho J. C., Medana C., Cassali G. D., Tron G. C., Teixeira M. M., Ciraolo E., Russo R. C., Hirsch E., Inhalation of the prodrug PI3K inhibitor CL27c improves lung function in asthma and fibrosis. Nat. Commun. 9, 5232–5216 (2018). [DOI] [PMC free article] [PubMed] [Google Scholar]
- 15.Kaneda M. M., Cappello P., Nguyen A. V., Ralainirina N., Hardamon C. R., Foubert P., Schmid M. C., Sun P., Mose E., Bouvet M., Lowy A. M., Valasek M. A., Sasik R., Novelli F., Hirsch E., Varner J. A., Macrophage PI3Kγ drives pancreatic ductal adenocarcinoma progression. Cancer Discov. 6, 870–885 (2016). [DOI] [PMC free article] [PubMed] [Google Scholar]
- 16.De Henau O., Rausch M., Winkler D., Campesato L. F., Liu C., Cymerman D. H., Budhu S., Ghosh A., Pink M., Tchaicha J., Douglas M., Tibbitts T., Sharma S., Proctor J., Kosmider N., White K., Stern H., Soglia J., Adams J., Palombella V. J., Govern K. M., Kutok J. L., Wolchok J. D., Merghoub T., Overcoming resistance to checkpoint blockade therapy by targeting PI3Kγ in myeloid cells. Nature 539, 443–447 (2016). [DOI] [PMC free article] [PubMed] [Google Scholar]
- 17.Kaneda M. M., Messer K. S., Ralainirina N., Li H., Leem C. J., Gorjestani S., Woo G., Nguyen A. V., Figueiredo C. C., Foubert P., Schmid M. C., Pink M., Winkler D. G., Rausch M., Palombella V. J., Kutok J., McGovern K., Frazer K. A., Wu X., Karin M., Sasik R., Cohen E. E. W., Varner J. A., PI3Kγ is a molecular switch that controls immune suppression. Nature 539, 437–442 (2016). [DOI] [PMC free article] [PubMed] [Google Scholar]
- 18.Stoyanov B., Volinia S., Hanck T., Rubio I., Loubtchenkov M., Malek D., Stoyanova S., Vanhaesebroeck B., Dhand R., Nurnberg B., al, Cloning and characterization of a G protein-activated human phosphoinositide-3 kinase. Science 269, 690–693 (1995). [DOI] [PubMed] [Google Scholar]
- 19.Schmid M. C., Avraamides C. J., Dippold H. C., Franco I., Foubert P., Ellies L. G., Acevedo L. M., Manglicmot J. R. E., Song X., Wrasidlo W., Blair S. L., Ginsberg M. H., Cheresh D. A., Hirsch E., Field S. J., Varner J. A., Receptor tyrosine kinases and TLR/IL1Rs unexpectedly activate myeloid cell PI3kγ, a single convergent point promoting tumor inflammation and progression. Cancer Cell 19, 715–727 (2011). [DOI] [PMC free article] [PubMed] [Google Scholar]
- 20.Luo L., Wall A. A., Tong S. J., Hung Y., Xiao Z., Tarique A. A., Sly P. D., Fantino E., Marzolo M. P., Stow J. L., TLR crosstalk activates LRP1 to recruit Rab8a and PI3Kγ for suppression of inflammatory responses. Cell Rep. 24, 3033–3044 (2018). [DOI] [PubMed] [Google Scholar]
- 21.Pacold M. E., Suire S., Perisic O., Lara-Gonzalez S., Davis C. T., Walker E. H., Hawkins P. T., Stephens L., Eccleston J. F., Williams R. L., Crystal structure and functional analysis of Ras binding to its effector phosphoinositide 3-kinase γ. Cell 103, 931–944 (2000). [DOI] [PubMed] [Google Scholar]
- 22.Walker E. H., Perisic O., Ried C., Stephens L., Williams R. L., Structural insights into phosphoinositide 3-kinase catalysis and signalling. Nature 402, 313–320 (1999). [DOI] [PubMed] [Google Scholar]
- 23.Dornan G. L., Burke J. E., Molecular mechanisms of human disease mediated by oncogenic and primary immunodeficiency mutations in class IA phosphoinositide 3-kinases. Front. Immunol. 9, 575 (2018). [DOI] [PMC free article] [PubMed] [Google Scholar]
- 24.Lawrence M. S., Stojanov P., Mermel C. H., Robinson J. T., Garraway L. A., Golub T. R., Meyerson M., Gabriel S. B., Lander E. S., Getz G., Discovery and saturation analysis of cancer genes across 21 tumour types. Nature 505, 495–501 (2014). [DOI] [PMC free article] [PubMed] [Google Scholar]
- 25.Kang S., Denley A., Vanhaesebroeck B., Vogt P. K., Oncogenic transformation induced by the p110β, −γ, and –Δ isoforms of class I phosphoinositide 3-kinase. Proc. Natl. Acad. Sci. U.S.A. 103, 1289–1294 (2006). [DOI] [PMC free article] [PubMed] [Google Scholar]
- 26.Wang J., Li M., Han X., Wang H., Wang X., Ma G., Xia T., Wang S., MiR-1976 knockdown promotes epithelial-mesenchymal transition and cancer stem cell properties inducing triple-negative breast cancer metastasis. Cell Death Dis. 11, 500–512 (2020). [DOI] [PMC free article] [PubMed] [Google Scholar]
- 27.Torres C., Mancinelli G., Cordoba-Chacon J., Viswakarma N., Castellanos K., Grimaldo S., Kumar S., Principe D., Dorman M. J., McKinney R., Hirsch E., Dawson D., Munshi H. G., Rana A., Grippo P. J., p110γ deficiency protects against pancreatic carcinogenesis yet predisposes to diet-induced hepatotoxicity. Proc. Natl. Acad. Sci. U.S.A. 116, 14724–14733 (2019). [DOI] [PMC free article] [PubMed] [Google Scholar]
- 28.Zhang S., Chung W. C., Wu G., Egan S. E., Miele L., Xu K., Manic fringe promotes a claudin-low breast cancer phenotype through notch-mediated PIK3CG induction. Cancer Res. 75, 1936–1943 (2015). [DOI] [PMC free article] [PubMed] [Google Scholar]
- 29.Shymanets A., Prajwal, Bucher K., Beer-Hammer S., Harteneck C., Nürnberg B., p87 and p101 subunits are distinct regulators determining class IB PI3K specificity. J. Biol. Chem. 288, 31059–31068 (2013). [DOI] [PMC free article] [PubMed] [Google Scholar]
- 30.Rynkiewicz N. K., Anderson K. E., Suire S., Collins D. M., Karanasios E., Vadas O., Williams R., Oxley D., Clark J., Stephens L. R., Hawkins P. T., Gβγ is a direct regulator of endogenous p101/p110γ and p84/p110γ PI3Kγ complexes in mouse neutrophils. Sci. Signal. 13, eaaz4003 (2020). [DOI] [PMC free article] [PubMed] [Google Scholar]
- 31.Deladeriere A., Gambardella L., Pan D., Anderson K. E., Hawkins P. T., Stephens L. R., The regulatory subunits of PI3Kγ control distinct neutrophil responses. Sci. Signal. 8, ra8 (2015). [DOI] [PubMed] [Google Scholar]
- 32.Vadas O., Dbouk H. A., Shymanets A., Perisic O., Burke J. E., Abi Saab W. F., Khalil B. D., Harteneck C., Bresnick A. R., Nurnberg B., Backer J. M., Williams R. L., Molecular determinants of PI3Kγ-mediated activation downstream of G-protein-coupled receptors (GPCRs). Proc. Natl. Acad. Sci. U.S.A. 110, 18862–18867 (2013). [DOI] [PMC free article] [PubMed] [Google Scholar]
- 33.Kurig B., Shymanets A., Bohnacker T., Prajwal, Brock C., Ahmadian M. R., Schaefer M., Gohla A., Harteneck C., Wymann M. P., Jeanclos E., Nurnberg B., Ras is an indispensable coregulator of the class IB phosphoinositide 3-kinase p87/p110γ. Proc. Natl. Acad. Sci. U.S.A. 106, 20312–20317 (2009). [DOI] [PMC free article] [PubMed] [Google Scholar]
- 34.Walker E. H., Pacold M. E., Perisic O., Stephens L., Hawkins P. T., Wymann M. P., Williams R. L., Structural determinants of phosphoinositide 3-kinase inhibition by wortmannin, LY294002, quercetin, myricetin, and staurosporine. Mol. Cell 6, 909–919 (2000). [DOI] [PubMed] [Google Scholar]
- 35.Wang R. Y.-R., Song Y., Barad B. A., Cheng Y., Fraser J. S., DiMaio F., Automated structure refinement of macromolecular assemblies from cryo-EM maps using Rosetta. eLife 5, e17219 (2016). [DOI] [PMC free article] [PubMed] [Google Scholar]
- 36.Yang J., Anishchenko I., Park H., Peng Z., Ovchinnikov S., Baker D., Improved protein structure prediction using predicted interresidue orientations. Proc. Natl. Acad. Sci. U.S.A. 117, 1496–1503 (2020). [DOI] [PMC free article] [PubMed] [Google Scholar]
- 37.Holm L., DALI and the persistence of protein shape. Protein Sci. 29, 128–140 (2020). [DOI] [PMC free article] [PubMed] [Google Scholar]
- 38.Pulkoski-Gross M. J., Jenkins M. L., Truman J.-P., Salama M. F., Clarke C. J., Burke J. E., Hannun Y. A., Obeid L. M., An intrinsic lipid-binding interface controls sphingosine kinase 1 function. J. Lipid Res. 59, 462–474 (2018). [DOI] [PMC free article] [PubMed] [Google Scholar]
- 39.Voigt P., Brock C., Nurnberg B., Schaefer M., Assigning functional domains within the p101 regulatory subunit of phosphoinositide 3-kinase γ. J. Biol. Chem. 280, 5121–5127 (2005). [DOI] [PubMed] [Google Scholar]
- 40.Shymanets A., Prajwal, Vadas O., Czupalla C., LoPiccolo J., Brenowitz M., Ghigo A., Hirsch E., Krause E., Wetzker R., Williams R. L., Harteneck C., Nürnberg B., Different inhibition of Gβγ-stimulated class IB phosphoinositide 3-kinase (PI3K) variants by a monoclonal antibody. Specific function of p101 as a Gβγ-dependent regulator of PI3Kγ enzymatic activity. Biochem. J. 469, 59–69 (2015). [DOI] [PMC free article] [PubMed] [Google Scholar]
- 41.Walser R., Burke J. E., Gogvadze E., Bohnacker T., Zhang X., Hess D., Küenzi P., Leitges M., Hirsch E., Williams R. L., Laffargue M., Wymann M. P., PKCβ phosphorylates PI3Kγ to activate it and release it from GPCR control. PLoS Biol. 11, e1001587 (2013). [DOI] [PMC free article] [PubMed] [Google Scholar]
- 42.Vadas O., Burke J. E., Zhang X., Berndt A., Williams R. L., Structural basis for activation and inhibition of class I phosphoinositide 3-kinases. Sci. Signal. 4, re2 (2011). [DOI] [PubMed] [Google Scholar]
- 43.Tate J. G., Bamford S., Jubb H. C., Sondka Z., Beare D. M., Bindal N., Boutselakis H., Cole C. G., Creatore C., Dawson E., Fish P., Harsha B., Hathaway C., Jupe S. C., Kok C. Y., Noble K., Ponting L., Ramshaw C. C., Rye C. E., Speedy H. E., Stefancsik R., Thompson S. L., Wang S., Ward S., Campbell P. J., Forbes S. A., COSMIC: The catalogue of somatic mutations in cancer. Nucleic Acids Res. 47, D941–D947 (2019). [DOI] [PMC free article] [PubMed] [Google Scholar]
- 44.Chung J. K., Nocka L. M., Decker A., Wang Q., Kadlecek T. A., Weiss A., Kuriyan J., Groves J. T., Switch-like activation of Bruton’s tyrosine kinase by membrane-mediated dimerization. Proc. Natl. Acad. Sci. U.S.A. 116, 10798–10803 (2019). [DOI] [PMC free article] [PubMed] [Google Scholar]
- 45.Bohnacker T., Marone R., Collmann E., Calvez R., Hirsch E., Wymann M. P., PI3Kγ adaptor subunits define coupling to degranulation and cell motility by distinct PtdIns(3,4,5)P3 pools in mast cells. Sci. Signal. 2, ra27 (2009). [DOI] [PubMed] [Google Scholar]
- 46.Huang C.-H., Mandelker D., Schmidt-Kittler O., Samuels Y., Velculescu V. E., Kinzler K. W., Vogelstein B., Gabelli S. B., Amzel L. M., The structure of a human p110alpha/p85alpha complex elucidates the effects of oncogenic PI3Kalpha mutations. Science 318, 1744–1748 (2007). [DOI] [PubMed] [Google Scholar]
- 47.Maier U., Babich A., Nurnberg B., Roles of non-catalytic subunits in Gβγ-induced activation of class I phosphoinositide 3-kinase isoforms β and γ. J. Biol. Chem. 274, 29311–29317 (1999). [DOI] [PubMed] [Google Scholar]
- 48.Brock C., Schaefer M., Reusch H. P., Czupalla C., Michalke M., Spicher K., Schultz G.¨., Nürnberg B., Roles of G βγ in membrane recruitment and activation of p110 γ/p101 phosphoinositide 3-kinase γ. J. Cell Biol. 160, 89–99 (2003). [DOI] [PMC free article] [PubMed] [Google Scholar]
- 49.Wall A. A., Luo L., Hung Y., Tong S. J., Condon N. D., Blumenthal A., Sweet M. J., Stow J. L., Small GTPase Rab8a-recruited phosphatidylinositol 3-kinase γ regulates signaling and cytokine outputs from endosomal toll-like receptors. J. Biol. Chem. 292, 4411–4422 (2017). [DOI] [PMC free article] [PubMed] [Google Scholar]
- 50.Burke J. E., Perisic O., Masson G. R., Vadas O., Williams R. L., Oncogenic mutations mimic and enhance dynamic events in the natural activation of phosphoinositide 3-kinase p110α (PIK3CA). Proc. Natl. Acad. Sci. U.S.A. 109, 15259–15264 (2012). [DOI] [PMC free article] [PubMed] [Google Scholar]
- 51.Nava Rodrigues D., Rescigno P., Liu D., Yuan W., Carreira S., Lambros M. B., Seed G., Mateo J., Riisnaes R., Mullane S., Margolis C., Miao D., Miranda S., Dolling D., Clarke M., Bertan C., Crespo M., Boysen G., Ferreira A., Sharp A., Figueiredo I., Keliher D., Aldubayan S., Burke K. P., Sumanasuriya S., Fontes M. S., Bianchini D., Zafeiriou Z., Teixeira Mendes L. S., Mouw K., Schweizer M. T., Pritchard C. C., Salipante S., Taplin M. E., Beltran H., Rubin M. A., Cieslik M., Robinson D., Heath E., Schultz N., Armenia J., Abida W., Scher H., Lord C., D’Andrea A., Sawyers C. L., Chinnaiyan A. M., Alimonti A., Nelson P. S., Drake C. G., van Allen E. M., de Bono J. S., Immunogenomic analyses associate immunological alterations with mismatch repair defects in prostate cancer. J. Clin. Invest. 128, 4441–4453 (2018). [DOI] [PMC free article] [PubMed] [Google Scholar]
- 52.Rathinaswamy M. K., Gaieb Z., Fleming K. D., Borsari C., Harris N. J., Moeller B. E., Wymann M. P., Amaro R. E., Burke J. E., Disease related mutations in PI3Kγ disrupt regulatory C-terminal dynamics and reveal a path to selective inhibitors. eLife 10, e64691 (2021). [DOI] [PMC free article] [PubMed] [Google Scholar]
- 53.Takeda A. J., Maher T. J., Zhang Y., Lanahan S. M., Bucklin M. L., Compton S. R., Tyler P. M., Comrie W. A., Matsuda M., Olivier K. N., Pittaluga S., McElwee J. J., Long Priel D. A., Kuhns D. B., Williams R. L., Mustillo P. J., Wymann M. P., Koneti Rao V., Lucas C. L., Human PI3Kγ deficiency and its microbiota-dependent mouse model reveal immunodeficiency and tissue immunopathology. Nat. Commun. 10, 4364–4312 (2019). [DOI] [PMC free article] [PubMed] [Google Scholar]
- 54.Hanker A. B., Kaklamani V., Arteaga C. L., Challenges for the clinical development of PI3K inhibitors: Strategies to improve their impact in solid tumors. Cancer Discov. 9, 482–491 (2019). [DOI] [PMC free article] [PubMed] [Google Scholar]
- 55.Dwyer C. J., Arhontoulis D. C., Rivera G. O. R., Knochelmann H. M., Smith A. S., Wyatt M. M., Rubinstein M. P., Atkinson C., Thaxton J. E., Neskey D. M., Paulos C. M., Ex vivo blockade of PI3K γ or Δ signaling enhances the antitumor potency of adoptively transferred CD8+ T cells. Eur. J. Immunol. 2, 1031 (2020). [DOI] [PMC free article] [PubMed] [Google Scholar]
- 56.Perino A., Ghigo A., Ferrero E., Morello F., Santulli G., Baillie G. S., Damilano F., Dunlop A. J., Pawson C., Walser R., Levi R., Altruda F., Silengo L., Langeberg L. K., Neubauer G., Heymans S., Lembo G., Wymann M. P., Wetzker R., Houslay M. D., Iaccarino G., Scott J. D., Hirsch E., Integrating cardiac PIP3 and cAMP signaling through a PKA anchoring function of p110γ. Mol. Cell 42, 84–95 (2011). [DOI] [PMC free article] [PubMed] [Google Scholar]
- 57.Lima B. H. F., Marques P. E., Gomides L. F., Mattos M. S., Kraemer L., Queiroz-Junior C. M., Lennon M., Hirsch E., Russo R. C., Menezes G. B., Hessel E. M., Amour A., Teixeira M. M., Converging TLR9 and PI3Kγ signaling induces sterile inflammation and organ damage. Sci. Rep. 9, 19085 (2019). [DOI] [PMC free article] [PubMed] [Google Scholar]
- 58.Dornan G. L., Stariha J. T. B., Rathinaswamy M. K., Powell C. J., Boulanger M. J., Burke J. E., Defining how oncogenic and developmental mutations of PIK3R1 alter the regulation of class IA phosphoinositide 3-kinases. Structure 28, 145–156.e5 (2020). [DOI] [PubMed] [Google Scholar]
- 59.Emsley P., Lohkamp B., Scott W. G., Cowtan K., Features and development of Coot. Acta Crystallogr. D Biol. Crystallogr. 66, 486–501 (2010). [DOI] [PMC free article] [PubMed] [Google Scholar]
- 60.Liebschner D., Afonine P. V., Baker M. L., Bunkóczi G., Chen V. B., Croll T. I., Hintze B., Hung L. W., Jain S., McCoy A. J., Moriarty N. W., Oeffner R. D., Poon B. K., Prisant M. G., Read R. J., Richardson J. S., Richardson D. C., Sammito M. D., Sobolev O. V., Stockwell D. H., Terwilliger T. C., Urzhumtsev A. G., Videau L. L., Williams C. J., Adams P. D., Macromolecular structure determination using X-rays, neutrons and electrons: Recent developments in Phenix. Acta Crystallogr. D Struct. Biol.. 75, 861–877 (2019). [DOI] [PMC free article] [PubMed] [Google Scholar]
- 61.Kozasa T., Gilman A. G., Purification of recombinant G proteins from Sf9 cells by hexahistidine tagging of associated Subunits. J. Biol. Chem. 270, 1734–1741 (1995). [DOI] [PubMed] [Google Scholar]
- 62.Stariha J. T. B., Hoffmann R. M., Hamelin D. J., Burke J. E., Probing protein-membrane interactions and dynamics using hydrogen-deuterium exchange mass spectrometry (HDX-MS). Methods Mol. Biol. 2263, 465–485 (2021). [DOI] [PubMed] [Google Scholar]
- 63.Dobbs J. M., Jenkins M. L., Burke J. E., Escherichia coli and Sf9 contaminant databases to increase efficiency of tandem mass spectrometry peptide identification in structural mass spectrometry experiments. J. Am. Soc. Mass Spectrom. 31, 2202–2209 (2020). [DOI] [PubMed] [Google Scholar]
- 64.Masson G. R., Burke J. E., Ahn N. G., Anand G. S., Borchers C., Brier S., Bou-Assaf G. M., Engen J. R., Englander S. W., Faber J., Garlish R., Griffin P. R., Gross M. L., Guttman M., Hamuro Y., Heck A. J. R., Houde D., Iacob R. E., Jørgensen T. J. D., Kaltashov I. A., Klinman J. P., Konermann L., Man P., Mayne L., Pascal B. D., Reichmann D., Skehel M., Snijder J., Strutzenberg T. S., Underbakke E. S., Wagner C., Wales T. E., Walters B. T., Weis D. D., Wilson D. J., Wintrode P. L., Zhang Z., Zheng J., Schriemer D. C., Rand K. D., Recommendations for performing, interpreting and reporting hydrogen deuterium exchange mass spectrometry (HDX-MS) experiments. Nat. Methods 16, 595–602 (2019). [DOI] [PMC free article] [PubMed] [Google Scholar]
- 65.Perez-Riverol Y., Csordas A., Bai J., Bernal-Llinares M., Hewapathirana S., Kundu D. J., Inuganti A., Griss J., Mayer G., Eisenacher M., Pérez E., Uszkoreit J., Pfeuffer J., Sachsenberg T., Yılmaz Ş., Tiwary S., Cox J., Audain E., Walzer M., Jarnuczak A. F., Ternent T., Brazma A., Vizcaíno J. A., The PRIDE database and related tools and resources in 2019: Improving support for quantification data. Nucleic Acids Res. 47, D442–D450 (2019). [DOI] [PMC free article] [PubMed] [Google Scholar]
- 66.Saini D. K., Kalyanaraman V., Chisari M., Gautam N., A family of G protein βγ subunits translocate reversibly from the plasma membrane to endomembranes on receptor activation. J. Biol. Chem. 282, 24099–24108 (2007). [DOI] [PMC free article] [PubMed] [Google Scholar]
- 67.Hansen S. D., Huang W. Y. C., Lee Y. K., Bieling P., Christensen S. M., Groves J. T., Stochastic geometry sensing and polarization in a lipid kinase-phosphatase competitive reaction. Proc. Natl. Acad. Sci. U.S.A. 116, 15013–15022 (2019). [DOI] [PMC free article] [PubMed] [Google Scholar]
- 68.Yin J., Lin A. J., Golan D. E., Walsh C. T., Site-specific protein labeling by Sfp phosphopantetheinyl transferase. Nat. Protoc. 1, 280–285 (2006). [DOI] [PubMed] [Google Scholar]
- 69.Jaqaman K., Loerke D., Mettlen M., Kuwata H., Grinstein S., Schmid S. L., Danuser G., Robust single-particle tracking in live-cell time-lapse sequences. Nat. Methods 5, 695–702 (2008). [DOI] [PMC free article] [PubMed] [Google Scholar]
Associated Data
This section collects any data citations, data availability statements, or supplementary materials included in this article.
Supplementary Materials
Supplementary material for this article is available at http://advances.sciencemag.org/cgi/content/full/7/35/eabj4282/DC1