Abstract
Recent studies suggest that deep learning systems can now achieve performance on par with medical experts in diagnosis of disease. A prime example is in the field of ophthalmology, where convolutional neural networks (CNNs) have been used to detect retinal and ocular diseases. However, this type of artificial intelligence (AI) has yet to be adopted clinically due to questions regarding robustness of the algorithms to datasets collected at new clinical sites and a lack of explainability of AI-based predictions, especially relative to those of human expert counterparts. In this work, we develop CNN architectures that demonstrate robust detection of glaucoma in optical coherence tomography (OCT) images and test with concept activation vectors (TCAVs) to infer what image concepts CNNs use to generate predictions. Furthermore, we compare TCAV results to eye fixations of clinicians, to identify common decision-making features used by both AI and human experts. We find that employing fine-tuned transfer learning and CNN ensemble learning create end-to-end deep learning models with superior robustness compared to previously reported hybrid deep-learning/machine-learning models, and TCAV/eye-fixation comparison suggests the importance of three OCT report sub-images that are consistent with areas of interest fixated upon by OCT experts to detect glaucoma. The pipeline described here for evaluating CNN robustness and validating interpretable image concepts used by CNNs with eye movements of experts has the potential to help standardize the acceptance of new AI tools for use in the clinic.
Keywords: Computer-aided decision support, Deep learning, Eye tracking, Medical expert systems, Optical Coherence Tomography, Robustness
I. Introduction
WITH massive quantities of information being gathered each day from high resolution imaging to continuous monitoring of physiologic responses via biosensors, there are few disciplines where the critical role of artificial intelligence (AI) and machine learning is more apparent than in medicine [1], [2]. It is necessary for this ‘data deluge’ to be efficiently and intelligently parsed in order to provide effective medical care; therefore, one modern role of AI is to provide robust screening support in the form of automated image analysis, allowing more time for nuanced aspects of care (or scrutiny of ambiguous cases) for human experts. Specifically within ophthalmology, with moderate to severe unaddressed visual impairment afflicting 217 million people worldwide [3], AI can serve to expedite accurate and interpretable eye disease screening and diagnosis.
As an example, glaucoma impacts an estimated 76 million people worldwide and is projected to impact 112 million people by 2040 [4]. Unlike other eye diseases, glaucoma does not have an agreed-upon reference standard for diagnosis [5], so data can be time consuming to understand and even more difficult to draw accurate conclusions from. Optical Coherence Tomography (OCT) is increasingly becoming a primary modality for detection and diagnosis of glaucoma, though interpreting these data typically requires a substantial level of expertise. Evident from past work applying deep learning to detection of diabetic retinopathy and macular degeneration from OCT images [6], AI can help by learning patterns in the data that otherwise require expert interpretation, by distilling important features of images that enable accurate classification, ultimately speeding up the work of clinicians as well as corroborating their conclusions by helping to define standards and arrive at inter-expert consensus.
A. Addressing a Key Challenge for Glaucoma Diagnosis
Unlike for other eye diseases such as diabetic retinopathy (DR) [7], [8] and age-related macular degeneration (AMD) [9], developing AI for glaucoma diagnosis carries an additional challenge: even among clinicians, there are few universally agreed-upon features - especially from OCT reports - to determine presence or absence of glaucoma [10], [11]. We address this challenge by describing development of robust end-to-end deep learning models which exhibit high performance as well as interpretability. Here, interpretability refers to quantitative explanation of which medical concepts are most important for accurate glaucoma detection by convolutional neural networks (CNNs), followed by corroboration with eye-tracking of medical experts as they viewed OCT reports. Quantification of such OCT features that are common between humans and machines for accurate glaucoma detection is a step toward arriving at a standard, clinically agreed-upon set of OCT features for glaucoma diagnosis.
B. Innovation: Robustness and Interpretability in Conjunction with Expert Eye Movements
Evaluation of a deployed diabetic retinopathy deep learning system [12] showed that expected performance was impacted by contextual and environmental factors in the clinic that are not reflected in results observed in the lab. For example, a patient may have accidentally moved during image acquisition, causing incomplete or anomalous data. Toward fulfilling the promise of AI to assist in the clinic, an existing challenge is building deep learning models that are robust to variation in environmental factors that impact data collection. In this work, we build from the set of high-performing CNNs described in previous work [13] by evaluating the robustness of previous high performance on a laboratory (‘Lab’) dataset collected in the same location as the training data to a new clinical test set. This new dataset (described in detail in [14]), called the ‘Field’ dataset here onward, is composed of similar image type as the training data but was collected at a different facility and hence has minor variations not represented in the original training data. As anticipated, these original models, while exhibiting high performance on a controlled ‘Lab’ test set, deteriorated in performance when faced with the ‘Field’ test set [15], [16]. A highlight of our work here is that we show how the anticipated drop in performance on the ‘Field’ dataset is reduced by employing architectural improvements consisting of pre-trained CNN fine-tuning/transfer learning and CNN ensemble learning. We find that our newly-designed models, while attaining slightly lower accuracy on the original ‘Lab’ test set in some cases, retained robust performance when evaluated on the ‘Field’ test set, unlike their hybrid deep learning/machine learning (DL/ML) counterparts [13]. Fig. 1 illustrates the key difference between hybrid DL/ML pipelines from our past work and the end-to-end deep learning pipelines developed in this work. We also analyzed the impact of using a CNN ensemble on robustness to the new ‘Field’ Set.
Fig. 1.

The key difference between the previously-developed hybrid deep learning/machine learning pipeline (top diagram) is replacement of the feature extractor (pre-trained CNN) followed by machine learning algorithm (random forest) modules with an end-to-end deep learning algorithm consisting of a pre-trained CNN followed by a fine-tuned fully connected classifier (bottom diagram). Graphic adapted from [17].
The second contribution of our work is to enhance explainability of the specific features utilized by our CNNs to achieve their classification decisions; to accomplish this, we used Testing with Concept Activation Vectors (TCAVs) to quantify human-interpretable concepts of importance in OCT images that result in accurate glaucoma classification. Testing with CAVs [18] enables interpretability of results beyond qualitative class activation maps by attributing a quantitative score to the concepts that CNNs are using to achieve their classification results. Our work distinguishes itself by taking the step of corroborating concepts of importance for CNNs with image regions on which human experts also fixated the most, based on tracking their eye movements as they classified OCT reports. While other groups have shown generalizability of glaucoma detection from fundus images [10] or interpretability of CNN-based glaucoma detection from OCT B-scans [19], [20], our work’s novelty also lies in the development of robust and interpretable deep learning models for glaucoma detection specifically from OCT reports and sub-images. In contrast to extensively-studied fundus images, our models take as input the highly-informative first resource used by eye specialists for glaucoma detection: OCT-derived images, including retinal nerve fiber layer (RNFL) and retinal ganglion cell inner plexiform layer (RGCP) probability maps and thickness maps as well as full OCT reports (Fig. 3).
Fig. 3.
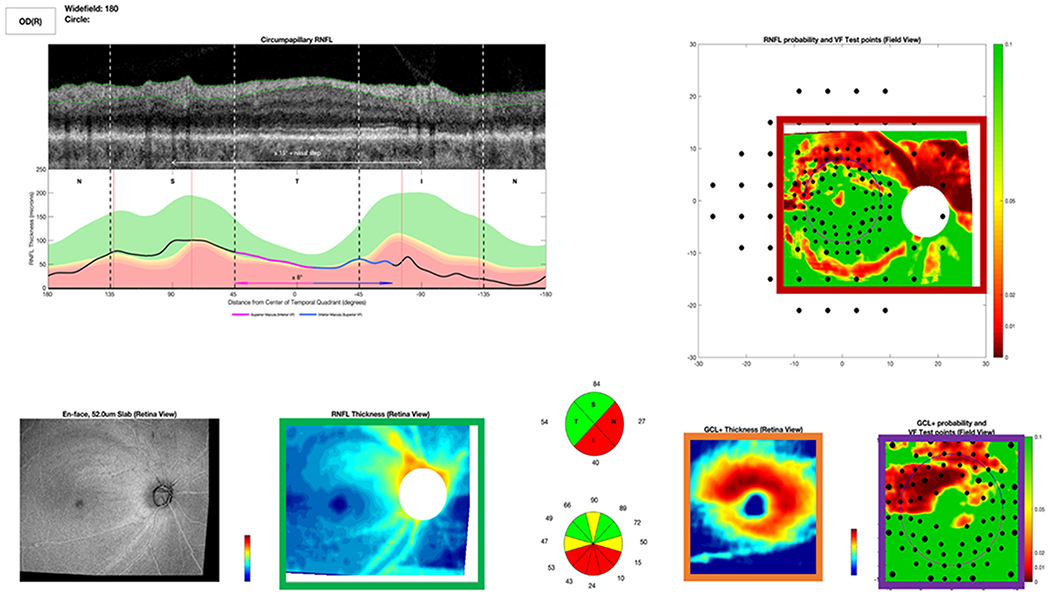
Full OCT Report used by OCT expert to detect glaucoma. Red box indicates an RNFL map. Violet box shows an RGCP map. Orange box contains RGCP thickness map, and green box contains RNFL thickness map. The grayscale image at far bottom left is an en-face (top-down) image of the retina, and the grayscale image at top left is an OCT b-scan (depth image), showing a cross section of the retina; directly beneath the b-scan is a thickness plot (black line), indicating whether this subject’s RNFL thickness is within (green curve) or outside the 95% (yellow) or 99% (red) limits of healthy controls.
II. Methods
We evaluated the performance of previously-developed hybrid DL/ML models [13] on a new ‘Field’ test set of OCT probability maps collected at a different location, by different operators, and using a different OCT machine than the set used for training in past work. We developed new, robust end-to-end deep learning model architectures, using OCT-image fine-tuned transfer learning of the last few layers of state-of-the-art pre-trained CNNs. For the most robust models, we applied interpretability techniques, including Gradient Weighted Class Activation Maps (Grad-CAMs) [21] and TCAVs [18], to determine image concepts most critical for accurate glaucoma detection by CNNs. Lastly, via tracking experts’ eye movements as they viewed OCT reports, we closed the loop by comparing regions on OCT reports with maximum expert eye fixation density to important OCT report concepts determined by CNN interpretation.
A. Performance Evaluation of Hybrid DL/ML Models on the ‘Field’ Dataset
The performance of five CNNs previously trained to detect early glaucomatous damage from OCT RNFL probability maps, which achieved 95% accuracy on a test set of 197 images collected in our lab [13], were examined on a new test set without any modification to CNN architecture. Training, validation, and testing were carried out in an approximately 55%:20%:25% split (395 for training, 145 for validation, and 197 for testing), as described in detail in previous work [13] (the last 25% comprised the 197-image ‘Lab’ test set). The new ‘Field’ test set was composed of 135 OCT RNFL probability maps acquired at the Columbia University Medical Center [14]. 1 An example of input provided to the CNNs is shown in Fig. 2 (also present in red box within full report, Fig. 3). Ground truth labels were obtained from an OCT expert (D.C.H) with extensive experience grading OCT images as he viewed full OCT reports (Fig. 3). The OCT expert provided gradings between 0 and 100, with less than 50 indicating the image was not glaucomatous (NG) and greater than 50 indicating the image was glaucomatous (G). We used this binary classification (G/NG) for the present study. Test accuracy (correctly classified images divided by total number of images) was computed for all five hybrid DL/ML models on the ‘Lab’ and ‘Field’ datasets [15], [16].
Fig. 2.
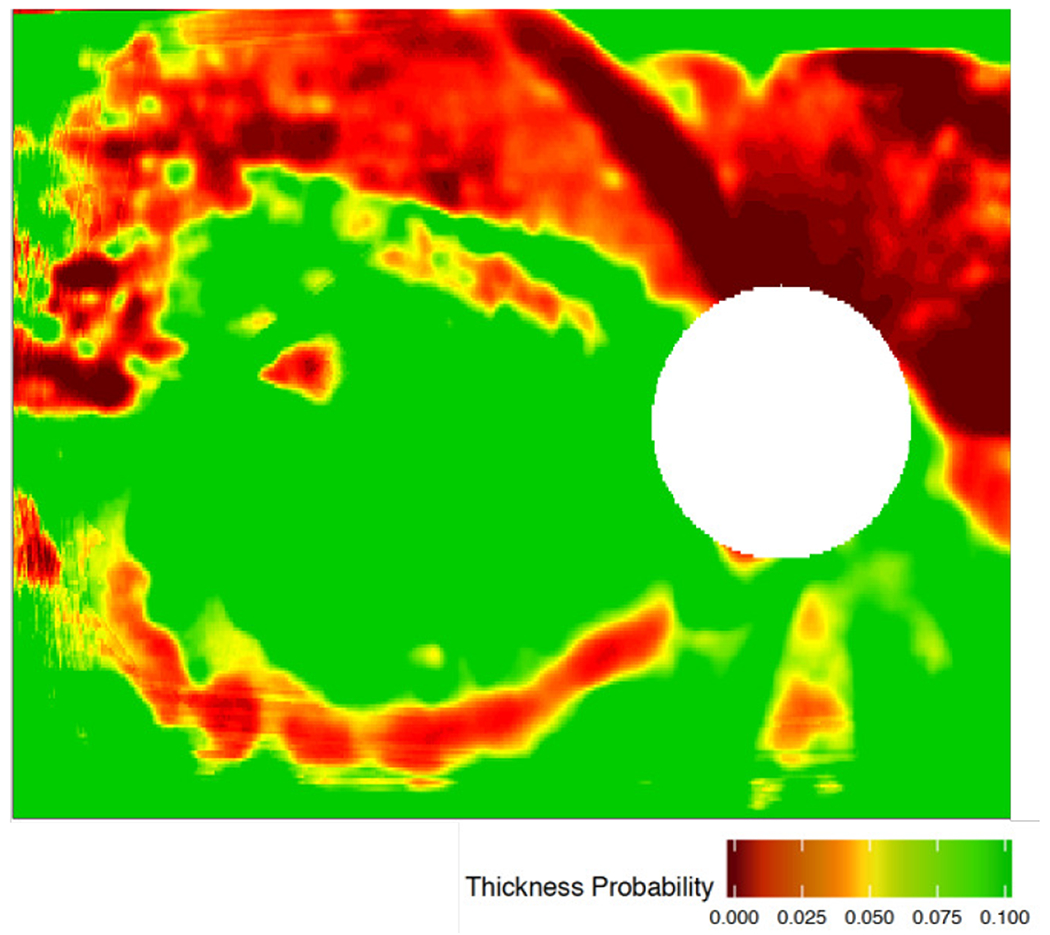
Sample OCT retinal nerve fiber layer (RNFL) image of a patient’s right eye (OD) with glaucoma. Green-to-red color spectrum indicates increasing spatial probability of retinal tissue degeneration compared to age-matched and gender-matched healthy population (i.e. green indicates normal/healthy tissue regions, while yellow and red indicate abnormal/potentially diseased tissue regions). White circle in image represents location of the optic nerve, where ganglion cell axons converge, so there is limited retinal tissue in that region.
B. Development of Robust End-to-End Deep Learning Models and a Robust CNN Ensemble
Using fine-tuned transfer learning [22], we designed and implemented four new end-to-end deep learning models as well as a CNN ensemble. The first consisted of the InceptionV3 [23] network pre-trained on ImageNet [24] followed by three dense layers (interspersed with dropout and Rectified Linear Unit (ReLU) or sigmoid activation functions between each dense layer) to enable fine-tuning to the OCT medical image domain. The second, third, and fourth models consisted of ResNet-18 [25] VGG-16 [26], and DenseNet-121 [27], respectively, each followed by similar fine-tuned classifier layers as described for the first model. Choice of InceptionV3, ResNet-18, and VGG-16 was for direct comparison to hybrid DL/ML models from previous work; addition of DenseNet-121 [28] was due to its high performance combined with its efficient use of parameters especially for fine-tuning scenarios [28], [29]. Each model was implemented using Keras, the Python deep learning library [22], and was saved for subsequent performance testing and interpretability analysis (code available on GitHub [30] and models available on IEEE DataPort [31]). Training optimization was carried out via RMSprop or Adam [32] optimizers with learning rates of 2 × 10⁻⁵ or 2 × 10⁻⁶. A schematic of these end-to-end deep learning models with architecture details is shown in Fig. 4. Training was carried out using data augmentation and best-of-ten Monte Carlo cross-validation (80%:20%) splits with the 737-image dataset from previous work [13]. Training was carried out for 30 epochs with a batch size of 1. Each model’s performance was evaluated on the ‘Lab’ and ‘Field’ datasets.
Fig. 4.
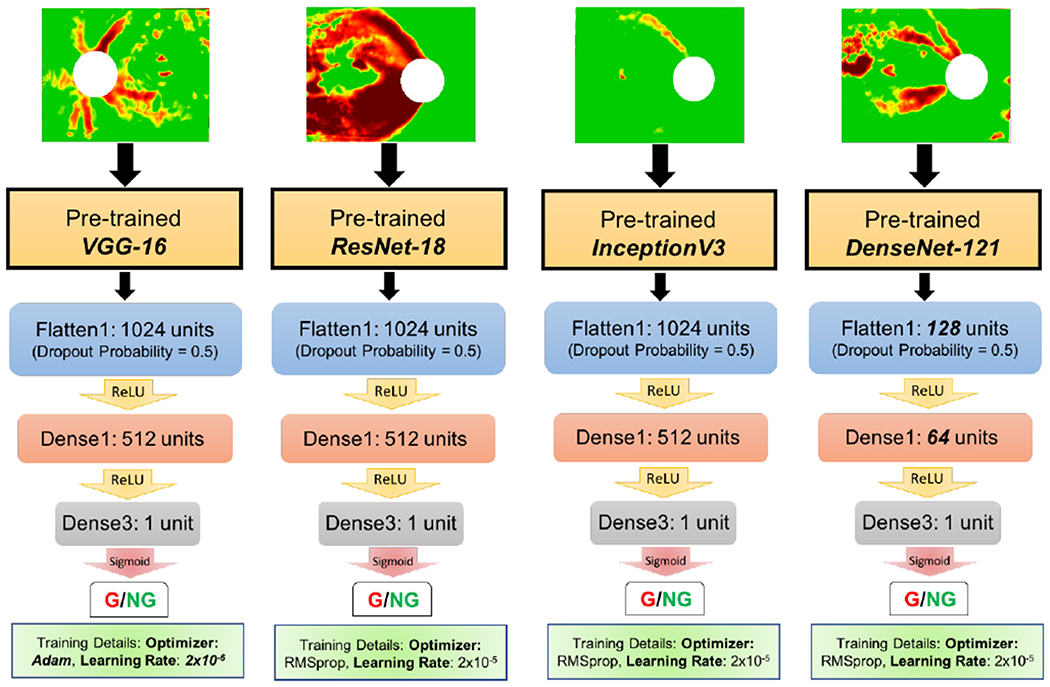
Schematic of four end-to-end deep learning models: convolutional pre-trained bases followed by fine-tuned transfer layers trained on OCT images (RNFL maps shown as input at top). Transfer layer parameters were optimized for each convolutional base (see GitHub [30] for code and IEEE Dataport [31] for saved models).
Given that past studies have demonstrated improved detection accuracy when deep learning ensembles are applied to ophthalmological data [33], [34], we developed a CNN ensemble architecture combining three of the end-to-end deep learning models described above (OCT-fine-tuned ResNet-18, VGG-16, and InceptionV3). We averaged the predictions from the final fine-tuned classifier layers for each model; these fine-tuned classifier layers (optimized for each model) were composed of a Flattening Layer followed by a dense layer with 1024 or 128 units and ReLU activation, another dense layer with 512 or 64 units and ReLU activation followed by 0.5 probability of unit dropout for regularization to prevent overfitting, and a final dense layer with 1 unit and sigmoid activation. A schematic of this CNN ensemble approach is shown in Fig. 5.
Fig. 5.
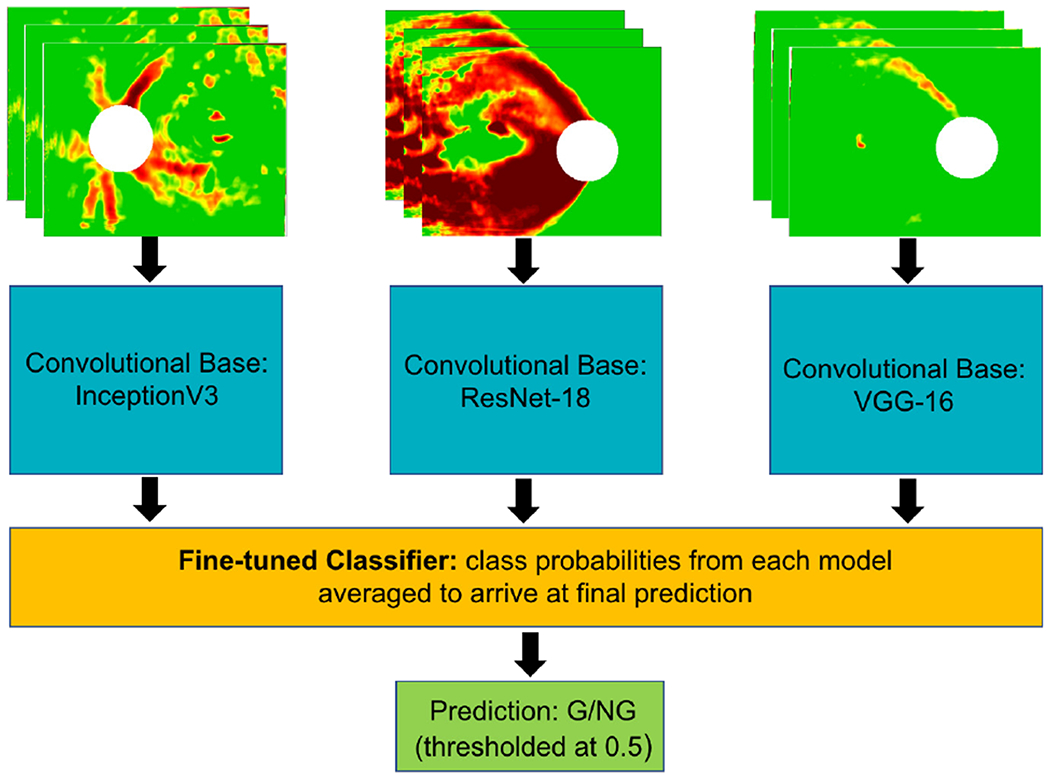
Schematic of CNN ensemble made up of three end-to-end deep learning models (each separately fine-tuned on RNFL maps, shown as input at top) followed by dense fine-tuned layers which predict if the input image is glaucomatous (G) or not glaucomatous (NG). Predictions were averaged to arrive at the final ensemble prediction between 0 and 1, with 0.5 serving as threshold probability for binary classification.
C. Quantifying the Importance of OCT Concepts that Enable Glaucoma Detection by CNNs
1). Motivating the Value of Concept Activation Vectors:
Beyond CNN class activation map approaches, which provide qualitative information about abstract regions in an image that contribute to a neural network’s classification, Testing with Concept Activation Vectors (TCAVs) [18] can be used to arrive at a quantitative score for the importance of a particular human-interpretable concept (i.e. capable of being located in an image by name) to a neural network’s classification for a given class of images. To illustrate the value of TCAVs, we first used Gradient Weighted Class Activation Maps (Grad-CAMs) [21] to visualize image regions that influence the model’s classification of a given image into a particular class. Grad-CAMs are created by applying a global average pooling operation across all pixels for all feature maps assigned to a given class generated by the last convolutional layer of a neural network. The gradient for the score yc for a given class c with respect to a given feature map A (indexed by k) at a given location (pixel i, j) is computed; this gradient is global average pooled across all pixels and normalized (by a constant Z) to arrive at a class weight for a feature map k for class c (as shown in (1) from [21]).
| (1) |
The rectified output of the linear combination of these weights across all feature maps for a given class (shown in (2) below from [21]) creates the final Grad-CAM heatmap L, in which certain regions of the image display higher intensity (increasing from dark blue to red) with increasing contribution to prediction of class c.
| (2) |
These highlighted image regions are more (positively) influential to the final model class prediction. Grad-CAMs of RNFL maps (and their corresponding original RNFL maps, superimposed with visual field locations) for a true positive and a false negative are shown in Fig. 6. Grad-CAMs give a qualitative sense for why a CNN may have made mistakes on particular input images, as these cases show how a correctly classified true positive (Fig. 6(a)) has many more abnormal regions (according to both the CNN and a human expert) than the missed case (Fig. 6(b)). However, such visual interpretability methods are not able to provide generalized quantitative information regarding human-describable concepts present across all images of a given class. The next section introduces such a global as well as quantitative interpretability method.
Fig. 6.
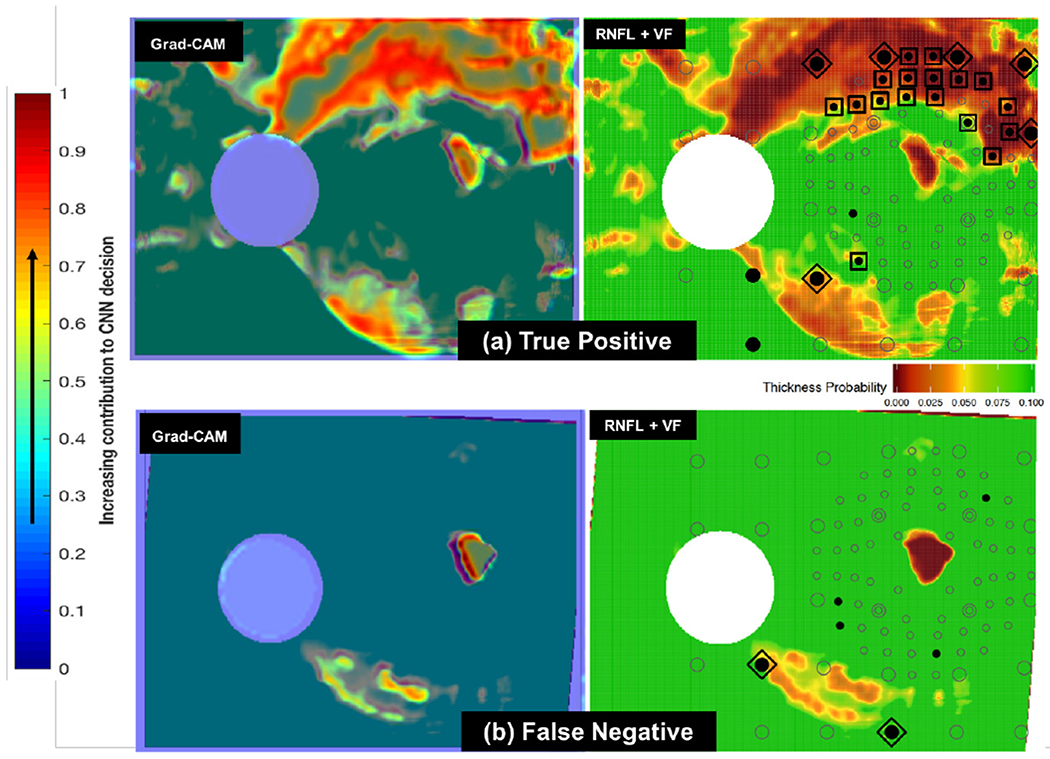
(a): Sample Grad-CAM (at left) for true positive RNFL+VF image (at right). In the RNFL+VF image at right, the open circles are visual field (VF) locations, specific points in the field of view used to test a patient’s functional vision. Filled circles are locations with abnormal visual function; those circumscribed by squares are inner-retina VF locations recognized by clinicians as abnormal both in RNFL and VF (indicative of disease). VF locations circumscribed by diamonds are abnormal outer-retina RNFL+VF locations [14]. Note that there is overlap between highlighted (red and yellow) regions chosen by the CNN as indicative of glaucoma (in Grad-CAM at left) [15] and those locations chosen as abnormal by clinicians (diamonds and squares in RNFL+VF image at right). (b): Sample Grad-CAM (at left) for false negative RNFL+VF image (at right). Note that this false negative (missed case) is challenging, as there are very few highlighted regions chosen both by the CNN as indicative of glaucoma (red/yellow in image at left) and by clinicians as abnormal (diamonds and squares in image at right).
2). Concept Activation Vectors to Probe Feature Importance in OCT Images:
In order to better understand the features (or ‘concepts’) used by the top-performing CNN to make classification decisions between glaucomatous and healthy images, we utilized Concept Activation Vectors (CAVs) [18]. In contrast to class activation maps (such as Grad-CAMs) or saliency maps, which generally determine the rate of change (gradient) of class predictions (h(x)) as a function of pixel intensity at specific pixel locations in x (where x is an image, and h is the class prediction), relevance of a ‘concept’ C to an image class (e.g. stripes for zebra images) is found by taking the directional derivative of class predictions (for class k) at each layer l of a CNN in the direction of (with respect to) a CAV. Concretely, a CAV is the vector that is perpendicular to the the linear classifier separating CNN activations (at a particular layer fl) of concept images from non-concept images. The directional derivative S in the direction of this CAV for concept C, class k, layer l, and layer-l activation fl(x) for input image x for a given CNN is defined as follows in (3) and (4) from [18]:
| (3) |
| (4) |
To obtain a quantitative score for the influence of concept C on class decision k (the conceptual sensitivity to C for class k across all inputs, Xk, in this class), we ‘Test with CAVs’ by computing a TCAV score as shown below in (5) from [18]:
| (5) |
The fraction of all input images Xk that have conceptual sensitivity to concept C (as quantified by the directional derivative SC,k,l being greater than zero) for a given class k and for activation of layer l defines the TCAV score (between 0 and 1) for that concept. After multiple CAVs are computed between concept images and random images, if a two-tailed, unpaired t-test of TCAV scores (for input images Xk) results in rejecting a null hypothesis TCAV score of 0.5 for a given concept, then that concept is considered significantly influential for classifying input images Xk into class k. TCAV authors further perform Bonferroni correction (p < α/m, m = 2) for multiple comparisons between all concept-random pairs to reduce potential for false positives (incorrect rejection of the null hypothesis, or a Type I error) to prevent mistaking as significant a truly insignificant concept [18].
To guide this TCAV study, a sample Grad-CAM of a full OCT report is shown in Fig. 7; this example qualitatively suggests the potential importance of concepts such as RNFL probability maps, RGCP probability maps, and RGCP thickness maps within the full OCT report for accurate glaucoma detection. It is worth emphasizing here that we chose full OCT reports as input for this interpretability analysis (including the blank spaces, text, and numerical information they contain) specifically because these reports are viewed exactly in this format by ophthalmologists. Therefore, we chose this format to enhance explainability of results for domain experts as well as to identify the most important report sub-images that enable accurate glaucoma detection. Based on this Grad-CAM evidence and the observed high performance of our CNN models on RNFL probability maps, we hypothesized that RNFL probability map images (concepts) would have the highest TCAV scores when input images were whole OCT reports. Similarly, we hypothesized that ‘arcuates’ (typically colorized as red in RNFL maps and characteristic of degenerate tissue) would have the highest TCAV scores given RNFL probability maps as inputs. We also predicted that red and green textured colors would be important for glaucoma detection from full OCT reports as well as from RNFL maps.
Fig. 7.
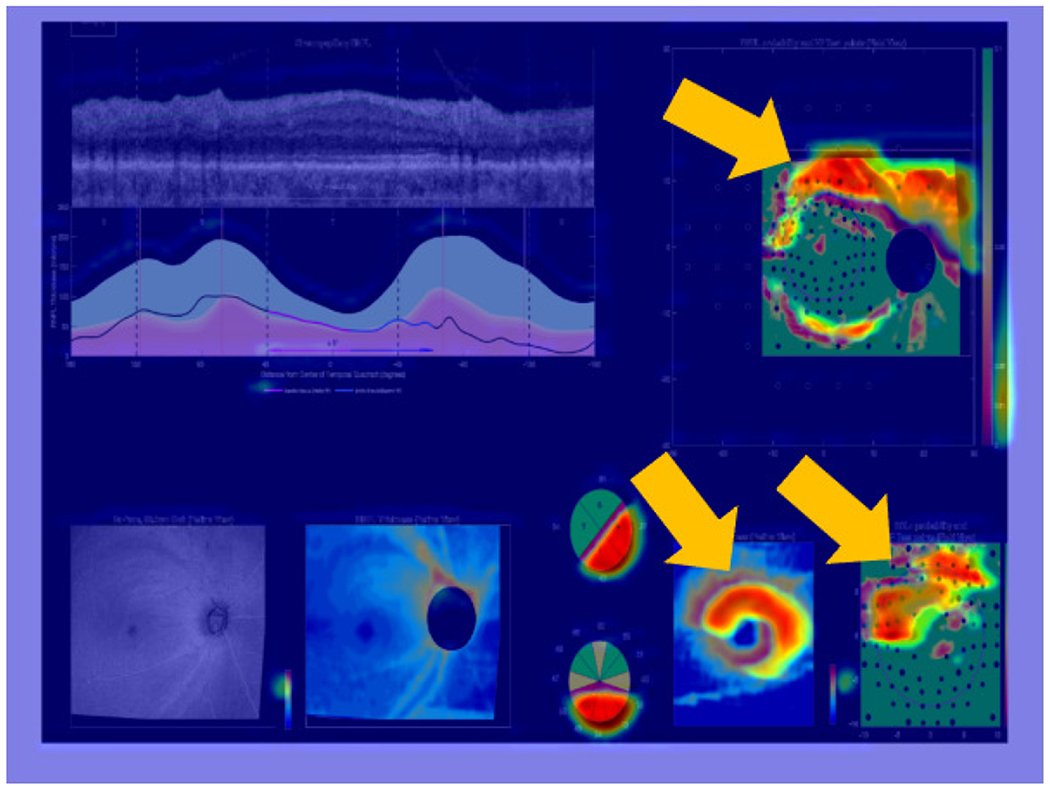
Grad-CAM overlayed on full OCT report, showing regions contributing most to CNN classification decision via warm (red/yellow) colors. These regions, on RNFL and RGCP probability maps as well as on the RGCP thickness map specifically, are also indicated with golden arrows for easy localization.
3). TCAV Experiments:
Concepts specific to OCT images were evaluated, such as red/green image color for RNFL probability map inputs and sub-images (RNFL and RGCP probability maps and thickness maps) for full OCT report inputs. Furthermore, specifically for RNFL maps as target images, arcuates alone as concepts were analyzed to quantify the importance of these red, ‘C’ or backward-‘C’ shaped patterns for accurate glaucoma detection (example of arcuate in Fig. 8). Note that the InceptionV3+FC model was trained separately on both RNFL images as well as on full OCT reports for the purposes of this TCAV analysis, in order to separately probe the importance of concepts present only in RNFL images (e.g. arcuates) as well as those present in full OCT reports (e.g. report sub-images). For each experiment, TCAV scores were computed within three layers (flatten1, dense1, and dense3); these comprise the shallowest (flatten1) to the deepest (dense3) of the fine-tuned transfer layers of the end-to-end deep learning models that were fine-tuned on OCT data. For each OCT concept, 160 random experiments were conducted (using Google Cloud resources: 4 virtual CPUs, 15 GB RAM, 1 NVIDIA K80 GPU) with image concepts unrelated to OCT data (see all random classes used on Github [30]).
Fig. 8.
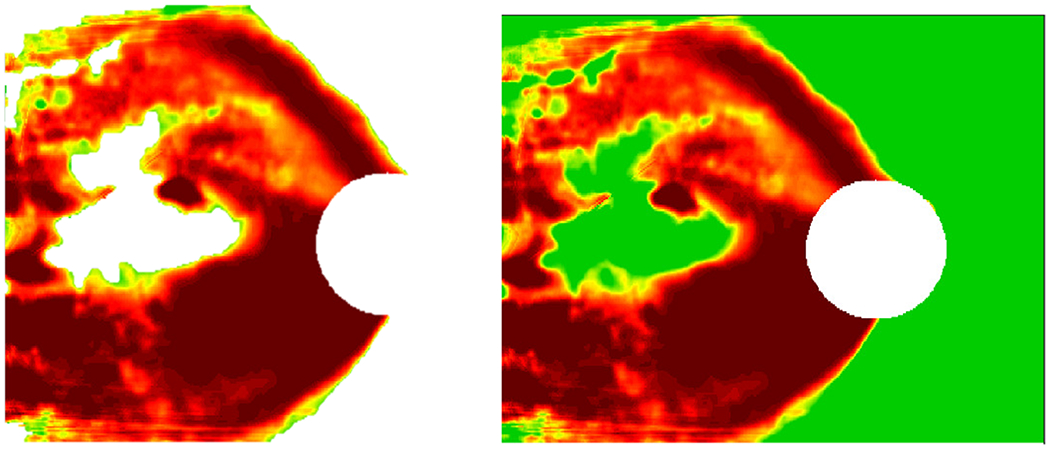
Example arcuate concept at left with its corresponding RNFL probability map at right.
D. Comparing TCAV Scores with Human Expert Eye Tracking
To validate OCT report concepts of importance for neural networks with OCT report concepts of importance for human experts, we compared concepts receiving high TCAV scores with concepts receiving the most eye fixations while tracking experts’ eye movements as they observed OCT reports. Eye tracking is employed in some medical disciplines to infer strategies used by clinicians in diagnostic decision-making to train medical students and residents [35], [36]. Specifically, fixation count (the number of times an expert’s eye fixates on a particular region of a 2D image, called an Area of Interest, AOI), can indicate salience of that region, high informational value, or difficulty involved in processing information in that region [35]; here, we used fixation count as an indicator of importance of a given AOI for final expert classification of a full OCT report as glaucomatous. We compared TCAV scores found in the previous section with eye fixation density for 2 glaucoma expert subjects with expertise in OCT image interpretation for glaucoma detection. Each expert was shown 8 glaucomatous OCT reports, and their eye movements were monitored using a Pupil Labs Core device [37], allowing them to move their heads freely while viewing OCT reports on a computer screen as they normally would in the clinic/lab. Fixation coordinates and durations were aggregated across the 2 subjects and across the 8 glaucomatous OCT reports shown to each subject. Eye fixation heatmaps superimposed on full OCT reports were generated by modifying existing plotting tools [38].
III. Results and Discussion
We present impact of CNN architectural improvements on ‘Field’ dataset performance, results of probing OCT report concepts using TCAV interpretability analysis, and comparison of high-scoring TCAV concepts with AOIs on which human experts fixated most in OCT reports.
A. Performance of Hybrid DL/ML Models
Performance accuracy is shown in the left half of Table 1 for all hybrid DL/ML models on the ‘Lab’ test set [13] as well as on the ‘Field’ test set (a training optimization study on the best of these models is described in more detail in Supplementary Materials and in [15], [16]). The fourth column of Table 1 shows the pronounced percent reduction in performance for each hybrid DL/ML model between the ‘Lab’ test set and the ‘Field’ test set.
TABLE 1.
Accuracy Rates (%) for Hybrid DL/ML Models (Left Half) and for End-to-End DL Models (Right Half). Percent Reduction from ‘Lab’ to ‘Field’ Test Sets Shown in Fourth Column and Eighth Column for Each Model Type, Respectively.
| Hybrid DL/ML Models | Lab | Field | % Reduction | End-to-End DL Models | Lab | Field | % Reduction |
|---|---|---|---|---|---|---|---|
| Conv+FC | 95.7 | 79.3 | 17.1 | DenseNet-121+FC | 95.9 | 85.2 | 11.2 |
| Conv+RF | 94.0 | 80.7 | 14.1 | CNN Ensemble | 94.4 | 88.9 | 5.83 |
| VGG-16+RF | 95.0 | 74.1 | 22.0 | VGG-16+FC | 97.0 | 85.2 | 12.2 |
| ResNet-18+RF | 94.8 | 80.7 | 14.9 | ResNet-18+FC | 94.9 | 83.0 | 12.5 |
| InceptionV3+RF | 94.2 | 69.6 | 26.1 | InceptionV3+FC | 90.4 | 91.1 | −0.774 |
B. Robust End-to-End Deep Learning Models and Robust CNN Ensemble
Our five deep learning models exhibited high performance, notably retaining robustness by achieving relatively high accuracy both for the ‘Field’ and ‘Lab’ test sets, as shown in Table 1 (right half). The last column of Table 1 shows percent reduction in accuracy from ‘Lab’ to ‘Field’ test sets for each end-to-end DL model. Although accuracies for the ‘Lab’ test set were comparable or slightly lower for some end-to-end DL models compared to those of their hybrid DL/ML counterparts, their consistent generalizability with higher accuracies on the ‘Field’ dataset suggests that they could be more usable in practice at different clinical sites. A Wilcoxon Rank Sum test conducted on the percent reductions between the ‘Lab’ and ‘Field’ datasets for the hybrid DL/ML models compared to those of the end-to-end DL models indicated a significant decrease in percent reductions for the end-to-end DL models (p = 0.0079). The robustness of the end-to-end DL models can be attributed to their combined feature extraction and classification; their fine-tuned classifier layers are also better-tailored to image data than the random forest classifiers of the hybrid DL/ML models [17]. Training optimizations such as data augmentation (described in detail in Supplementary Materials) also contributed to the improved performance of the end-to-end DL models. To ensure that enhanced performance of end-to-end DL models was not due only to use of data augmentation and cross-validation during training, we applied these same training optimizations to hybrid DL/ML models and found that end-to-end DL models still performed significantly better (with significantly lower percent reduction on the ‘Field’ dataset) than hybrid DL/ML models based on a Wilcoxon Rank Sum test (p = 0.0079). Table 2 in Supplementary Materials shows accuracy rates and percent reduction for both hybrid DL/ML models and end-end DL models after incorporating training optimizations for both model types.
It is also interesting to note that the CNN ensemble (second row, right half of Table 1) exhibited least percent reduction of all the models between ‘Lab’ and ‘Field’ test sets, second only to InceptionV3 + FC, which actually showed slightly higher accuracy on the ‘Field’ set than on the ‘Lab’ set. The CNN ensemble also exhibited higher accuracy on the ‘Field’ set than all of the hybrid DL/ML models; this ensemble architecture also provides a methodology by which to assess impact on performance of training and testing on multiple sub-image inputs (RNFL, RGCP, etc.) from the full OCT report, as each model within the ensemble could be trained on a separate sub-image before individual model predictions are averaged together. We used the definition of the Pareto Optimal Frontier [39] to choose the optimal model to evaluate further in this study; in this case, as shown in Fig. 9, InceptionV3 + FC, the CNN ensemble, and VGG-16 + FC exhibited accuracy at the frontier of optimal performance on both ‘Lab’ and ‘Field’ datasets. We chose InceptionV3 + FC for further TCAV interpretability analysis in this paper due to its exceptionally high performance on the ‘Field’ dataset compared to the other models. The high performance of InceptionV3 + FC can be attributed to its complexity; compared to the other end-to-end DL models studied here, it has the greatest number of operations per forward pass [28]. Such end-to-end deep learning models also enabled the streamlined implementation of the TCAV interpretability technique, described in the next section.
Fig. 9.
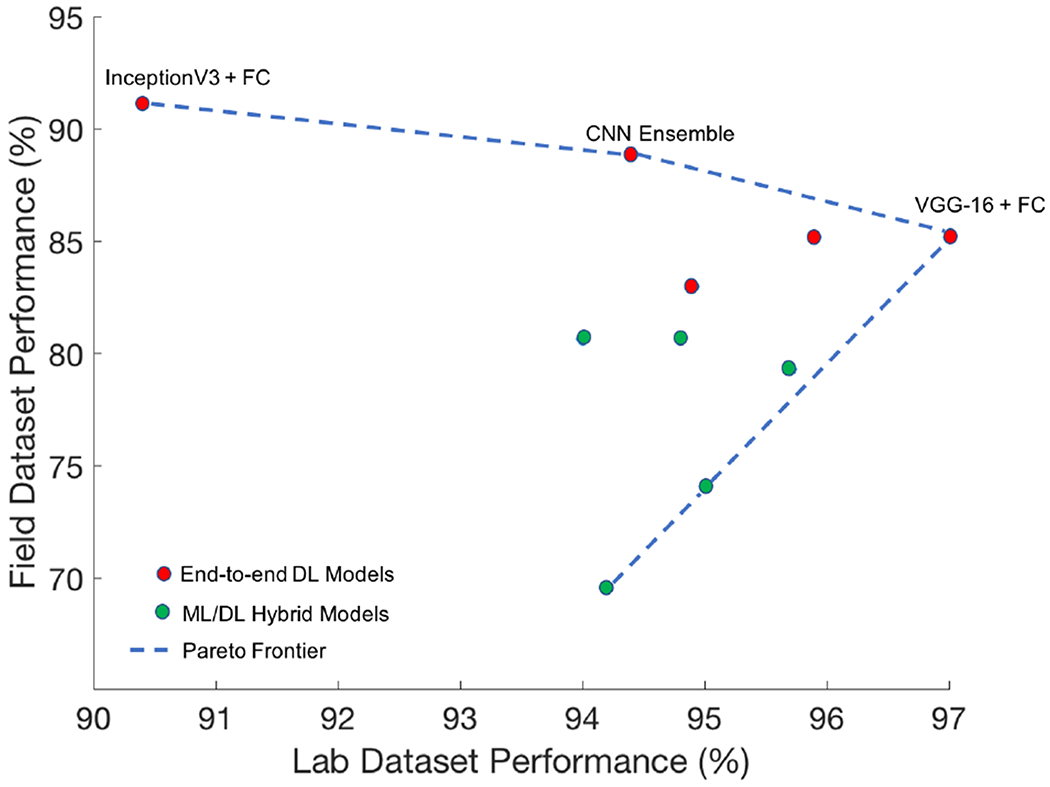
Hybrid DL/ML models (green) and end-to-end DL models (red) are shown in the above scatter plot based on their accuracy on both the ‘Field’ dataset (y-axis) and the ‘Lab’ dataset (x-axis). Top-performing end-to-end DL models fall on the Pareto Optimal Frontier [39]: InceptionV3 + FC, the CNN ensemble, and VGG-16 + FC.
C. TCAV Results and Observations
1). Important Color Concepts:
For full reports, consistent with our predictions, we found that red textured colors (characteristic of arcuates) and green textured colors were both significant for detection of glaucomatous full reports, with TCAV scores as high as 0.73 and 0.74 in the dense1 layer, while red and green solid colors were less important, with scores as low as 0.31 and 0 across multiple layers (histogram in Fig. 10(a)). Zero indicates the TCAV score for an OCT image concept was not significantly different from random concepts used for experimentation. Overall, green textured colors and red textured colors had higher TCAV scores in shallower layers (flatten1 and dense1). This is consistent with the notion that deep learning models learn low-level features such as color in shallower layers. Our CNN may be using information from the relatively more textured green and red colors present in RNFL and RGCP probability maps, in addition to interactions with other colors in OCT report sub-images, as part of its G vs. NG decision criteria.
Fig. 10.
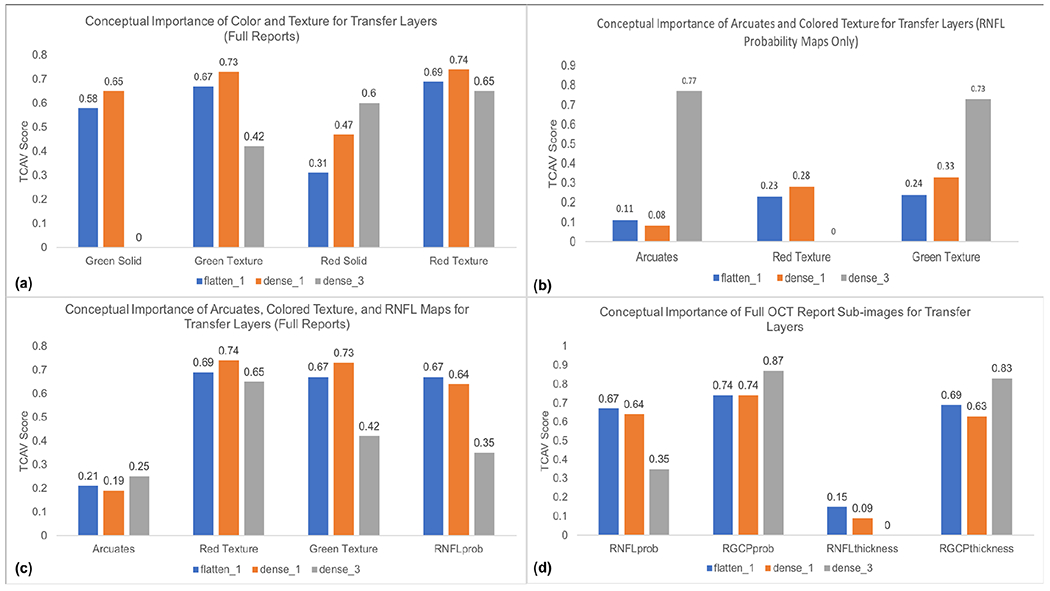
(a): TCAV plot (TCAV score vs. concepts of interest) for red and green solid and textured colors in full OCT reports; these scores indicate the importance of red and green textured colors over red and green solid colors for the CNN transfer layers (responsible for learning OCT image data). (b): TCAV plot showing importance of arcuates and green textured color for detecting glaucoma when input is only RNFL probability maps; this finding is consistent with the fact that clinicians also rely on arcuates to distinguish glaucomatous damage in RNFL maps. (c): TCAV plot for red and green textured colors, RNFL probability maps, and arcuates in full OCT reports; the higher scores for red and green textured colors and RNFL probability maps suggest that these concepts are more important than arcuates alone for detecting glaucoma when CNN inputs are full OCT reports. (d): TCAV plot for RNFL probability maps, RGCP probability maps, RNFL thickness maps, and RGCP thickness maps, the main sub-images of full OCT reports; these scores indicate that RNFL and RGCP probability maps as well as RGCP thickness maps are significant across all (shallow as well as deep) CNN transfer layers. Note that colors of transfer layers in histograms match colors of transfer layers in Fig. 4.
2). Importance of Arcuates:
Arcuates were statistically significant for detection of glaucomatous damage when inputs were RNFL probability maps, as can be seen by the high TCAV score for arcuate concepts compared to that of red texture and similar TCAV score compared to that of green texture (dense3, Fig. 10(b)). This parallels the observation that RNFL probability maps are composed prominently of arcuate features (characterized by red textured color) surrounded by healthy tissue (characterized by green textured color), consistent with the fact that clinicians also rely on arcuate features for glaucomatous damage detection from RNFL maps. In contrast, for full OCT reports, arcuate concepts have lower TCAV scores across all fine-tuned transfer layers than red and green textures and RNFL maps themselves (Fig. 10(c)), suggesting that these later three concepts carry more importance than arcuates for glaucoma detection when full OCT reports are inputted to our CNN. Arcuates have highest TCAV scores in the deepest layer (dense3), also consistent with the expectation that shapes are learned by CNNs in deeper layers.
3). Important Sub-images for OCT Full Reports:
RNFL and RGCP probability maps as well as RGCP thickness maps had relatively high TCAV scores across all fine-tuned transfer layers probed and thus appear to be important concepts for correct classification of glaucomatous full reports by the InceptionV3 + FC model studied here. In contrast, RNFL thickness maps received low TCAV scores across all three layers and thus appear to be less important for glaucoma classification by our CNN. These results are shown in the histogram in Fig. 10(d). The low TCAV scores for RNFL thickness maps across all three transfer layers (flatten1, dense1, and dense3) quantitatively confirms the qualitative result depicted by the Grad-CAM in Fig. 7: the RNFL probability map, RGCP probability map, and RGCP thickness map are highlighted significantly more than the RNFL thickness map. These TCAV scores differ from our original hypothesis, based on CNN performance on RNFL input images, that RNFL maps alone would have had highest conceptual importance for glaucoma classification by CNNs. In fact, this result suggests that a CNN ensemble taking as input specifically the three sub-images with highest TCAV scores may arrive at better performance than our previous experiments using RNFL probability maps alone as CNN input.
D. Comparison of Human Expert Eye Fixation Regions with High-Scoring CNN Concepts
Using eye tracking for 2 expert OCT readers viewing 8 OCT reports, we found that eye fixations on OCT-report AOIs are consistent with OCT-report CNN concepts receiving high TCAV scores; specifically, RNFL thickness maps acquired the fewest number of expert fixations, while RNFL probability maps, RGCP probability maps, and RGCP thickness maps aggregated a higher number of fixations. We can see this visually in the eye fixation heatmap superimposed on a full OCT report shown in Fig. 11. If we infer ‘importance’ of an AOI from expert fixation count, then this suggests the clinical importance of the same concepts that the deep learning model found to be important using TCAV scores as the metric. RNFL thickness maps received lowest TCAV scores across all layers probed, while RGCP thickness maps, RNFL probability maps, and RGCP probability maps received high TCAV scores. Fig. 12 shows fixation count values for the four OCT report TCAV concepts/eye tracking AOIs evaluated here and their corresponding TCAV scores. TCAV scores (between 0 and 1) were weighted (multiplied) by the maximum fixation count (845 for RNFL probability maps) in order to bring them into a comparable range with fixation counts.
Fig. 11.
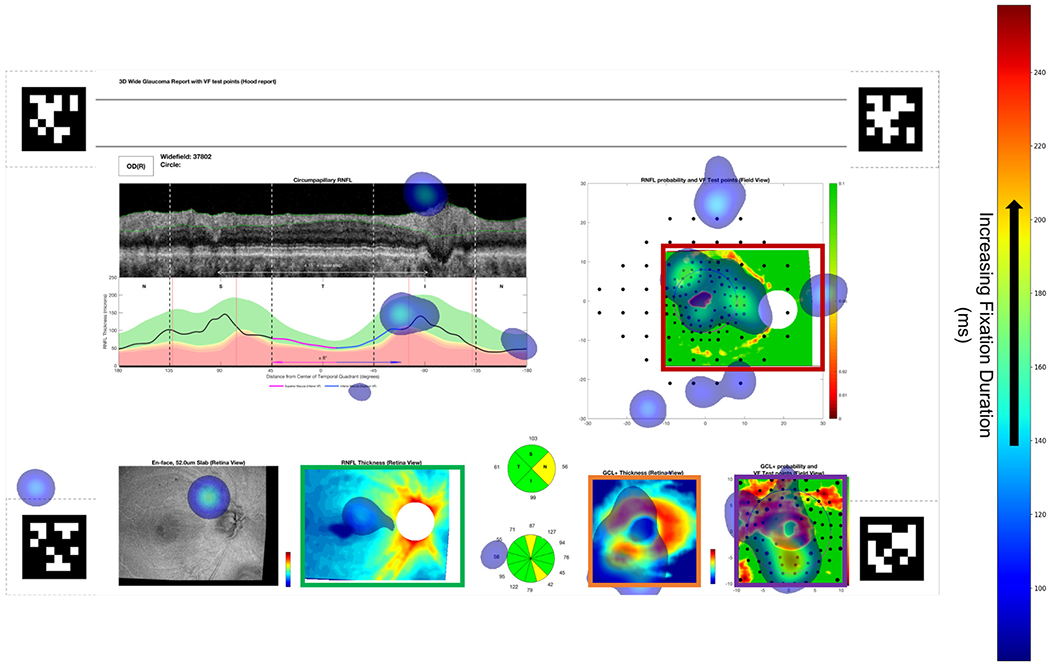
Heatmap of eye fixations for one subject (location and duration shown by transparent blue patches, legend at right) superimposed on full OCT report. Mean fixation duration was comparable across all four AOIs (bordered by red, violet, orange, and green boxes), but the magnitude of fixation counts in each AOI coincides closely with the magnitude of TCAV scores for each sub-image concept. April tags [37] shown in four corners were used to enable surface detection by the eye tracker.
Fig. 12.
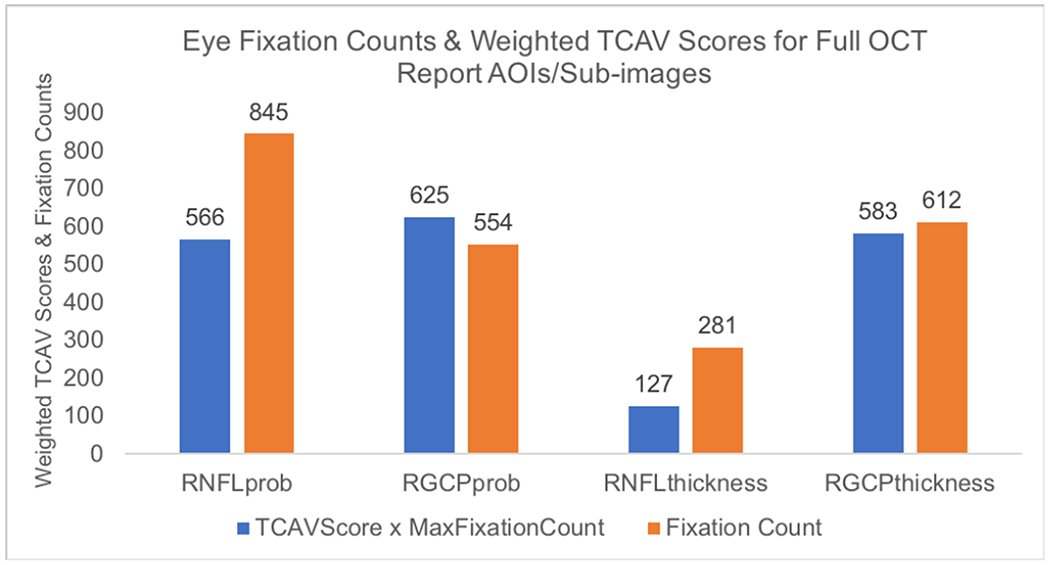
Histogram showing number of fixations aggregated across 2 experts and 8 OCT full reports and weighted TCAV scores (from Fig. 10(d), flatten1 layer) for the four AOIs studied here. Fixation count is higher for AOIs (concepts) that have higher TCAV scores and is lower for those with lower TCAV scores.
Here we report on eye tracking of 2 experts viewing 8 OCT reports (16 report-fixation samples). We acknowledge that our eye tracking results might vary as more subjects and/or more OCT reports are added. However, by conducting 160 random concept experiments, we have ensured the stability of our TCAV results. Fixations landing on non-AOI regions in this study could inspire future studies of other components of the report, such as the circumpapillary RNFL and thickness profile plots in the upper left of the report and the en-face image in the lower left of the report. This first attempt at quantifying important concepts/AOIs both for neural networks and for human eyes is a step in the direction of enhancing interpretability of ‘black-box’ deep learning tools with application in medicine. By understanding and correlating human expert eye-tracking with neural network mechanisms, we move in the direction of developing more ‘bio-inspired’ AI. Future neural networks trained using eye fixations of experts can increase accuracy and improve model explainability, transforming AI into a valuable team-mate to medical experts in the clinic.
E. Scope for Improving this Work and Role of Eye Tracking in AI for Medicine
Eye tracking has previously been studied in conjunction with visual saliency, revealing that experts exhibit characteristic scan and fixation patterns in task-relevant areas of images [40], [41]. While this relation is helpful in understanding how humans process visual information, it is difficult to determine direction of causality: areas of interest may be treated as important because experts view them, or experts may view certain areas because they contain underlying information that is critical to understanding the visual scene. Furthermore, past analyses have been unsuccessful at parsing concepts from areas of interest that correspond with greater fixation time. For example, patterns may be more important to a trainee radiologist than colors, but this may be hard to separate when they overlap in a region of interest [41]. Correlating concepts derived from neural network activations with expert viewing patterns allows parsing of human-friendly concepts rather than strictly areas of interest. In this study, we have shown the feasibility of applying this methodology within a small group of experts. We suggest future work toward studying eye tracking patterns of clinical experts to understand how concepts, rather than areas of interest, may be important for task performance. Furthermore, use of concept-agnostic interpretability methods inspired by TCAVs [42] but that do not limit to pre-specified concepts, may enable finding of previously-unknown patterns/user-friendly concepts that contribute to human as well as neural network disease detection. With a bigger population of readers, additional questions that can be probed include whether or not the model falls into the variability across readers. In other words, with more OCT experts, we can answer the question of whether the model’s TCAV scores will still be consistent with expert eye fixation counts in relevant OCT regions. Furthermore, if eye movements are collected from experts vs. novice readers, we can determine if TCAV results align more with expert or novice eye movements. Most importantly, this study encourages future work using eye movements to constrain or bias a CNN to only focus on those regions within the medical image that are most important according to experts, enhancing model accuracy and interpretability.
IV. Conclusions and Future Directions
In the face of anticipated reduction in accuracy, end-to-end deep learning architectures using pre-trained CNNs followed by fine-tuned transfer layers enabled enhanced robustness to a new dataset. In this study, InceptionV3 + FC exhibited robust performance on both ‘Lab’ and ‘Field’ datasets, and a CNN ensemble yielded least positive percent reduction in accuracy when generalizing to a new clinical test set, highlighting the value of combining multiple pre-trained CNNs to improve robustness to new datasets. Towards improving interpretability of deep learning models, TCAVs indicated that RNFL and RGCP probability maps as well as RGCP thickness maps are most critical for accurate glaucoma detection from full OCT reports by CNNs. This finding helps to guide improvement of deep learning models; a CNN ensemble designed based on these TCAV results (giving higher weight to OCT report sub-images with higher TCAV scores) may achieve higher accuracy than models trained on RNFL probability map input images alone. Evaluation of arcuate concepts for RNFL probability maps showed that, consistent with features used by glaucoma experts, arcuates are also used by CNNs to detect glaucoma from RNFL probability maps. Finally, corroboration of TCAV scores with human eye fixations showed similarity between concepts of importance to CNNs and AOIs of importance to humans. Employing TCAVs as a quantitative interpretability method has shown potential for establishing common decision-making features used by humans and machines. The end-to-end deep learning models developed here enabled streamlined interpretability assessment while enhancing robustness of glaucoma detection to a new dataset. Future work could incorporate datasets from varied geographical regions and images from other eye diseases beyond glaucoma. Together, the robust models and interpretability pipeline incorporating human eye movements introduced in this work have the potential to be translated to any domain where AI is applied to medical disease diagnosis from images.
Supplementary Material
Acknowledgments
The authors would like to thank Dr. Emmanouil Tsamis and Dr. Royce Chen for their eye tracking contributions and Dr. Tsamis and Dr. C. Gustavo De Moraes for help with obtaining data. Thanks to Dr. James McIntosh, Qian Zheng, and Desmond Yao for useful discussions and to Josh Gordon for pointers during model development and refinement. Special thanks to Been Kim for insights on implementing TCAVs for this unique medical application.
This work was supported in part by NIH under Grant R01-EY02115 awarded to D.C.H. and by the NSF Graduate Research Fellowship under Grant DGE-1644869 awarded to K.A.T.
Footnotes
This study (Protocol AAAA7160) was approved on May 26, 2020 by the Columbia University Institutional Review Board and adheres to the tenets set forth in the Declaration of Helsinki and the Health Insurance Portability and Accountability Act. Written informed consent was obtained from all subjects. The ‘Field’ dataset came from a clinical trial with ClinicalTrials.gov registration number: NCT02547740.
Contributor Information
Kaveri A. Thakoor, Department of Biomedical Engineering, Columbia University, New York, NY 10027, USA.
Sharath C. Koorathota, Department of Biomedical Engineering, Columbia University, New York, NY 10027, USA.
Donald C. Hood, Departments of Psychology and Ophthalmology, Columbia University, New York, NY 10027, USA
Paul Sajda, Departments of Biomedical Engineering, Electrical Engineering, and Radiology, Columbia University, New York, NY 10027, USA.
References
- [1].Sajda P, “Machine learning for detection and diagnosis of disease.”Annu Rev Biomed Eng, 8(1), pp. 537–565, 2006. [DOI] [PubMed] [Google Scholar]
- [2].Topol EJ, “High-performance medicine: the convergence of human and artificial intelligence.” Nature medicine, 25(1), pp.44–56, 2019. [DOI] [PubMed] [Google Scholar]
- [3].Das A, et al. “Distributed machine learning cloud teleophthalmology IoT for predicting AMD disease progression.” Future Generation Computer Systems. 93 (2019): pp.486–498. [Google Scholar]
- [4].Tham YC, et al. ‘Global prevalence of glaucoma and projections of glaucoma burden through 2040: a systematic review and meta-analysis.” Ophthalmology, 121(11), pp.2081–2090, 2014. [DOI] [PubMed] [Google Scholar]
- [5].Hood DC and De Moraes CG. “Challenges to the common clinical paradigm for diagnosis of glaucomatous damage with OCT and visual fields”, Investigative ophthalmology and visual science, 59, no. 2, 2018. [DOI] [PMC free article] [PubMed] [Google Scholar]
- [6].Kermany DS, et al. “Identifying medical diagnoses and treatable diseases by image-based deep learning” Cell, 172, no. 5, pp. 1122–1131, 2018. [DOI] [PubMed] [Google Scholar]
- [7].Abràmoff MD, et al. , “Pivotal trial of an autonomous AI-based diagnostic system for detection of diabetic retinopathy in primary care offices,” Digital Medicine, 1, 2018. [DOI] [PMC free article] [PubMed] [Google Scholar]
- [8].Gulshan V, et al. ,“Development and validation of a deep learning algorithm for detection of diabetic retinopathy in retinal fundus photographs.” JAMA, 316(22), pp.2402–2410, 2016. [DOI] [PubMed] [Google Scholar]
- [9].Lee CS, Baughman DM, and Lee AY, “Deep learning is effective for classifying normal versus age-related macular degeneration OCT images.” Ophthalmology Retina, 1(4), pp.322–327, 2017. [DOI] [PMC free article] [PubMed] [Google Scholar]
- [10].Phene S, et al. , “Deep Learning and Glaucoma Specialists: The Relative Importance of Optic Disc Features to Predict Glaucoma Referral in Fundus Photographs.” Ophthalmology, 126(12), pp.1627–1639, 2019. [DOI] [PubMed] [Google Scholar]
- [11].Alhadeff PA, et al. , “The association between clinical features seen on fundus photographs and glaucomatous damage detected on visual fields and optical coherence tomography scans.” Journal of Glaucoma, 26(5), p.498, 2017. [DOI] [PMC free article] [PubMed] [Google Scholar]
- [12].Beede E, et al. “A Human-Centered Evaluation of a Deep Learning System Deployed in Clinics for the Detection of Diabetic Retinopathy.” In Proceedings of the 2020 CHI Conference on Human Factors in Computing Systems, pp. 1–12, April 2020. [Google Scholar]
- [13].Thakoor KA, et al. “Enhancing the Accuracy of Glaucoma Detection from OCT Probability Maps using Convolutional Neural Networks”, In 41st Annual International Conference of the IEEE Engineering in Medicine and Biology Society (EMBC), pp. 2036–2040, 2019. [DOI] [PubMed] [Google Scholar]
- [14].Tsamis E, et al. “An Automated Method for Assessing Topographical Structure–Function Agreement in Abnormal Glaucomatous Regions.” Translational Vision Science and Technology, 9(4), pp.14–14, 2020. [DOI] [PMC free article] [PubMed] [Google Scholar]
- [15].Thakoor KA, et al. , “Impact of Reference Standard, Data Augmentation, and OCT Input on Glaucoma Detection Accuracy by CNNs on a New Test Set.” Investigative Ophthalmology and Visual Science, 61(7), pp.4540–4540, 2020. [Google Scholar]
- [16].Thakoor KA, et al. “Strategies to Improve Convolutional Neural Network Generalizability and Reference Standards for Glaucoma Detection from OCT Scans”, Under Review. [DOI] [PMC free article] [PubMed] [Google Scholar]
- [17].Moujahid A. “A Practical Introduction to Deep Learning with Caffe and Python”, http://adilmoujahid.com/posts/2016/06/introduction-deep-learning-python-caffe/, Published 26 June 2016.
- [18].Kim B, et al. “Interpretability beyond feature attribution: Quantitative testing with concept activation vectors (TCAV)”, International Conference on Machine Learning, 2018. pp. 2668–2677 [Google Scholar]
- [19].Maetschke S, et al. “A feature agnostic approach for glaucoma detection in OCT volumes.” PloS one, 14(7), 2019. [DOI] [PMC free article] [PubMed] [Google Scholar]
- [20].García G, Rocío del Amor AC, and Naranjo V.“Glaucoma Detection From Raw Circumapillary OCT Images Using Fully Convolutional Neural Networks.” arXiv preprint arXiv:2006.00027 (2020). [Google Scholar]
- [21].Selvaraju R, et al. “Grad-CAM: Visual explanations from deep networks via gradient-based localization”, International Conference on Computer Vision, 2017. [Google Scholar]
- [22].Chollet F, Deep Learning with Python. Manning Publications, 2018. [Google Scholar]
- [23].Szegedy C, et al. “Rethinking the Inception Architecture for Computer Vision.” In Proceedings of the IEEE Conference on Computer Vision and Pattern Recognition, pp. 2818–2826, 2016. [Google Scholar]
- [24].Deng J, et al. “Imagenet: A large-scale hierarchical image database.” IEEE Conference on Computer Vision and Pattern Recognition, pp. 248–255, 2009. [Google Scholar]
- [25].He K, et al. , “Deep residual learning for image recognition.” In Proceedings of the IEEE Conference on Computer Vision and Pattern Recognition, pp. 770–778, 2016. [Google Scholar]
- [26].Simonyan K and Zisserman A, “Very deep Convolutional Networks for Large-Scale Image Recognition.” International Conference on Learning Representations, 2015. pp. 1–14, arXiv preprint arXiv:1409.1556. [Google Scholar]
- [27].Huang G, et al. , “Densely connected convolutional networks.” In Proceedings of the IEEE Conference on Computer Vision and Pattern Recognition, pp. 4700–4708, 2017. [Google Scholar]
- [28].Bianco S, et al. , “Benchmark analysis of representative deep neural network architectures.” IEEE Access, 6, pp.64270–64277, 2018. [Google Scholar]
- [29].Too EC, et al. , “A comparative study of fine-tuning deep learning models for plant disease identification.” Computers and Electronics in Agriculture, 161, pp.272–279, 2019. [Google Scholar]
- [30].Thakoor KA and Koorathota S, “Robust and Interpretable CNNs for Glaucoma Detection from OCT Images”, (2020), GitHub repository, https://github.com/LIINC/TCAV4OCT.
- [31].Thakoor KA, et al. , “Robust and Interpretable Convolutional Neural Networks to Detect Glaucoma in Optical Coherence Tomography Images”, IEEE Dataport, 2020. [Online]. Available: 10.21227/qg30-1p45. [DOI] [PMC free article] [PubMed] [Google Scholar]
- [32].Ruder S, “An overview of gradient descent optimization algorithms.” arXiv preprint, arXiv:1609.04747, 2016. [Google Scholar]
- [33].Heisler M, et al. “Ensemble Deep Learning for Diabetic Retinopathy Detection Using Optical Coherence Tomography Angiography.” Translational Vision Science and Technology Special Issue on Artificial Intelligence, 9(2): 20, 2020. [DOI] [PMC free article] [PubMed] [Google Scholar]
- [34].Xie Y, et al. “Artificial intelligence for teleophthalmology-based diabetic retinopathy screening in a national programme: an economic analysis modelling study.” The Lancet Digital Health, 2020. [DOI] [PubMed] [Google Scholar]
- [35].Brunyé TT, et al. , “A review of eye tracking for understanding and improving diagnostic interpretation.” Cognitive research: principles and implications, 4(1), p.7, 2019. [DOI] [PMC free article] [PubMed] [Google Scholar]
- [36].Nodine CF, and Kundel HL, “Using eye movements to study visual search and to improve tumor detection.” Radiographics, 7(6), pp.1241–1250, 1987. [DOI] [PubMed] [Google Scholar]
- [37].“Pupil Labs: Pupil Core.” https://pupil-labs.com/products/core/, 2020.
- [38].Dalmaijer ES, Mathôt S, and Van der Stigchel S, “PyGaze: An open-source, cross-platform toolbox for minimal-effort programming of eyetracking experiments.” Behavior research methods, 46(4), pp.913–921, 2014. [DOI] [PubMed] [Google Scholar]
- [39].Costa NR and Lourenço JA.“Exploring Pareto Frontiers in the Response Surface Methodology.” In Transactions on Engineering Technologies, pp. 399–412. Springer, Dordrecht, 2015. [Google Scholar]
- [40].Lansdale M, Underwood G, and Davies C. “Something overlooked? How experts in change detection use visual saliency.” Applied Cognitive Psychology: The Official Journal of the Society for Applied Research in Memory and Cognition, 24, no. 2, pp. 213–225, 2010. [Google Scholar]
- [41].Lévêque L, et al. “State of the art: Eye-tracking studies in medical imaging.” IEEE Access, 6, pp. 37023–37034, 2018. [Google Scholar]
- [42].Ghorbani A, et al. “Towards automatic concept-based explanations.” In Advances in Neural Information Processing Systems, pp. 9277–9286, 2019. [Google Scholar]
Associated Data
This section collects any data citations, data availability statements, or supplementary materials included in this article.


