

Abstract
Objective
To characterize functional network changes related to conversion to cognitive impairment in a large sample of patients with multiple sclerosis (MS) over a period of 5 years.
Methods
Two hundred twenty-seven patients with MS and 59 healthy controls of the Amsterdam MS cohort underwent neuropsychological testing and resting-state fMRI at 2 time points (time interval 4.9 ± 0.9 years). At both baseline and follow-up, patients were categorized as cognitively preserved (CP; n = 123), mildly impaired (MCI; z < −1.5 on ≥2 cognitive tests, n = 32), or impaired (CI; z < −2 on ≥2 tests, n = 72), and longitudinal conversion between groups was determined. Network function was quantified with eigenvector centrality, a measure of regional network importance, which was computed for individual resting-state networks at both time points.
Results
Over time, 18.9% of patients converted to a worse phenotype; 22 of 123 patients who were CP (17.9%) converted from CP to MCI, 10 of 123 from CP to CI (8.1%), and 12 of 32 patients with MCI converted to CI (37.5%). At baseline, default-mode network (DMN) centrality was higher in CI individuals compared to controls (p = 0.05). Longitudinally, ventral attention network (VAN) importance increased in CP, driven by stable CP and CP-to-MCI converters (p < 0.05).
Conclusions
Of all patients, 19% worsened in their cognitive status over 5 years. Conversion from intact cognition to impairment is related to an initial disturbed functioning of the VAN, then shifting toward DMN dysfunction in CI. Because the VAN normally relays information to the DMN, these results could indicate that in MS normal processes crucial for maintaining overall network stability are progressively disrupted as patients clinically progress.
Cognitive impairment (CI) occurs in 40% to 70% of patients with multiple sclerosis (MS) and has severe consequences for daily life.1 Despite recent efforts to characterize the course of cognitive decline, it is still unknown which mechanisms constitute the conversion from preserved cognition to mild or severe CI and who is at risk, hampering the provision of adequate and timely care.2,3 While longitudinal studies remain scarce, gray matter (GM) and white matter (WM) damage is known to relate to cognitive decline. In addition, a major cause of these deficits is thought to reside within functional network dysfunction.2,4,5
Recent work has implicated the default-mode network (DMN) as one of the key networks of interest for cognition. Normally the DMN is suppressed during cognitive tasks. However, in CI-MS, the DMN is seemingly stuck in a hyperconnected state and cannot be suppressed sufficiently, possibly precluding cognitive networks to become engaged.6 One particular network that regulates the DMN is the ventral attention network (VAN), which functions as a switch between task-negative (e.g., DMN) and task-active (e.g., frontoparietal network [FPN] and dorsal attention network [DAN]) networks.7,8 The VAN consists of the anterior cingulate and insular cortices, which are among the regions most affected by cortical pathology in MS.9 It remains unclear, however, which part of this organization of the VAN, DAN, FPN, and DMN shows dysfunction during conversion to CI.
To better understand conversion to CI in MS, we measured longitudinal cognition in a large sample of patients with MS and characterized how this relates to longitudinal network changes.
Methods
Participants
All participants were part of the Amsterdam Multiple Sclerosis cohort.2,4,10 Previous work on this cohort has identified cross-sectional patterns of network dysfunction in patients with CI, but no study has yet described longitudinal network changes in relation to cognitive performance. Participants were included if both neuropsychological and neuroimaging data were available at the baseline and 5-year follow-up measurements, resulting in a total of 227 patients with MS (67.4% women, mean age 47.6 ± 11.0 years, mean disease duration 14.8 ± 8.5 years) and 59 healthy controls (HCs; 52.5% female, mean age 46.0 ± 9.9 years). At baseline, the MS group consisted of 177 patients with relapsing-remitting MS (RRMS), 18 with primary progressive MS, and 32 with secondary progressive MS. The mean time interval between baseline and follow-up visits was 5.4 ± 1.1 years for HCs and 4.8 ± 0.8 years for patients with MS. At follow-up, 22 patients with RRMS had converted to secondary progressive MS.
Standard Protocol Approvals, Registrations, and Patient Consents
The study protocol was approved by the institutional ethics review board of Amsterdam UMC (location VUmc), and all participants gave written informed consent before participation.
Neuropsychological Assessment
Extensive neuropsychological assessment was performed at both time points as described previously.10 In short, all participants underwent neuropsychological testing on the day of scanning with an expanded Brief Repeatable Battery of Neuropsychological tests. This test battery consisted of the following tests (and the domains usually associated with each test in previous work): the Selective Reminding Test (verbal memory), the Symbol Digit Modalities Test (SDMT; information processing speed), the Memory Comparison Test (working memory), the Stroop Color-Word test (attention), the Spatial Recall Test (SPART; visuospatial memory), the Word List Generation (verbal fluency), and the Concept Shifting Test (executive functioning). Regression-based analyses were used to correct test scores of all participants for normal effects of age, sex, and education as present in HCs.2 Cognitive scores of each test were converted to z scores based on means and SDs of the HCs in this study at each time point. Subsequently, patients were classified as CI (CI; at least 2 tests with Z ≤ −2), mildly CI (MCI; at least 2 tests with z ≤ −1.5 but not fulfilling CI criteria), and cognitively preserved (CP; not being CI or MCI). To deal with learning effects, all z scores were determined using the control sample at each respective time point only. Conversion to (mild) CI was defined as the change in cognitive phenotypes between the 2 visits. CP patients at baseline could convert to MCI (CP → MCI) or to CI (CP → CI) or remain preserved (CP → CP). Likewise, MCI and CI patients at baseline could convert to overt impairment (MCI-CI) or remain stable (MCI-MCI or CI-CI). Finally, reversion from (mild) impairment to no or less impairment (i.e., CI → MCI, CI → CP, MCI → CP) was also quantified.
Magnetic Resonance Imaging
MRI scanning was performed as reported previously.4 In short, at both time points, all participants were scanned on a 3T whole-body magnetic resonance system (GE Signa-HDxt, General Electric, Milwaukee, WI) using the same 8-channel phased-array head coil. Between both time points, a partial hardware update was installed (e.g., gradient system update), the effects of which were corrected for as described below. The sequences acquired included a high-resolution, 3-dimensional (3D) T1-weighted fast spoiled gradient-echo sequence for volumetric measurements (repetition time 8 milliseconds, echo time 3 milliseconds, inversion time 450 milliseconds, flip angle 12°, 1.0-mm sagittal slices, 0.9 × 0.9–mm in-plane resolution), a 3D T2-weighted fluid-attenuated inversion recovery sequence for WM lesion segmentation (repetition time 8,000 milliseconds, echo time 125 milliseconds, inversion time 2,350 milliseconds, 1.2-mm sagittal slices, 1.0 × 1.0–mm in-plane resolution), and finally a resting-state fMRI sequence for eigenvector centrality mapping (ECM; whole brain coverage, 202 volumes of which the first 2 were discarded, echo-planar imaging, repetition time 220 milliseconds, echo time 35 milliseconds, flip angle 20°, 3-mm contiguous axial slices, 3.3 × 3.3–mm in-plane resolution).
MRI Preprocessing
Following previously published methods,11,12 calculation of lesion volumes at each visit was done by automatic segmentation of WM lesions on the fluid-attenuated inversion recovery scans and subsequently by lesion filling on the 3D T1-weighted scans. For subsequent volumetric analyses, SIENAX and FIRST, both part of FSL5 (fsl.fmrib.ox.ac.uk), were used at both time points in combination with a correction for the effects of the MRI hardware update.13 With this method, brain volume, cortical GM volume, WM volume, and deep GM volume, all normalized for head size, were calculated. Resting-state fMRI scans were preprocessed with the MELODIC pipeline of FSL5 in combination with an independent component analysis–based approach for Automatic Removal of Motion Artifacts14 combined with the regression-based removal of WM and CSF signals. Then, boundary-based registration was used to automatically register fMRIs to lesion-filled, 3D T1-weighted images; finally, images were nonlinearly registered to Montreal Neurological Institute standard space.
Fast ECM Analysis
To assess network changes over time, we used fast ECM (github.com/amwink/bias/tree/master/matlab/fastECM), a measure of the relative functional importance for each voxel in the brain that was previously validated in MS.6 Eigenvector centrality provides a score for each voxel based on the strength of connections with other voxels and the importance of these other voxels themselves. To ensure a reliable signal for longitudinal ECM analysis, 2 participant-specific separate masks for GM and fMRI were constructed at each time point. The GM mask was based on a combination of SIENAX-based cortical GM segmentation and FIRST to exclude any WM voxels, and the fMRI mask excluded voxels with unreliable signal (e.g., in orbitofrontal cortex) on the basis of the robust range of signal intensity as described before.6 Both masks were then nonlinearly registered to standard space and multiplied for the entire population, forming 1 mask to ensure comparable node positioning for all participants. Masks were made for both time points and multiplied to ensure that all participants had GM voxels in this mask at both visits. Voxel-wise ECM was then performed within this mask, and eigenvector centrality scores were averaged over the different brain networks (i.e., visual, sensorimotor, ventral attention, dorsal attention, DMN, and FPN according to the Yeo atlas15), as well as the deep GM and cerebellum, for which FIRST segmentations and the Harvard Oxford–based mask of the cerebellum (part of FSL) were used. To minimize any residual effects of the scanner hardware update, network ECM values were finally converted to z scores that were based on the means and SDs of the HCs at each time point, similar to cognitive scores.
Functional Connectivity Analysis
Networks that showed significant effects in the ECM analysis were explored in more detail by looking at functional connectivity (FC) between these networks and our cognition-related networks of interest as described in the introduction (i.e., VAN, DMN, DAN, and FPN). We used the Brainnetome atlas16 to parcellate the brain into 210 cortical areas, which were nonlinearly registered to the participants' T1-weighted scans together with the Harvard Oxford-based cerebellum and the 14 FIRST-based deep GM regions, resulting in 225 regions. This atlas was multiplied by the aforementioned individualized GM mask and brought to fMRI space using boundary-based registration, and 33 regions with unreliable signal were excluded (mainly orbitofrontal and inferior temporal areas, as well as the nucleus accumbens). Next, time series were extracted and imported into Matlab R2018b (MathWorks, Natick, MA). For each individual, a connectivity matrix was constructed by calculating the Pearson correlation coefficients between all 192 regions, which were subsequently corrected for whole-brain connectivity (i.e., the average of all connections in the matrix). Next, similar to the ECM analysis, averaged FC scores were determined between each brain network. Finally, as with cognition and ECM, FC values were converted to z scores using the means and SDs of HCs at both time points.
Statistical Analysis
Demographic, clinical, and structural MRI measures were checked for normality with Kolmogorov-Smirnov tests and histogram inspection. These variables were subsequently compared between the HC, CP, MCI, and CI groups at baseline with 1-way analyses of variance (ANOVAs) for continuous measures (corrected for age, sex, and education) or χ2 tests for categorical data in IBM SPSS version 26 (Chicago, IL). To replicate previously found cross-sectional network differences between cognitive groups (i.e., HC, CP, MCI, and CI6), baseline ECM network values were assessed, and post hoc tests were performed between the CI and CP groups. Over time, ECM and FC values were analyzed with repeated-measures ANOVAs with group as a between-participant factor and time as a within-participant factor, corrected for age, sex, education, and time interval. Longitudinal network evolution was first assessed using group status at baseline (i.e., HC, CP, MCI, and CI) and repeated using the converter groups (e.g., CP converting to MCI) separately for the cognitively worsening and improving groups. Finally, in the total patient group, we correlated significant networks in the ECM analysis to performance on cognitive tests and the amount of structural damage using partial Pearson correlations (controlled for age, sex, and education and time interval in longitudinal analyses). Correlations, post hoc ANOVAs, or t tests were false discovery rate corrected to reduce type 1 errors. Values of p < 0.05 were considered statistically significant.
Data Availability
Anonymized data not published in the article can be shared on reasonable request from a qualified investigator.
Results
Clinical and Cognitive Data
For the HC, CP, MCI, and CI groups, demographic, clinical, and neuropsychological data at baseline are given in the table. At baseline, cognitive groups consisted of 123 CP (54.2%), 32 MCI (14.1%), and 72 CI (31.7%) patients. Zooming in on patients who showed impairment on only a single test showed that the SPART and Memory Comparison Test were most frequently affected. Overall, the MCI and CI participants were more frequently male and had a lower educational level, longer disease duration, and higher Expanded Disability Status Scale scores than CP patients. In addition, all brain volumes were lower and lesion volumes were higher in the cognitively affected groups. At follow-up, the distribution over the cognitive groups changed, resulting in a total of 104 CP (45.8%), 51 MCI (22.5%), and 72 CI (31.7%) patients. In total, 32 CP (26.0%) patients deteriorated and converted to MCI (n = 22) or to CI (n = 10). The exact numbers of patients with MS remaining stable or converting between cognitive phenotypes are presented in figure 1B. The 10 people who converted from CP to CI became impaired most frequently on 2 (n = 4) or 3 (n = 3) tests, but impairment also developed on 1 (n = 2) or 4 (n = 1) tests. The most frequently affected test was the Concept Shifting Test (n = 5), followed by the SDMT and the Stroop test (n = 4). The 11 people who converted from MCI to CI declined most frequently on 2 tests (n = 5) and on 1 and 3 tests (n = 3). One person declined on 6 tests. Performance declined most often on the SDMT (n = 8), followed by the SPART (n = 5). Several people improved and reverted from MCI to CP (n = 9), from CI to MCI (n = 18), or from CI to CP (n = 4).
Table.
Demographic, Clinical, and Structural MRI Data at Baseline for the HC and Cognitive MS Groups

Figure 1. Longitudinal Change in VAN Importance Is Related to Cognitive Conversion in MS.

(A) Delta ventral attention network (VAN) z scores (means and 95% confidence intervals) for each of the cognitive converter groups showing a significant increase in VAN importance over time in the cognitively preserved (CP)→CP and CP→mildly cognitively impaired (MCI) groups (false discovery rate corrected). (B) Sample size and reliable change index (RCI) for the average cognition score per converter group. (C) Lateral and top view of the VAN, projected onto a standard brain. CI = cognitively impaired; MS = multiple sclerosis.
Functional Network Centrality: Differences Between CP, MCI, and CI Patients at Baseline and Over Time
Despite the slightly smaller group due to including only longitudinal samples, our baseline results confirmed previously found network differences between cognitive groups (main effect of group F24,792.4 = 2.25, p = 0.001).6 Post hoc tests showed significant differences between CI and CP patients in the visual network (i.e., lower in CI than in CP, p = 0.013) and in the DMN (i.e., higher in CI than in CP, p = 0.05). In the total MS sample, large network deviations (i.e., z < −1.5 or z > 1.5) were observed most frequently in the visual and FPN networks (n = 42 and n = 36, respectively). Over time, a group × time interaction effect was noted in the VAN (F3,277 = 3.60, p = 0.014) and in the cerebellum (F3,277 = 2.81, p = 0.040). Post hoc tests demonstrated an opposite effect over time only in the CP patients: an increasing VAN centrality (p = 0.001) but decreasing cerebellum centrality (p < 0.001). None of the other groups defined at baseline showed significant changes in the VAN or cerebellum.
Post Hoc Explorations of FC Using Groups Defined at Baseline
Next, we further explored the VAN at baseline by calculating FC strength with the other a priori–defined networks of interest (DMN, FPN, and DAN), all of which showed group differences at baseline (F3,289 = 4.55, p = 0.004; F3,289 = 3.66, p = 0.013 and F3,289 = 2.99, p = 0.032, respectively) but not over time. At baseline, VAN-DMN and VAN-FPN connectivity was increased only in the CI group compared to the CP and HC groups (VAN-DMN: p = 0.032 and p = 0.018; VAN-FPN: p = 0.010 and p = 0.034, respectively), while VAN-DAN connectivity was only higher in the CI compared to the HC group (p = 0.026).
Centrality and Connectivity in Cognitively Converting CP Patients
Finally, because only the CP group showed a significant increase in VAN centrality over time, we investigated this change in more detail in the stable and converting CP groups (i.e., CP → CP, CP → MCI, and CP → CI). Moreover, we studied the FC of the VAN with the other a priori–defined networks. In patients who remained CP (CP → CP) and in those converting to MCI (CP → MCI), VAN centrality increased over time (p = 0.017 and p = 0.008, respectively), whereas no change was observed in the CP → CI group. Because thalamic volume is an important correlate of cognitive dysfunction in MS, we repeated this analysis with thalamic volume as a covariate, which did not affect the results. Longitudinal changes for all groups are shown in figure 1. No significant effects were observed in connectivity between the VAN and the other cognitive networks. Finally, no longitudinal changes were observed in the back-converters (i.e., MCI → CP, CI → MCI, and CI → CP) in any of the networks.
Partial Correlations With Cognition and Structural MRI
Next, baseline and longitudinal VAN importance was related to average cognition, all individual cognitive tests, and structural damage using partial correlations (controlling for age, sex, education, and time interval for longitudinal analyses). At baseline, a negative correlation was noted between average cognition and VAN importance in both the HC and MS groups (r = −0.33, p = 0.014; r = −0.14, p = 0.045, respectively), indicating that a lower VAN importance is related to a higher average cognition. In MS, a positive relationship was noted between delta VAN importance and average cognition at baseline (r = 0.18, p = 0.006, figure 2), indicating that higher average cognition at baseline correlated to a stronger increase in VAN importance over time. However, this could not be explored in HCs over time because all functional data were normalized on the basis of HC fluctuations, which sets mean HC ECM values to zero by definition. Subsequent correlations with individual cognitive tests at baseline in MS demonstrated a positive relationship only with the SPART (r = 0.15, p = 0.024). To further examine the relation between delta VAN and SPART performance, we compared patients with high delta VAN (i.e., z >1.5) to the HC group. The patients with high delta VAN (n = 29) showed a significantly worse deterioration of SPART performance (p = 0.042) and average cognition (p = 0.005) than HCs.
Figure 2. Positive Relationship Between Baseline Average Cognition and Longitudinal VAN Change in MS.
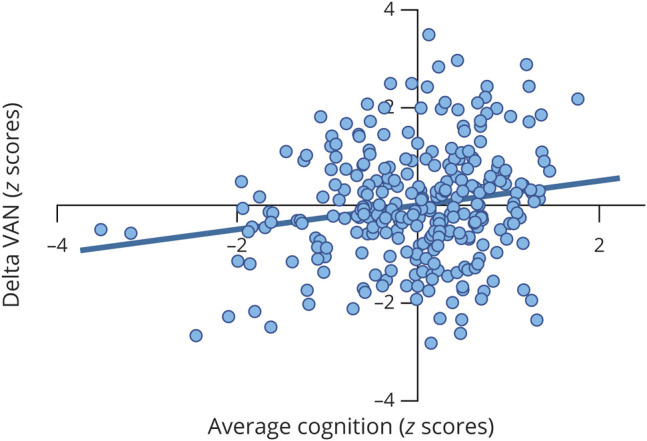
Residual scatterplot of average cognition at baseline (z scores) and change from baseline to follow-up in ventral attention network (VAN) centrality (delta, also z scores). Positive relationship indicates that individuals with higher average cognition at baseline generally showed a stronger increase in VAN importance over time. Partial correlation coefficient (r = 0.18, p = 0.006) was corrected for age, sex, education, and time interval between visits. MS = multiple sclerosis.
For structural damage, VAN change was positively related to deep GM volume at baseline (r = 0.15, p = 0.025), indicating that people with less severe structural damage at baseline showed stronger increases in VAN centrality over time.
Discussion
The current study showed that cognitive conversion (i.e., the shift between preserved cognitive status to mild or severe impairment) over a period of 5 years occurred in 18.9% of patients with MS and is related to VAN changes. The direction of this change depended on whether patients were already impaired to some degree. The CP group at baseline demonstrated an increase in VAN importance over time. When this was further disentangled in the converter groups, this increase was still present in the CP → CP and CP → MCI phenotypes but not in the CP → CI group. The MCI group (both MCI → MCI and MCI → CI) showed no significant change over time. At baseline, CI patients demonstrated higher importance of the DMN and higher FC of the VAN with both the DMN and the FPN. In the entire MS group, the change in VAN importance was positively related to average baseline cognition and deep GM volume. Finally, the correlations with individual cognitive tests showed that patients with larger increases in VAN importance over time had higher SPART scores at baseline but also faster decline over time.
The increased VAN importance in the converting CP patients may be the result of structural damage to WM tracts, which leads to a reduced diversity of structural connections over which information transfer can occur.17 As a result, flexibility in functional pathways goes down and the remaining patterns of activity will occur more frequently, leading to a more rigid functional backbone that becomes more important.17 The significant positive relationship between deep GM volume and longitudinal change in VAN importance is in line with this reasoning in that it indicates that patients with less structural damage will show a stronger increase in VAN importance. One longitudinal study in patients with clinically isolated syndrome (CIS) found a weakened relationship between structural and FC in the VAN in CP patients with CIS, also indicating that longitudinal VAN changes occur in CP patients with CIS, who often progress to developing MS.18 With more longstanding disease and progressive neurodegeneration, it has been suggested that the remaining functional highways are compromised as well, eventually culminating in an overall reduction of FC.17,19 This may explain the levels of VAN importance that were seen in the CI groups with more severe structural damage, in whom no increase or even a small decrease was observed (i.e., in the CI → CI group), although this did not survive false discovery rate correction. Future replication in longitudinal and modeling studies is warranted, but this theory offers an explanation for what appears to be an initial increase in VAN importance during early stages of cognitive conversion, followed by a decrease during more severe cognitive decline.
The ventral attention or salience network, the main components of which are the anterior cingulate cortex and the anterior insula, has a crucial function of regulating and providing input into networks involved in cognition such as the DMN, DAN, and FPN.20 Several studies have even suggested that the VAN functions as a switch between these networks and is crucial in directing the flow of information.7,8 This regulatory function arises from the sensitivity of the VAN for detecting salient environmental stimuli.21,22 To make the information about these stimuli accessible for subsequent (cognitive) processing, the VAN connects extensively with networks such as the DAN, DMN, and FPN.20 In MS, pathologic studies have shown that the insular and cingulate cortices are predilection sites for cortical pathology.9 This may result in abnormal VAN connectivity because cross-sectional studies have found increased FC between the VAN and FPN in RRMS23 and decreased dynamic FC in the VAN, which usually also indicates an increase in static FC.24 Our data add to this by showing increased FC between the VAN and FPN and between the VAN and DMN in CI patients, in addition to elevated DMN importance in CI. Increased importance signals a stronger connection to the hubs in the brain. This could indicate that the VAN is attempting to connect more to hub regions of the DMN and FPN and is inadequately trying to regulate these networks. Another possibility is that the increased communication of the VAN is dysfunctional and eventually leads to aberrations in connected networks. To pinpoint the specific effects of VAN dysfunction on individual cognitive tests, longitudinal VAN changes were related to cognitive decline. This analysis showed that VAN increases relate to decline in SPART function only, possibly because of the strong anatomic connections between the VAN and hippocampus.25-27 Memory deficits were common in our patients not classified as CI, possibly indicating an early involvement of memory deficits in MS, as has also been suggested previously.28
In our sample, almost 70% of CI patients at baseline remained CI and 19% of the entire sample showed cognitive worsening (i.e., CP → MCI, CP → CI, or MCI → CI), indicating that ≈1 in 5 patients with MS deteriorate cognitively over a span of 5 years. These results also suggest that the concept of cognitive conversion holds value for clinical application. In addition, at baseline, the 32% of patients who were CI were older, were more often male, and had more disability, confirming previous reports indicating that male patients with MS are more susceptible to a more aggressive disease course.29 However, before this concept of cognitive conversion can be applied beyond research, specific thresholds defining such conversion should be validated in other cohorts. Another point that follows from the overall cognitive stability in the sample is that it may explain why DMN importance did not show longitudinal changes: DMN dysfunction manifests when CI becomes more overt. The relative cognitive stability of our sample emphasizes the need for longitudinal cohort studies with even longer follow-up durations. This will likely also result in more clearly defined cognitive states in which fewer people revert back from more to less impaired states. In our sample, this may be explained by isolated cognitive relapses, which have been described in literature but are not well understood.30 The suggestion that VAN changes precede DMN dysfunction may also explain why in this study the VAN stood out in the longitudinal analysis, rather than the DMN. This early VAN increase was related to a decline in SPART performance, which could indicate an imminent network destabilization as the regulatory switch function of the VAN is increasingly put under pressure. In later stages, this network dysfunction seems to shift toward the DMN, where more severe CI becomes apparent. Other networks showing strong deviations (i.e., the visual and FPN networks) were not related to cognitive decline in our sample. The balance between the VAN and DMN is currently also under investigation in other neurologic disorders such as Alzheimer disease.31-33 A second explanation as to why the DMN did not appear in our longitudinal analysis is that here the voxel-wise ECM values were averaged over networks to test longitudinal differences in a priori–defined networks. In contrast, earlier work used a voxel-wise approach in which the posterior cingulate cortex showed significant effects that were assigned post hoc to the DMN. There are indications that in MS the anterior and posterior parts of the DMN show different functional behaviors; therefore, considering the DMN as 1 network might have obfuscated regional effects in this study.5 For future work, it would be highly interesting to investigate anterior and posterior (e.g., posterior cingulate cortex) DMN functioning over time, in addition to its connectivity with the VAN, which was outside the scope of the current study.
Several limitations apply to this work. First, we used a longitudinal approach to characterize the evolution of CI over 5 years only, and at the first measurement, our sample already had a mean disease duration of ≈15 years. The disease processes and network alterations that already occurred in the first decade of MS could therefore not be assessed, which warrants studies to investigate this important first phase of the disease. Second, an upgrade of scanner hardware occurred in between measurements, which could have influenced volumetric and functional measurements. However, our group developed a method to successfully account for volumetric differences as a result of the upgrade.13 In addition, we minimized upgrade effects on functional measures by expressing ECM and FC values as z scores compared to HC values at each time point, which is common practice in our and others’ analyses of cognitive and FC data.34 Third, although the initial sample was large, subgroups with converting phenotypes were substantially smaller, affecting statistical power to detect additional network changes. Future studies are encouraged in multicenter datasets also noting additional approaches to limit type 1 errors. In addition, the initial sample showed a significant difference in sex distribution between the HC and MS groups (i.e., fewer women in the HC group); thus, sex was always entered into the analyses as covariate. Finally, we adopted ECM as a measure of network importance, a robust and widely used method to define hub regions. Nonetheless, other metrics could offer complementary information, for instance, betweenness centrality, quantifies how many of the shortest paths flow through a network, which was not possible with the current approach.6,35-37
We showed that 1 in 5 patients with MS converts to (mild) CI over a period of 5 years and that this is related to an initial disturbed functioning of the VAN, which shifts toward DMN dysfunction as overt CI manifests. Therefore, our results could indicate that in MS normal processes crucial for maintaining overall network stability are progressively disrupted as patients clinically progress. This stresses the importance of future longitudinal studies in MS to confirm our hypothesis on the role of the VAN in early stages of clinical progression, as well as the DMN and other attention/executive networks in later stages.
Glossary
- ANOVA
analysis of variance
- CI
cognitive impairment
- CIS
clinically isolated syndrome
- CP
cognitively preserved
- DAN
dorsal attention network
- DMN
default-mode network
- ECM
eigenvector centrality mapping
- FC
functional connectivity
- FPM
frontoparietal network
- GM
gray matter
- HC
healthy control
- MCI
mild CI
- MS
multiple sclerosis
- RRMS
relapsing-remitting MS
- SDMT
Symbol Digit Modalities Test
- SPART
Spatial Recall Test
- 3D
3-dimensional
- VAN
ventral attention network
- WM
white matter
Appendix. Authors

Study Funding
This study was supported by the Dutch MS Research Foundation, grant 14-358e.
Disclosure
M. Huiskamp is supported by the Dutch MS Research Foundation, grant 16-954b. A.J.C. Eijlers is supported by the Dutch MS Research Foundation, grant 14-358e. T.A.A. Broeders and J. Pasteuning report no disclosures. I. Dekker has received speaking honoraria from Roche and is supported by the Dutch MS Research Foundation, grant 14-358e. B.M.J. Uitdehaag has received personal compensation for consulting from Biogen Idec, Genzyme, Merck Serono, Novartis, Roche, and TEVA. F. Barkhof is supported by the National Institute for Health Research biomedical research center at University College London Hospitals and reports grants and personal fees from Roche, Biogen Idec, Novartis, Merck Serono, TEVA, and IXICO, as well as grants and other support from Biogen Idec, Novartis, GE Healthcare, and Merck Serono. A.-M. Wink reports no disclosures. J.J.G. Geurts is an editor of Multiple Sclerosis; he serves on the editorial boards of Neurology and Frontiers of Neurology; and he is president of the Netherlands organization for health research and innovation. He has served as a consultant for Merck-Serono, Biogen, Novartis, Genzyme, and TEVA Pharmaceuticals. H.E. Hulst receives research support from the Dutch MS Research Foundation and serves as a consultant for Sanofi Genzyme, Merck BV, Biogen Idec, and Novartis. M.M. Schoonheim serves as an editorial board member of Frontiers in Neurology, received research support from the Dutch MS Research Foundation and Amsterdam Neuroscience, and has received consulting or speaking fees from ExceMed, Genzyme, Novartis, and Biogen. Go to Neurology.org/N for full disclosures.
References
- 1.Benedict RHB, Amato MP, DeLuca J, Geurts JJG. Cognitive impairment in multiple sclerosis: clinical management, MRI, and therapeutic avenues. Lancet Neurol. 2020;19(10):860-871. [DOI] [PMC free article] [PubMed] [Google Scholar]
- 2.Eijlers AJC, Van Geest Q, Dekker I, et al. Predicting cognitive decline in multiple sclerosis: a 5-year follow-up study. Brain. 2018;141(9):2605-2618. [DOI] [PubMed] [Google Scholar]
- 3.Kalb R, Beier M, Benedict RHB, et al. Recommendations for cognitive screening and management in multiple sclerosis care. Mult Scler J. 2018;24(13):1665-1680. [DOI] [PMC free article] [PubMed] [Google Scholar]
- 4.Meijer KA, Eijlers AJC, Douw L, et al. Increased connectivity of hub networks and cognitive impairment in multiple sclerosis. Neurology. 2017;30(22):2107-2114. [DOI] [PubMed] [Google Scholar]
- 5.Louapre C, Perlbarg V, García-Lorenzo D, et al. Brain networks disconnection in early multiple sclerosis cognitive deficits: an anatomofunctional study. Hum Brain Mapp. 2014;35(9):4706-4717. [DOI] [PMC free article] [PubMed] [Google Scholar]
- 6.Eijlers AJC, Meijer KA, Wassenaar TM, et al. Increased default-mode network centrality in cognitively impaired multiple sclerosis patients. Neurology. 2017;88(10):952-960. [DOI] [PubMed] [Google Scholar]
- 7.Gu S, Pasqualetti F, Cieslak M, et al. Controllability of structural brain networks. Nat Commun. 2015;6(1):8414. [DOI] [PMC free article] [PubMed] [Google Scholar]
- 8.Sridharan D, Levitin DJ, Menon V. A critical role for the right fronto-insular cortex in switching between central-executive and default-mode networks. Proc Natl Acad Sci USA. 2008;105(34):12569-12574. [DOI] [PMC free article] [PubMed] [Google Scholar]
- 9.Haider L, Zrzavy T, Hametner S, et al. The topography of demyelination and neurodegeneration in the multiple sclerosis brain. Brain. 2016;139(3):807-815. [DOI] [PMC free article] [PubMed] [Google Scholar]
- 10.Schoonheim MM, Hulst HE, Brandt RB, et al. Thalamus structure and function determine severity of cognitive impairment in multiple sclerosis. Neurology. 2015;84(8):776-783. [DOI] [PubMed] [Google Scholar]
- 11.Steenwijk MD, Pouwels PJ, Daams M, et al. Accurate white matter lesion segmentation by k nearest neighbor classification with tissue type priors (kNN-TTPs). Neuroimage Clin. 2013;3(1):462-469. [DOI] [PMC free article] [PubMed] [Google Scholar]
- 12.Chard DT, Jackson JS, Miller DH, Wheeler-Kingshott CAM. Reducing the impact of white matter lesions on automated measures of brain gray and white matter volumes. J Magn Reson Imaging. 2010;32(1):223-228. [DOI] [PubMed] [Google Scholar]
- 13.Eijlers AJC, Dekker I, Steenwijk MD, et al. Cortical atrophy accelerates as cognitive decline worsens in multiple sclerosis. Neurology. 2019;93(14):e1348-e1359. [DOI] [PubMed] [Google Scholar]
- 14.Pruim RHR, Mennes M, van Rooij D, Llera A, Buitelaar JK, Beckmann CF. ICA-AROMA: a robust ICA-based strategy for removing motion artifacts from fMRI data. Neuroimage. 2015;112:267-277. [DOI] [PubMed] [Google Scholar]
- 15.Yeo BT, Krienen FM, Sepulcre J, et al. The organization of the human cerebral cortex estimated by functional connectivity. J Neurophysiol. 2015;106(3):1125-65. [DOI] [PMC free article] [PubMed] [Google Scholar]
- 16.Fan L, Li H, Zhuo J, et al. The Human Brainnetome Atlas: a new brain atlas based on connectional architecture. Cereb Cortex. 2016;26(8):3508-3526. [DOI] [PMC free article] [PubMed] [Google Scholar]
- 17.Hawellek DJ, Hipp JF, Lewis CM, Corbetta M, Engel AK. Increased functional connectivity indicates the severity of cognitive impairment in multiple sclerosis. Proc Natl Acad Sci USA. 2011;108(47):19066-19071. [DOI] [PMC free article] [PubMed] [Google Scholar]
- 18.Koubiyr I, Besson P, Deloire M, et al. Dynamic modular-level alterations of structural-functional coupling in clinically isolated syndrome. Brain. 2019;142(11):3428-3439. [DOI] [PubMed] [Google Scholar]
- 19.Tewarie P, Steenwijk MD, Brookes MJ, et al. Explaining the heterogeneity of functional connectivity findings in multiple sclerosis: an empirically informed modeling study. Hum Brain Mapp. 2018;39(6):2541-2548. [DOI] [PMC free article] [PubMed] [Google Scholar]
- 20.Menon V, Uddin LQ. Saliency, switching, attention and control: a network model of insula function. Brain Struct Funct. 2010;214(5-6):655-667. [DOI] [PMC free article] [PubMed] [Google Scholar]
- 21.Corbetta M, Shulman GL. Control of goal-directed and stimulus-driven attention in the brain. Nat Rev Neurosci. 2002;3(3):201-215. [DOI] [PubMed] [Google Scholar]
- 22.Corbetta M, Patel G, Shulman GL. The reorienting system of the human brain: from environment to theory of mind. Neuron. 2008;58(3):306-324. [DOI] [PMC free article] [PubMed] [Google Scholar]
- 23.Rocca MA, Valsasina P, Martinelli V, et al. Large-scale neuronal network dysfunction in relapsing-remitting multiple sclerosis. Neurology. 2012;79(14):1449-1457. [DOI] [PubMed] [Google Scholar]
- 24.Huang M, Zhou F, Wu L, et al. White matter lesion loads associated with dynamic functional connectivity within attention network in patients with relapsing-remitting multiple sclerosis. J Clin Neurosci. 2019;65(12):59-65. [DOI] [PubMed] [Google Scholar]
- 25.Rocca MA, Barkhof F, De Luca J, et al. The hippocampus in multiple sclerosis. Lancet Neurol. 2018;17(10):918-926. [DOI] [PubMed] [Google Scholar]
- 26.Poppenk J, Evensmoen HR, Moscovitch M, Nadel L. Long-axis specialization of the human hippocampus. Trends Cogn Sci. 2013;17(5):230-240. [DOI] [PubMed] [Google Scholar]
- 27.Roosendaal SD, Hulst HE, Vrenken H, et al. Structural and functional hippocampal changes in multiple sclerosis patients with intact memory function. Radiology. 2010;255(2):595-604. [DOI] [PubMed] [Google Scholar]
- 28.Achiron A, Polliack M, Rao SM, et al. Cognitive patterns and progression in multiple sclerosis: construction and validation of percentile curves. J Neurol Neurosurg Psychiatry. 2005;76(5):744-749. [DOI] [PMC free article] [PubMed] [Google Scholar]
- 29.Thompson AJ, Baranzini SE, Geurts J, Hemmer B, Ciccarelli O. Multiple Sclerosis. Lancet 2018;391(10130):1622-1636. [DOI] [PubMed] [Google Scholar]
- 30.Pardini M, Uccelli A, Grafman J, Yaldizli Ö, Mancardi G, Roccatagliata L. Isolated cognitive relapses in multiple sclerosis. J Neurol Neurosurg Psychiatry 2014;85(9):1035-1037. [DOI] [PubMed] [Google Scholar]
- 31.Cai C, Huang C, Yang C, et al. Altered patterns of functional connectivity and causal connectivity in salience subnetwork of subjective cognitive decline and amnestic mild cognitive impairment. Front Neurosci. 2020;14(1):288. [DOI] [PMC free article] [PubMed] [Google Scholar]
- 32.Zhou J, Greicius MD, Gennatas ED, et al. Divergent network connectivity changes in behavioural variant frontotemporal dementia and Alzheimer’s disease. Brain. 2010;133(Pt 5):1352-1367. [DOI] [PMC free article] [PubMed] [Google Scholar]
- 33.Menon V. Large-scale brain networks and psychopathology: a unifying triple network model. Trends Cogn Sci. 2011;15(10):483-506. [DOI] [PubMed] [Google Scholar]
- 34.Benedict RHB, Cookfair D, Gavett R, et al. Validity of the Minimal Assessment of Cognitive Function in Multiple Sclerosis (MACFIMS). J Int Neuropsychol Soc. 2006;12(4):549-558. [DOI] [PubMed] [Google Scholar]
- 35.Wink AM. Eigenvector centrality dynamics from resting-state fMRI: gender and age differences in healthy subjects. Front Neurosci. 2019;13(1):648. [DOI] [PMC free article] [PubMed] [Google Scholar]
- 36.Binnewijzend MAA, Adriaanse SM, Van der Flier WM, et al. Brain network alterations in Alzheimer’s disease measured by eigenvector centrality in fMRI are related to cognition and CSF biomarkers. Hum Brain Mapp. 2014;35(5):2383-2393. [DOI] [PMC free article] [PubMed] [Google Scholar]
- 37.Wink AM, de Munck JC, Van Der Werf YD, Van Den Heuvel OA, Barkhof F. Fast eigenvector centrality mapping of voxel-wise connectivity in functional magnetic resonance imaging: implementation, validation, and interpretation. Brain Connect. 2012;2(5):265-274. [DOI] [PubMed] [Google Scholar]
Associated Data
This section collects any data citations, data availability statements, or supplementary materials included in this article.
Data Availability Statement
Anonymized data not published in the article can be shared on reasonable request from a qualified investigator.