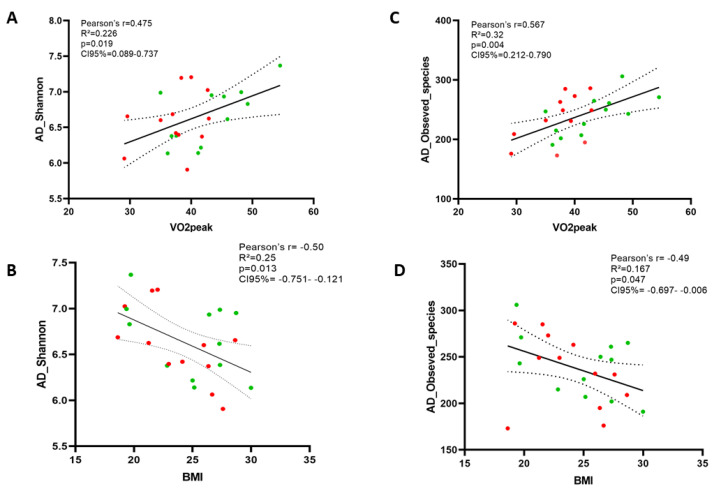
Figure 5.
Oxygen consumption (VO2peak) and Body Mass Index (BMI) were associated with gut bacteria richness. Figures (A) and (C) present associations with Shannon index and figures (B) and (D) show associations with Observed_species. Red points in the graph refer to control subjects while green points represent exercise subjects.

