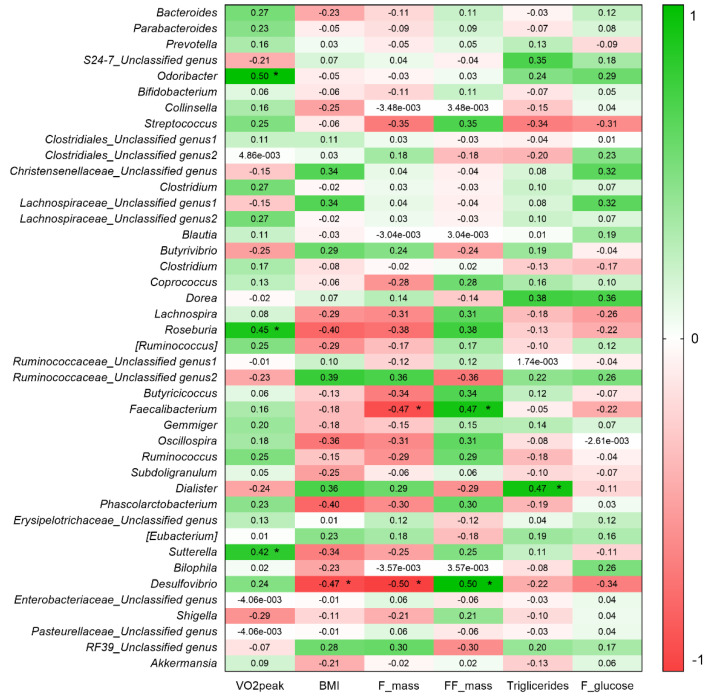
Figure 6.
Association between physiological variables and relative abundance of genera (%). Pearson’s R coefficient or Spearman’s partial correlation coefficient were plotted inside of each square in the above figure. The asterisk inside a square indicates significant association between the two variables (p < 0.05). Correlations were performed with post-intervention data.

