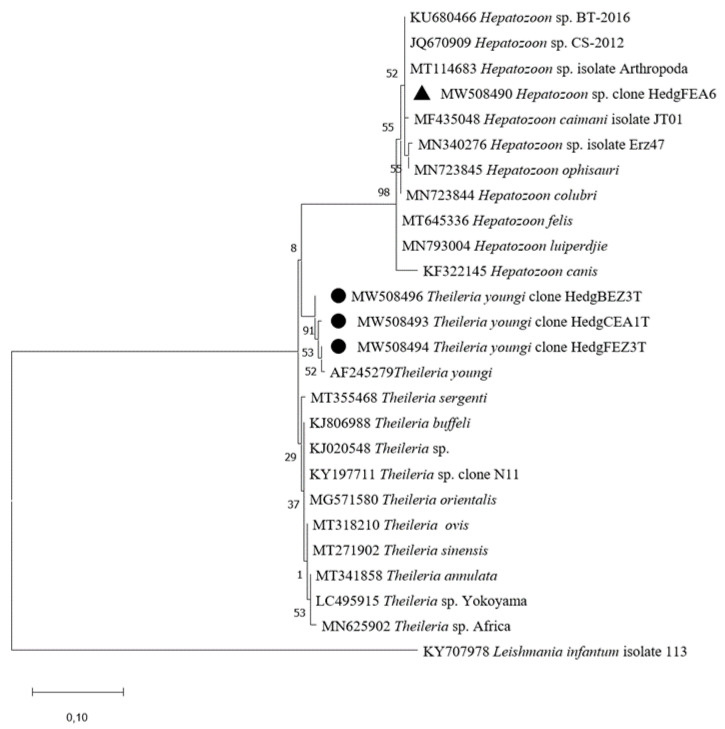
Figure 3.
Phylogenetic analysis of 18S rRNA sequences of Theileria spp. and Hepatozoon spp. Phylogenetic analysis of 18S rRNA sequences of Theileria spp. and Hepatozoon spp. using the Maximum Likelihood method based on the General Time Reversible model. In the phylogenetic tree, GenBank sequences, species designations and strain names are given. The sequences investigated in the present study is marked with a black circle (Theileria youngi) and black triangle (Hepatozoon sp.). The tree with the highest log likelihood (−561.93) is shown. The percentage of trees in which the associated taxa clustered together is shown next to the branches (bootstrap values). A discrete Gamma distribution was used to model evolutionary rate differences among sites (5 categories (+G, parameter = 2.0666)). The tree is drawn to scale, with branch lengths measured in the number of substitutions per site. This analysis involved 26 nucleotide sequences. All positions containing gaps and missing data were eliminated (complete deletion option). There were a total of 250 positions in the final dataset.

