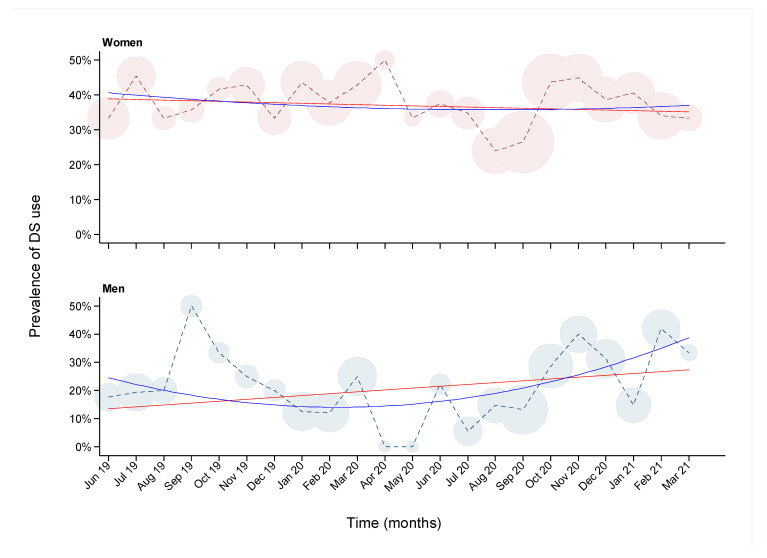
Figure 1.
Prevalence of dietary supplement (DS) use over time among 748 women (top panel) and 489 men (bottom panel) participants of the Epirus Health Study. The X-axis represents months from June 2019 to March 2021. The Y-axis represents the percentage of DS use. Circles are proportional to the sample size at each month. Regression analyses with linear (red line) and quadratic (blue line) terms for month of participation are overlayed on the graphs.

