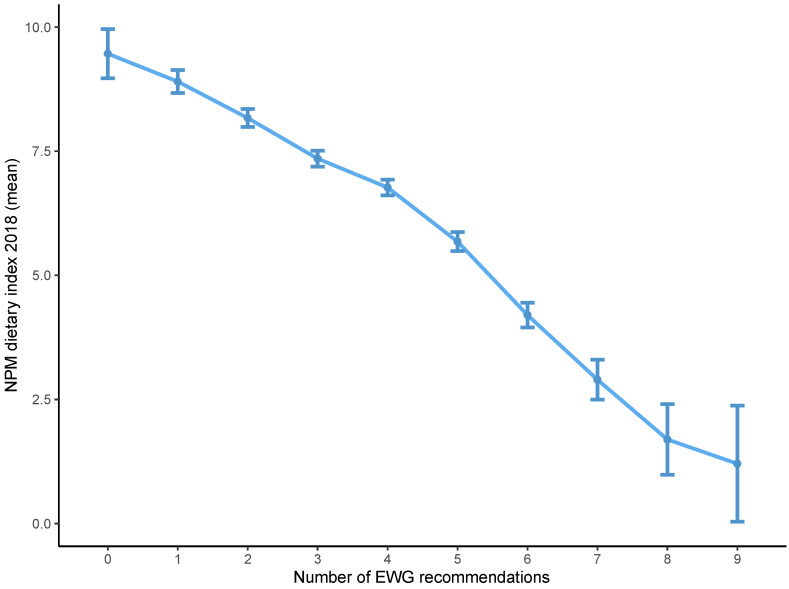
Figure 2.
Mean NPM dietary index 2018 according to the number of recommendations underpinning the EWG achieved by individuals. The NPM dietary index was calculated as the weighted average of NPM for all foods included in each individual’s diet. The EWG score was calculated as the total number of recommendations underpinning the EWG that were met by each individual’s diet. The mean of the NPM dietary index was plotted for all individuals achieving each level of the EWG score (0 to 9), with 95% confidence intervals. EWG, Eatwell Guide; NPM, nutrient profiling model.

