

Abstract
Objectives
T cells have an essential role in the antiviral defence. Public T‐cell receptor (TCR) clonotypes are expanded in a substantial proportion of COVID‐19 patients. We set out to exploit their potential use as read‐out for COVID‐19 T‐cell immune responses.
Methods
We searched for COVID‐19‐associated T‐cell clones with public TCRs, as defined by identical complementarity‐determining region 3 (CDR3) beta chain amino acid sequence that can be reproducibly detected in the blood of COVID‐19 patients. Of the different clonotype identification algorithms used in this study, deep sequencing of brain tissue of five patients with fatal COVID‐19 delivered 68 TCR clonotypes with superior representation across 140 immune repertoires of unrelated COVID‐19 patients.
Results
Mining of immune repertoires from subjects not previously exposed to the virus showed that these clonotypes can be found in almost 20% of pre‐pandemic immune repertoires of healthy subjects, with lower representation in repertoires from risk groups like individuals above the age of 60 years or patients with cancer.
Conclusion
Together, our data show that at least a proportion of the SARS‐CoV‐2 T‐cell response is mediated by public TCRs that are present in repertoires of unexposed individuals. The lower representation of these clones in repertoires of risk groups or failure to expand such clones may contribute to more unfavorable clinical COVID‐19 courses.
Keywords: COVID‐19, public T‐cell receptors, risk cohort, T‐cell repertoire
Simnica et al. report on public T‐cell receptors in immune responses to SARS‐CoV‐2, which are shared between patients and non‐exposed individuals. Their lower prevalence in older age and cancer could imply why these risk groups may experience more severe COVID‐19 courses.

Introduction
A betacoronavirus – termed severe acute respiratory syndrome coronavirus 2 (SARS‐CoV‐2) by the World Health Organization – has spread across the world in a pandemic that represents a serious public health concern.1, 2 COVID‐19, the illness caused by this new coronavirus, has been recognised as a respiratory disease which, however, can affect multiple organs if early viral clearance cannot be achieved.3, 4 Adaptive immunity is crucial for viral clearance and is therefore under intensive investigation in COVID‐19.5 The major goals are to understand susceptibility to the virus and immunological determinants of disease severity or fatal outcome. Many of the early studies on the immune response to SARS‐CoV‐2 have focused on neutralising antibodies. Yet, a growing body of evidence suggests a pivotal role for T cells in viral clearance and in the generation of immunological memory in COVID‐19.6, 7, 8 A few studies have shown that SARS‐CoV‐2‐specific T cells exist in pre‐pandemic T‐cell repertoires,6, 9, 10, 11, 12, 13, 14 but it remains essentially unclear whether the presence of pre‐existing T cells may explain why some patients remain asymptomatic while others experience severe or even fatal disease courses. Current research suggests that pre‐existing T cells may be (at least partially) induced by other ‘common cold’ coronaviruses.9, 10, 13 Assuming that these cells have a protective role in COVID‐19, this may explain why children and young adults, a part of the population that has more frequent social contacts and therefore potentially higher exposures to other coronaviruses – for example through day care, school and work – experience milder SARS‐CoV‐2 infections. Yet, we have to acknowledge that our understanding of the role of individual T‐cell clonotypes – be it newly generated or selected from the pre‐existing repertoire – in the potential modulation of COVID‐19 severity remains very limited at this point.
Here, we identified a set of public TCR clonotypes that are expanded in a substantial proportion of COVID‐19 patients and are of potential use as read‐out for COVID‐19 T‐cell immune responses. Moreover, we assessed their representation in pre‐pandemic cohorts with different risk profiles. Using a specific clonotype identification algorithm relying on brain‐derived TCRs from patients with fatal COVID‐19, we show that public TCRs – that can also be detected in non‐exposed individuals – are involved in the immune response to this virus. Their lower prevalence in older age and cancer could imply why these risk groups may experience more severe COVID‐19 courses.
Results
Identification of a COVID‐19‐associated public TCR sequence set derived from brains of COVID‐19 patients
Early in the COVID‐19 pandemic, several groups have identified T‐cell subsets recognising SARS‐CoV‐2 epitopes using different TCR peptide affinity measures.9, 10, 13, 14 However, only few also generated corresponding TCR sequence data7, 11, 12, 15 and a global COVID‐19‐associated repertoire has not been defined. To test whether published clonotypes are a shared feature across larger groups of COVID‐19 patients, we used the TCR sequence information of 1267 T cells predominantly reactive to the SARS‐CoV‐2 spike (S) glycoprotein7, 11, 12, 15 (partially downloaded from vdjdb16 and McPas‐TCR database17) to search for their representation in the peripheral immune repertoires of unrelated COVID‐19 patients as well as healthy individuals. We used these 1267 TCR sequences to mine our COVID‐19 immune repertoire repository for exact complementarity‐determining region 3 (CDR3) beta amino acid sequence matches.18 For this analysis, 140 immune repertoires from unrelated COVID‐19 patients as well as 140 pre‐pandemic age‐matched control immune repertoires were retrieved. We found at least one SARS‐CoV‐2‐specific TCR per repertoire (one hit) in 89% of the infected and in 78% of the non‐exposed repertoires (Figure 1a). These data point to a shared S‐directed T‐cell response between infected individuals that at least partially relies on public TCRs with exact CDR3 identity and confirms, on the repertoire level, previous studies that reported the presence of S‐specific CD4+ clones in the blood of 30–80% of non‐exposed individuals.8, 9, 13 Yet, the rather small delta between unexposed and infected individuals was noteworthy and might relate to the observation that, compared to other coronaviruses, SARS‐CoV‐2 immunodominance is less restricted to the S protein.9 Thus, we searched for alternative ways to get hold of SARS‐CoV‐2‐associated T‐cell clonotypes that distinguish infected from uninfected individuals with higher specificity on the repertoire level.
Figure 1.

Identification of potentially SARS‐CoV‐2‐specific TCRs from bulk sequencing. Percentage of repertoires of patients with COVID‐19 or pre‐pandemic repertoires of healthy individuals, n = 140, respectively, with at least one sequence hit. Search sets of TCR sequences were either derived from (a) published SARS‐CoV‐2 reactive T cells7, 11, 12, 15 or (b) brain tissues (n = 68). (c) Bubble plots showing the number of brain‐derived TCR sequence hits per repertoire for healthy individuals and patients with COVID‐19 (n = 140, respectively). One bubble represents one patient repertoire with the area size of the bubble corresponding to the repertoire size. (d) Mean number (+ SEM) of brain‐derived TCR sequence hits per repertoire. Statistical test: two‐sided unpaired t‐test. (e) Percentage of repertoires from patients with COVID‐19 with at least one sequence hit at active disease (ICU, n = 57 reps, non‐ICU, n = 15 reps) or after recovery (n = 68 reps).
The brain is an organ with physiologically scarce T‐cell infiltration.19 Moreover, previous studies suggest that this organ is affected in the majority of COVID‐19 patients.20, 21, 22 Many patients with mild disease report ageusia and anosmia as one of the most specific symptoms.23 In addition, the virus – and, interestingly, infiltration with cytotoxic T cells – has been detected in the brain of the majority of patients with fatal courses.21, 22 We, therefore, reasoned that NGS‐detectable T cells from brain tissue of patients with fatal COVID‐19 may harbour T‐cell clonotypes with high specificity for SARS‐CoV‐2 epitopes. Of 40 brain tissue sections (all major brain parts including the olfactory bulb) from five deceased patients, 30 resulted positive for TRB amplicons. A total of 68 clones could be identified (Table 1). As shown in Figure 1b and c, 40% of the independent COVID‐19 repertoires encompassed at least one of the brain‐derived clonotypes, while this was the case in only 17% of the pre‐pandemic age‐matched repertoire controls. The degree of sharedness of these clonotypes per se points towards their public nature. We next wished to rule out that the higher frequency of brain‐derived clonotypes found in the repertoires of infected individuals was an unspecific consequence of varying repertoire metrics between the COVID‐19 and the pre‐pandemic control samples. To this end, we retrieved 100x random sets of 68 clonotypes from peripheral blood of healthy individuals and previously published liver biopsies from patients with autoimmune hepatitis,24 respectively. We searched these in the 140 COVID‐19 or pre‐pandemic repertoires. On average, 20% of all repertoires resulted in a hit when queried with sets of blood‐derived sequences and close to 0% of repertoires harboured any of the autoimmune‐related clonotypes (Supplementary figure 2). As opposed to the COVID‐19 brain‐derived clonotypes, there was no differential enrichment of the blood‐derived clonotypes in COVID‐19 repertoires (P = 0.1338). Moreover, we normalised all mined repertoires to a similar read depth of 30 000 reads on average and found a similar distribution of brain clone hits (Supplementary figure 3). These findings argue in favor of the SARS‐CoV‐2 specificity of the brain‐derived clones.
Table 1.
T‐cell clones derived from brain tissue
| CDR3 amino acid sequence | TRBV gene | TRBD gene | TRBJ gene | CDR3 length | Detected only in COVID‐19 repertoires |
|---|---|---|---|---|---|
| CASRDRVNEQFF | 6‐3 | 1 | 2‐1 | 36 | Yes |
| CASSLVGNGYTF | 12‐3 | 1‐2 | 36 | No | |
| CASSSAGVGANEQFF | 6‐2 | 2 | 2‐1 | 45 | No |
| CAARRGSNYEQYF | 6‐1 | 2‐7 | 39 | No | |
| CASSIVMAGTAYNEQFF | 19 | 1 | 2‐1 | 51 | No |
| CSALGQGAEGDTQYF | 20‐1 | 1 | 2‐3 | 45 | No |
| CASSPTGGFQPQHF | 6‐5 | 1 | 1‐5 | 42 | No |
| CASSDQTSGIETQYF | 6‐3 | 2 | 2‐5 | 45 | No |
| CASGGSGNTIYF | 19 | 1‐3 | 36 | No | |
| CASSGSEELFF | 18 | 2 | 1‐4 | 33 | Yes |
| CARSPPVGFPPPPF | 6‐5 | 1 | 1‐5 | 42 | No |
| CAIRGSNQPQHF | 10‐3 | 1‐5 | 36 | Yes | |
| CSVQPATYEQYF | 29‐1 | 2‐7 | 36 | No | |
| CSVEDGAGEKLFF | 29‐1 | 1 | 1‐4 | 39 | No |
| CSLMEGQGRFF | 29‐1 | 1 | 2‐1 | 33 | No |
| CSVED | 29‐1 | 2‐7 | 15 | Yes | |
| CSVERGGGGTDTQYF | 29‐1 | 1 | 2‐3 | 45 | No |
| CAIQPGGDRGLDNSPLHF | 10‐3 | 1 | 1‐6 | 54 | No |
| CACRTGPNTGELFF | 19 | 1 | 2‐2 | 42 | Yes |
| CAISAGQRNSPLHF | 10‐3 | 1 | 1‐6 | 42 | No |
| CASLSGLAGGVEQFF | 27 | 2 | 2‐1 | 45 | No |
| CASMASAGYTF | 19 | 1‐2 | 33 | No | |
| CASNGAGYDYEQYF | 19 | 1 | 2‐7 | 42 | No |
| CASRPANTGELFF | 27 | 2‐2 | 39 | No | |
| CASSAGDRPVTGELFF | 6‐6 | 1 | 2‐2 | 48 | Yes |
| CASSAGTAYSNQPQHF | 5‐5 | 1 | 1‐5 | 48 | No |
| CASSAGTTNTGELFF | 12‐3 | 1 | 2‐2 | 45 | No |
| CASSALAGYEQFF | 19 | 2 | 2‐1 | 39 | No |
| CASSEQGQYGYTF | 6‐3 | 1 | 1‐2 | 39 | No |
| CASSIDGTGQRSYGYTF | 19 | 1 | 1‐2 | 51 | No |
| CASSIGQAREKLFF | 19 | 1 | 1‐4 | 42 | No |
| CASSIGQTPGQPQHF | 19 | 1 | 1‐5 | 45 | No |
| CASSIHRDNINALVTGELFF | 19 | 1 | 2‐2 | 60 | No |
| CASSLAGGTGEQFF | 27 | 1 | 2‐1 | 42 | No |
| CASSLDTQGAGYGYTF | 5‐4 | 1 | 1‐2 | 48 | No |
| CASSLMGGDTGELFF | 28 | 1 | 2‐2 | 45 | Yes |
| CASSLQGYNSPLHF | 5‐1 | 1 | 1‐6 | 42 | No |
| CASSLRQPSDTQYF | 27 | 2 | 2‐3 | 42 | Yes |
| CASSLTFHTGEQYF | 11‐1 | 2‐7 | 42 | No | |
| CASSLVQGPNEQFF | 5‐5 | 1 | 2‐1 | 42 | No |
| CASSLYGPSYEQYF | 27 | 2‐7 | 42 | No | |
| CASSMGARHEKLFF | 19 | 1 | 1‐4 | 42 | No |
| CASSPRDREISPLHF | 19 | 1 | 1‐6 | 45 | No |
| CASSQDLQGGANVLTF | 4‐3 | 1 | 2‐6 | 48 | No |
| CASSRPGQGVFGYTF | 12‐3 | 1 | 1‐2 | 45 | No |
| CASSSSGQNTGELFF | 19 | 2 | 2‐2 | 45 | No |
| CASSTDPTYEQYF | 19 | 2‐7 | 39 | No | |
| CASSTELSGPWQPQHF | 19 | 2 | 1‐5 | 48 | No |
| CASSTPGQLTNEKLFF | 19 | 1 | 1‐4 | 48 | No |
| CASSVGGGGISYNEQFF | 19 | 2 | 2‐1 | 51 | Yes |
| CASSWGDRVYDEQYF | 5‐6 | 1 | 2‐7 | 45 | No |
| CASTSTSASTDTQYF | 27 | 2 | 2‐3 | 45 | No |
| CATSRRGYEQYF | 15 | 2 | 2‐7 | 36 | No |
| CSALAGPLEQFF | 29‐1 | 2 | 2‐1 | 36 | No |
| CSARDYSGGLVGGEQFF | 20‐1 | 2 | 2‐1 | 51 | No |
| CSVAQATSEAFF | 29‐1 | 1 | 1‐1 | 36 | No |
| CSVASGRNEQFF | 29‐1 | 2 | 2‐1 | 36 | No |
| CSVEGGGSYEQYF | 29‐1 | 2‐7 | 39 | No | |
| CSVEGPSGDYNEQFF | 29‐1 | 2 | 2‐1 | 45 | No |
| CSVGGERDYLNEQYF | 29‐1 | 2 | 2‐7 | 45 | No |
| CSVGLAGQETQYF | 29‐1 | 2 | 2‐5 | 39 | No |
| CSVGLAGQETQYL | 29‐1 | 2 | 2‐5 | 39 | No |
| CSVHGDMGRADTQYF | 29‐1 | 1 | 2‐3 | 45 | No |
| CSVHSQGRLV | 29‐1 | 1 | 2‐1 | 30 | No |
| CSVRGQGTEAFF | 29‐1 | 1 | 1‐1 | 36 | No |
| CSVSRRDNTDTQYF | 29‐1 | 1 | 2‐3 | 42 | No |
| CSVTEGGYTF | 29‐1 | 1 | 1‐2 | 30 | No |
| CSVVTGTEAFF | 29‐1 | 1 | 1‐1 | 33 | Yes |
Representation of COVID‐19‐associated public TCR sequences in COVID‐19 patients with different disease severity and after recovery
Next, we studied the 68 brain‐derived TCR clonotypes in more depth by analysing the number of hits per repertoire which was higher for immune repertoires from COVID‐19 patients than for pre‐pandemic healthy repertoires (Figure 1c and d). In addition, we explored their representation across subsets with severe disease reflected by treatment on an intensive care unit (ICU) versus mild‐to‐moderate disease (non‐ICU) as well as after recovery. While the brain‐derived clonotypes showed a similar distribution during active infection independent of ICU treatment, their detection was less likely after recovery (Figure 1e). Yet, patients previously exposed to the virus showed a higher representation of these sequences in their repertoires as compared to non‐exposed individuals, 32–53% vs 17% (Figure 1b and e).
Functional dissection of T cells carrying COVID‐19‐associated public TCR sequences
Since SARS‐CoV‐2 specificity of our brain‐derived T cells could not be directly studied, we asked whether stimulation of peripheral T cells from COVID‐19 patients with established sets of SARS‐CoV‐2 peptides (Supplementary tables 3 and 4) results in the expansion of any of the 68 clonotypes as evidence for epitope specificity. Therefore, we used two different approaches (Figure 2a). In approach 1, we aimed for long‐term expansion of reactive T cells. In fact, sequencing the T‐cell repertoires pre‐ and post‐stimulation of COVID‐19 patient HACO‐5 revealed expansion of one brain‐derived clonotype with the TCRbeta sequence CASSLVGNGYTF after stimulation with SARS‐CoV‐2 peptides from the set of nucleoprotein epitopes (Figure 2b). In the second approach, we sorted activated IFNγ‐positive T cells from biobanked pre‐pandemic blood samples as well as fresh PBMCs of vaccinated healthy individuals and biobanked PBMCs from COVID‐19 patients. Overall, we found significant increases of IFNγ+CD3+ T cells after 16‐h stimulation with SARS‐CoV‐2 peptide pools (Figure 2c). Since pre‐pandemic samples had been stored for many years prior to analysis, their background IFNγ+ level was higher than in the groups with pandemic sampling, but even these samples showed induction of IFNγ+CD3+ T cells after stimulation (Figure 2c). Sequencing the TRB repertoire of sorted IFNγ+CD3+ T cells revealed three clonotypes that shared high similarity of the CDR3 beta amino acid sequence with three brain‐derived clonotypes arguing in favor of their SARS‐CoV‐2 specificity (Figure 2c).
Figure 2.

Peptide stimulation of PBMCs from patient with active COVID‐19. (a) Schematic overview of peptide stimulation of PBMCs and immunosequencing. (b) Representative bubble plot of T‐cell repertoire of patient 5 before and after peptide stimulation with SARS‐CoV‐2 N‐protein‐derived peptides. One bubble represents one TCR clonotype, the area size of the bubble corresponding to the clone fraction. (c) Percentage of IFNγ positive CD3+ T cells after incubation with 10% DMSO (negative control) or stimulation with SARS‐CoV‐2‐specific peptides. Statistical test: one‐sided paired t‐test. The line indicates the median. CDR3 amino acid sequence alignment of sorted IFNγ‐positive SARS‐CoV‐2‐specific T‐cell clones that share sequence similarity with COVID‐19 brain‐derived T‐cell clones.
Next, we asked whether the designated SARS‐CoV‐2‐specific TCRs could be assigned to a distinct functional T‐cell subset in patients with acute infection. To this end, we mined a previously published T‐cell single‐cell(sc) RNA/V(D)J sequencing dataset25 consisting of peripheral blood and bronchoalveolar lavage (BAL) fluid samples from 9 patients with COVID‐19 as well as 5 control patients with bacterial pneumonia (BAC) for our sequences. Despite the more limited V(D)J sequencing depth of the scRNA assay, which is below the sequencing depth achievable with bulk DNA‐based TCR sequencing approaches, we identified two clonotypes from COVID‐19 patients with exact CDR3 sequence identity to our brain‐derived clonotypes (TRBV5‐1, TRBJ1‐6 CASSLQGYNSPLHF combined with TRAV14/DV4, TRAJ52 CAIVESTTSYGKLT and TRBV29‐1, TRBJ2‐7 CSVEGGGSYEQYF combined with TRAV8‐6, TRAJ6 CAVKSSGGSYIPTF). Since two sequence hits are insufficient to draw conclusions about the cellular identity of the identified public COVID‐19 clonotypes, we used the GLIPH2 algorithm to identify TCR sequences that potentially share epitope specificity.26 This algorithm currently mirrors a state‐of‐the‐art bioinformatical approach to cluster T‐cell clones based on shared motifs within the high‐probability contact region of the CDR3. For clustering, the 68 brain‐derived sequences were either integrated in the COVID‐19 or – as control – the BAC scRNA TCRbeta dataset. All T‐cell clusters encompassing at least one public brain‐derived TCR sequence were counted (Figure 3a). This analysis identified 39 individual sequences with high paratope similarity to one of the brain‐derived public TCRs in the COVID‐19 dataset while in the BAC dataset only three such sequences could be identified. The 39 clonotypes belonged to 11 different TCR clusters (SGS‐E, R‐GPNTGE, G‐AGQET, G‐AGQET, SLVG‐G, SL‐GYNSP, G‐SGNT, SL‐GGTGE, SLAG‐TGE, SR‐GYE, R‐SNQP, S‐RGYE, Figure 3b and Supplementary table 4). We projected all identified clones onto the UMAP plots of the integrated blood and BAL fluid T‐cell dataset and found that all of these clones mapped to the peripheral CD4+ T cell pool while no hits were found for CD8+ T cells (Figure 3c). Of the 39 COVID‐19‐specific cluster‐derived clonotypes, nine were found in the BAL fluid.
Figure 3.

Attribution of cellular phenotype of brain‐derived clonotypes and TCR specificity groups using single‐cell dataset. (a) Schematic presentation of GLIPH TCR specificity groups formation between clones from single‐cell TCR data25 from patients with COVID‐19 or bacterial pneumonia and brain‐derived TCR clones (n = 11 and n = 1, respectively). (b) Generation probability (as log2) and TRBV gene usage of clones that form common TCR specificity groups with brain‐derived clones. (c) UMAP of CD4+ and CD8+ T single‐cell data from25 with highlighted cells expressing a TCRbeta which is either identical to the brain‐derived clones (yellow colour) or belongs to the TCR specificity groups found in (a and b) (red colour = clone was found in blood cells; dark grey = clone was found in bronchoalveolar lavage [BAL] fluid).
To further investigate the cellular identity of these clones, we separately re‐clustered all CD4+ COVID‐19 cells from the blood and the BAL fluid (Figure 4a). In line with the classification by Zhao et al.25 we identified nine T‐cell populations for blood‐derived and eight for BAL‐derived CD4+ T cells, including Treg (FOXP3), Tr1 (ITGA2, LAG3), Th1 (IFNG), Th17 (RORC, CCR6), CD8+ (CD8A, CD8B) and innate(‐like) (NKG7) T‐cell subsets (Figure 4a and b). While most peripheral CD4+ subpopulations contained at least one cluster‐derived TCR clonotype (Figure 4b), the majority were part of a naïve CD4+ population expressing elevated levels of the activation markers CD69 and CD38 as well as CCR7 and IFNGR2, but encompassing more cells with reduced CD95 expression (Supplementary figure 3).
Figure 4.
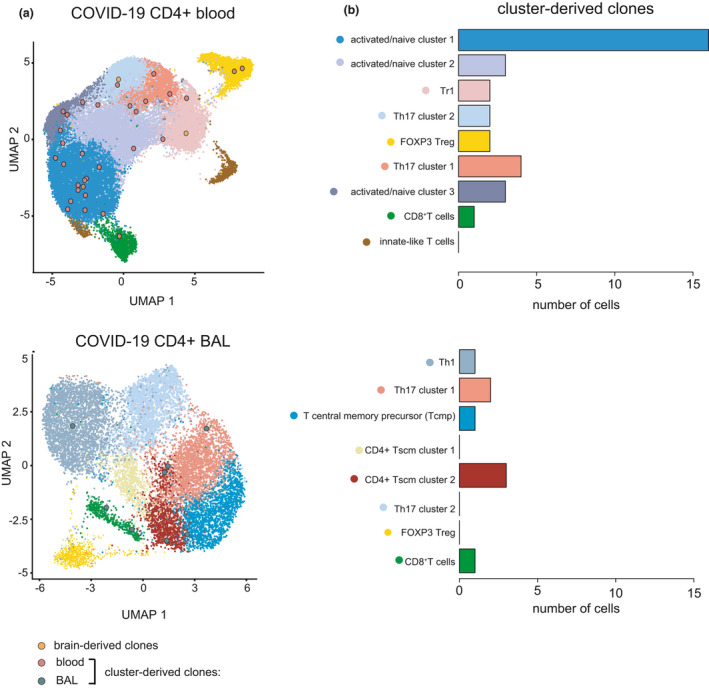
Cellular identity of brain‐/cluster‐derived CD4+ clonotypes from patients with COVID‐19. (a) UMAP of CD4+ T single‐cell data from patients with COVID‐19 from blood or BAL depicting T‐cell subpopulations as well as TCRbeta clones which are either identical to the brain‐derived clones or belong to the TCR specificity groups found in Figure 3a and b. (b) Number of cells per T‐cell subpopulation with sequence hit.
Representation of T cells carrying COVID‐19‐associated public TCR sequences in immune repertoires of individuals not previously exposed to SARS‐CoV‐2
Presuming that our public COVID‐19 TCR clonotypes – if present in a pre‐infection immune repertoire – may protect from severe disease courses, we asked whether risk groups such as aged individuals or cancer patients showed lower representation of these clonotypes in their repertoires (Figure 5a). We compared the representation of the 68 TCR clonotypes in individuals < or ≥ 60 years of age using the 140 healthy immune repertoires described above that were acquired prior to the COVID‐19 pandemic. Indeed, individuals above 60 years of age showed lower numbers of sequence hits (10.5% vs 19.6%) very likely because of age‐dependent repertoire restriction as previously reported27 (Figure 5b and c). Consistent with this, also the number of sequence hits per repertoire was lower in older individuals than in younger ones (Figure 5d).
Figure 5.
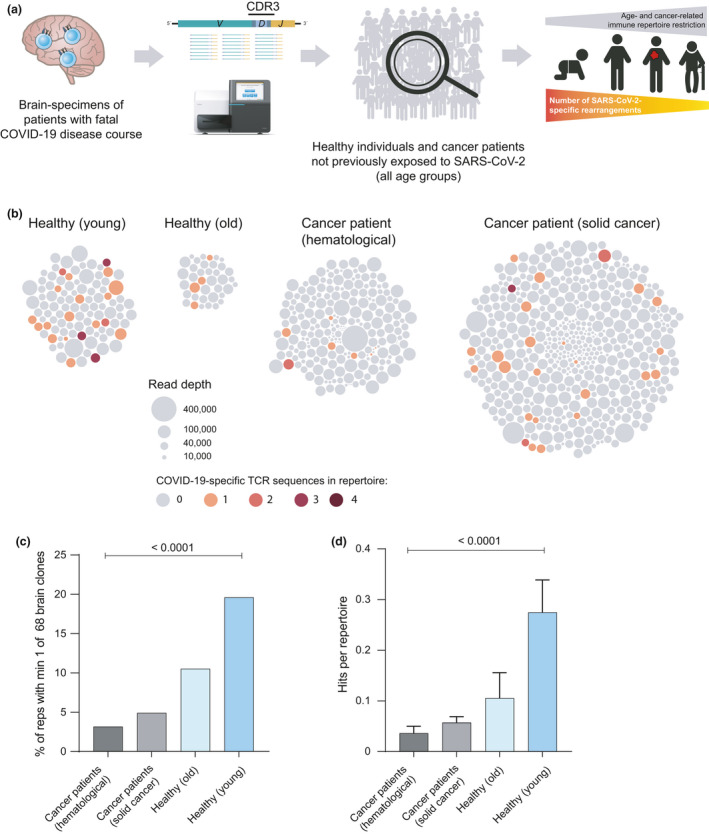
Representation of brain‐derived clonotypes in pre‐pandemic samples of risk groups. (a) Schematic overview of population with increased risk for adverse course of infection. (b) Bubble plots showing number of repertoires, individual repertoire size as well as brain‐derived TCR sequence hits per repertoire for healthy individuals and patients with cancer. (c) Percentage of pre‐pandemic repertoires from healthy individuals and patients with cancer with at least one brain‐derived TCR sequence hit. Healthy individuals are grouped by age, where ‘young’ < 60 years (n = 102) and ‘old’ ≥ 60 years (n = 38). Statistical test: chi‐square. (d) Mean number (+ SEM) of brain‐derived TCR sequence hits per repertoire. Statistical test: ordinary one‐way ANOVA. reps, repertoires.
Since patients with cancer show disease‐associated T‐cell repertoire restriction,27 we reasoned that the potentially protective T‐cell clonotypes may be less frequently found in repertoires from this group. Indeed, peripheral blood immune repertoires of patients with cancer (222 and 510 repertoires of patients with haematological or solid cancer, respectively, together building a sequence resource of > 35 million TCR reads) were less likely (3.2% and 4.9%) to harbour these sequences compared to healthy old and especially young individuals (Figure 5b and c). Also, the numbers of hits per repertoire were much lower in patients with cancer than in the healthy controls (Figure 5d).
Overall, repertoires from unrelated COVID‐19 patients with active disease were most likely to harbour one or more of the brain‐derived, COVID‐19‐associated public TCR clonotypes followed by patients after recovery, healthy young and healthy old individuals. SARS‐CoV‐2 unexposed patients with cancer were least likely to harbour SARS‐CoV‐2 TCRs in their repertoires.
Discussion
Adaptive immunity and especially T‐cell responses have been recognised as crucial for early control and successful clearance of SARS‐CoV‐2 infections.5 However, several important questions remain unanswered including the shape and composition of disease‐associated T‐cell repertoires across patients, as well as the nature and role of pre‐existing T‐cell responses for the course and longevity of COVID‐19.28, 29 In the work presented here, we establish a set of TCR clonotypes with public features derived from brain tissue of deceased patients with COVID‐19 as immunogenetic markers of SARS‐CoV‐2‐reactive T cells. This set outperformed published clone sets encompassing predominantly S‐reactive T cells7, 11, 12, 15 in the identification of COVID‐19‐associated repertoire imprints. Notably, clones from this set were also found in about 20% of pre‐pandemic repertoires of healthy individuals, but with decreasing frequencies in older individuals or patients with cancer. Our data corroborate the notion that certain clonotypes with identical TCRbeta amino acid sequences are relatively common in the general population and might predispose to mild disease courses.7 Although we did not observe an expansion of these clones in longitudinal samples of patients with active disease, they might offer protection to the host by limiting early viral replication, thus providing a time window to mount a protective immune response.30, 31, 32
The hypothesis of a pre‐existing immune response against SARS‐CoV‐2 is mainly based on the observation that healthy individuals contain, especially in their peripheral CD4+ compartment, SARS‐CoV‐2‐reactive T cells that potentially represent memory from previous infections with common cold coronaviruses (CCCoVs) able to mediate heterologous immunity.6, 7, 8, 9, 10, 11, 12, 13, 14, 33 In this line of reasoning, the higher prevalence of these clones in the repertoires of healthy and young individuals may not only rely on higher repertoire diversity and richness in the younger, but also reflect the more intense exposure to CCCoVs in the social environment of people < 60 years of age.
However, this model was recently challenged by the findings of Bacher et al. (2020)12 who showed that CCCoV cross‐reactive memory cells are neglectable for pre‐existing public T‐cell responses against SARS‐CoV‐2. In line with our data, this argues for the possibility that fundamental architectural features of the naïve/pre‐selection immune repertoire34, 35 result in the presence of SARS‐CoV‐2‐associated public clonotypes, which act as important modulators of disease severity and determine outcome in COVID‐19. As a consequence, the proper composition of a unique pre‐infection immune repertoire predisposes to a mild course, while its clonotypic restriction in older individuals or patients with cancer is the mechanistical basis of, or contributes to, the already established risk profiles (e.g. sex or comorbidities) for severe disease courses.36, 37 Interestingly, a similar age‐ and risk‐dependent pattern was recently described for naïve B cell responses.38 Although our set does not comprise identical clonotypes shared by a substantial proportion of patients across studies, we found the TCRbeta CASSLVGNGYTF (paired with TCRalpha CVVLRSGNTGKLIF) and the TCRbeta CASRDRVNEQFF (paired with TCRalpha CALNSADRGSTLGRLYF) in the Bacher et al.12 and Meckiff et al.11 single‐cell datasets, respectively. Of note, the presence and expansion of public clonotypes are not a unique trait of COVID‐19, but a common feature of distinct viral infections including EBV,39 CMV,40, 41 hepatitis C virus42 and influenza.43 As suggested by a rhesus macaque model of primary Simian immunodeficiency virus infection,44 of note, the number of public clonotypes was inversely correlated with viral load pointing towards a protective role of these clonotypes by limiting viral replication.
While these findings argue for a protective role of public T‐cell responses in SARS‐CoV‐2 and other viral infections, they also might have some drawbacks. Numerous reports have associated public responses with autoimmunity in humans and mice, especially after viral infection.45, 46 This also seems to be the case for SARS‐CoV‐2 where it has become increasingly clear, that severe cases of COVID‐19 often exhibit clinical manifestations of organ‐specific or systemic autoimmunity that might persist.47 Whether public clones contribute to de novo autoimmunity in SARS‐CoV‐2 infections, or whether hyperinflammation and cellular damage exacerbate existing autoimmunity, especially in the context of distinct HLA genotypes, needs further investigation in the future.
In summary, we identified a set of public clonotypes that allow detection of COVID‐19 repertoires with higher specificity as published datasets. These clones exhibit a relatively broad representation in unexposed especially young and healthy individuals. Considering that high‐throughput TCR sequencing only captures a very limited proportion of TCR clonotype richness of an individual´s complete TCR repertoire because of limited sampling and sequencing depth, the high prevalence and frequencies of these clones in unexposed repertoires are consistent with recently reported findings.6, 9, 10, 11, 12, 13, 14 Future prospective studies will have to confirm the predictive potential of public TCRs directed against SARS‐CoV‐2 epitopes for disease outcome.
Importantly, reliable profiling of immune repertoires can substantially contribute to guide effective countermeasures during newly emerging viral outbreaks, including ways to quickly analyse immune response patterns on a population‐wide scale. It is also key for development of effective vaccines or other therapeutic approaches, since immunogenetic analyses, as delineated above, can quickly identify the induction of beneficial or detrimental TCR clusters.
Methods
Study approval
The autopsies were performed at the Institute of Legal Medicine of the University Medical Center Hamburg‐Eppendorf, Germany between March and September 2020. Autopsies were allowed according to § 25 of the German Infection Protection Law (IfSchG). The use of human tissue for post mortem studies has been approved by the institutional review board of the independent ethics committee of the Hamburg University (protocol‐no. PV7311). The study complied with the tenets of the Declaration of Helsinki.
Blood collection of COVID‐19 patients was performed under institutional review board approvals number 2020‐039 and 11/17. Blood collection of pre‐pandemic samples was performed under approval of ethics committee of the medical association Hamburg (project number PV4767) and the ethics committee of the medical faculty of Martin‐Luther‐University Halle‐Wittenberg (project number 2014‐75). Written informed consent was received from all participants. The study has been performed in accordance with the Declaration of Helsinki of 1975.
Patients and samples
The brain tissues were derived from five deceased patients with COVID‐19 (3 males, 2 females, age 49–87 years). All deceased patients were screened for SARS‐CoV‐2 virus RNA by throat swab followed by immediate quantitative RT‐PCR analysis prior to autopsy. At autopsy, all brains were fixed in buffered 4% formaldehyde, examined macroscopically and subjected to routine neuropathological examination.
Blood samples from 140 COVID‐19 patients were analysed; 37 thereof previously immunologically analysed and published by our group.18 Moreover, we used pre‐pandemic blood samples of 140 age‐matched healthy donors and 732 samples of patients with cancer for the data mining analyses. The latter included 222 samples from patients with haematological cancer and 510 samples from patients with solid cancers (sample details can be found in Supplementary table 1).
NGS immunosequencing and data analysis
To determine the entirety of the clonal V(D)J rearrangements of peripheral T‐cell receptors (T‐cell repertoire), all acquired blood samples underwent next‐generation sequencing (NGS) of the TRB genetic locus. In brief, genetic loci were amplified together in a multiplex PCR using TRB‐A/B primer pools and up to 500 ng of genomic DNA.48 The primers were purchased from Metabion International AG (Martinsried, Germany). Two consecutive PCRs were performed to generate fragments tagged with Illumina‐compatible adapters for hybridisation to the flow cell and 7 nucleotide barcodes for sample identification. All PCRs were performed using Phusion HS II (Thermo Fisher Scientific Inc., Darmstadt, Germany). After gelelectrophoretic separation, amplicons were purified using the NucleoSpin® Gel and PCR Clean‐up kit (Macherey‐Nagel, Düren, Germany), quantified on the Qubit platform (QIAGEN, Hilden, Germany) and pooled to a final concentration of 4 nM. The quality of the amplicon pools was controlled on an Agilent 2100 Bioanalyzer (Agilent Technologies, Böblingen, Germany) before undergoing NGS on an Illumina MiSeq (paired‐end, 2 × 301‐cycles). Samples were sequenced at an average sequencing depth of 56 000 reads (sequencing details can be found in Supplementary table 1). Annotation of TRB loci rearrangements was computed with the MiXCR framework (3.0.8).49 As reference for sequence alignment, the default MiXCR library was used. Non‐productive reads and sequences with less than 2 read counts were not considered for further analysis. Each unique complementarity‐determining region 3 (CDR3) nucleotide sequence was defined as one clone. Generation probability of CDR3 sequences was computed using OLGA.50 All analyses and data plotting were performed using R version 3.6.3.
T‐cell clonotype search algorithm
The 1267 published clonotypes consist of 344 clonotypes from7 retrieved in January 2021 from VDJdb,16 40 BAL clonotypes from15 retrieved in January 2021 from McPAS TCR,17 530 clonotypes from,11 dataset after 6‐h stimulation and cell count ≥ 10, as well as 353 clonotypes from12 with cell count ≥ 10 (Supplementary table 2).
We searched the respective sets of TCR clonotypes based on exact CDR3 beta amino acid sequence identity in a total of 1012 immune repertoires from different cohorts (pre‐pandemic: healthy donors and patients with haematological or solid cancer and pandemic: patients with active COVID‐19 or after recovery) using R version 3.6.3.
For our multiple sampling approach, we used the R base command sample with parameter replace = FALSE to create 100 sets of 68 sequences derived from either pool of healthy donor peripheral blood TCR sequences or a pool of liver biopsy TCR from previous work.24 Bubble plots were computed using R packages packcircles and ggplot2.
T‐cell stimulation with SARS‐CoV‐2‐specific peptides
Approach 1 – long‐term expansion
15‐mer peptides overlapping by ten amino acids corresponding to the amino acid sequence of the first patient diagnosed in Hamburg of the membrane glycoprotein (M) and nucleocapsid phosphoprotein (N) were synthesised51 (peptides & elephants; Hennigsdorf, Germany) and pooled into 2 pools of 10 peptides (Supplementary table 3). For T‐cell expansion, membrane pool 3 and nucleoprotein pool 3 were used because they have shown the highest antigen‐specific T‐cell response in a previous study (data not published). 2 × 10⁶ frozen PBMCs were divided into 2 wells of a 48‐well plate with 500 µL of R10 medium (RPMI 1640 medium with 10% FCS (Sigma‐Aldrich), 1% HEPES buffer and 1% penicillin–streptomycin). PBMCs from each well were stimulated with either the membrane or the nucleoprotein pool (Supplementary table 3) at a final concentration of 10 μg mL−1 for 10 days. Medium with recombinant IL‐2 (50 U mL−1) was added when necessary.
Approach 2 – intracellular staining and sorting of activated T cells
PBMCs of 10 healthy donors were extracted by Ficoll gradient and 1–2 × 10⁶ cells were incubated in round‐bottom 96‐well plate with 10 μg mL−1 of SARS‐CoV‐2‐specific peptide pools derived from Nelde et al.8 (Supplementary table 4) or PMA (5 μg mL−1) and Ionomycin (1 μM, Sigma‐Aldrich) and a 1:150 dilution of GolgiPlug (containing Brefeldin A, BD) for 12–16 h. Staining was performed using FIX&PERM (Nordic MUbio), APC anti‐human CD3 (1:100, Thermo Fisher), FITC anti‐human IFN‐g (1:200, eBioscience) monoclonal antibodies. All samples were sorted on FACS Aria II (BD) and analysed using FlowJo software v.10 (BD). The gating strategy is shown in Supplementary figure 1.
GLIPH (grouping of lymphocyte interaction by paratope hotspots)
The GLIPH2 algorithm26 identifies groups of TCRs that have a high probability of sharing antigen specificity. It clusters TCR clonotypes based on CDR3 sequence similarity according to local motifs (motifs of 2–4 amino acids within high‐probability contact region of CDR3) or global similarity (2–4 amino acid differences between two sequences). As input, we used all 68 brain‐derived clonotypes together with 49 755 or 24 696 clonotypes from patients with COVID‐19 infection or bacterial pneumonia, respectively, derived from25 to perform GLIPH2 with following parameters: reference version 1.0, reference subset CD4+ and CD8+ and all_aa_interchangeable: yes.
Single cell analysis, clustering and visualisation
For data analysis and clustering of single‐cell data, we used R package seurat (v. 3.2.0), starting with the merged seurat object from previous work25 comprising only CD3‐positive cells from 9 patients with SARS‐CoV‐2 infection and 5 patients with bacterial pneumonia. Clones were highlighted and plotted into the UMAP using seurat function DimPlot with cells. For further analyses, we subsetted CD4+ cells deriving from SARS‐CoV‐2 patients’ blood and BAL fluid. These two sets were independently reintegrated using function FindIntegrationAnchors and IntegrateData with default parameters. After log‐normalisation and scaling, we estimated the dimensionality of the dataset with a principal components analysis (PCA) and elbow plot over the variable features. The majority of robust signals was captured in the first 20 principal components. To cluster the cells, we used FindNeighbors to construct a KNN graph based on Euclidean distance using the dimensions previously defined. Using FindClusters cells were grouped together to graph based clusters. For visualisation, we used UMAP as dimension reduction plot. Clusters were defined according to Zhao et al.25 and Ciucci et al.52 (Supplementary figure 2).
To colour single genes and their expression value in cells, we used function FeaturePlot. We identified differentially expressed genes between all clusters with FindAllMarkers function and calculated the respective mean expression per cluster with AverageExpression. Then, we plotted the expression of the top10 genes per cluster with R package pheatmap. Distribution of the mapped clones over clusters was visualised with a bar plot.
Statistical analyses
We used t‐tests (unpaired two‐sided or paired one‐sided) to test for statistical significance between two groups and ordinary one‐way ANOVA or the chi‐square test to compare more than two groups.
Conflict of interest
The authors declare no conflict of interest.
Author contributions
Donjete Simnica contributed to conceptualisation; investigation; methodology; resources; visualisation; writing – original draft; and writing – review and editing. Christoph Schultheiß contributed to conceptualisation; investigation; methodology; resources; writing – original draft; and writing – review and editing. Malte Mohme contributed to conceptualisation; investigation; resources; visualisation; writing – original draft; and writing – review and editing. Lisa Paschold contributed to conceptualisation; investigation; methodology; and writing – review and editing. Edith Willscher contributed to data curation; methodology; software; and writing – review and editing. Antonia Fitzek contributed to resources and writing – review and editing. Klaus Püschel contributed to resources and writing – review and editing. Jacob Matschke contributed to resources and writing – review and editing. Sandra Ciesek contributed to resources; and writing – review and editing. Daniel G Sedding contributed to resources and writing – review & editing. Yu Zhao contributed to data curation; investigation; software; and writing – review and editing. Nicola Gagliani contributed to investigation and writing – review and editing. Yacine Maringer contributed to methodology and resources. Juliane S Walz contributed to methodology and resources. Janna Heide contributed investigation; methodology; and writing – review and editing. Julian Schulze zur Wiesch conteibuted to investigation and writing – review and editing. Mascha Binder contributed to conceptualisation; funding acquisition; investigation; resources; writing – original draft; and writing– – review and editing.
Data availability statement
COVID‐19 patients’ repertoire data are available from the iReceptor Public Archive (IPA) as part of the AIRR Data Commons using the iReceptor Gateway (gateway.ireceptor.org; iReceptor Study ID IR‐Binder‐000001). Moreover, raw fastq sequencing files are deposited in the European Nucleotide Archive (ENA, deposition number PRJEB38339).
Supporting information
Supplementary figures 1‐4
Supplementary tables 1‐5
Acknowledgments
We thank the following investigators and advisors for contributing patients and samples, technical assistance, supporting laboratory facilities, biobanking, ethical and other input: Jochen Dutzmann, Stephan Eisenmann, Katrin Hoffmann, Kerstin Körber‐Fehrl, Sebastian Nuding, Marta Siedlecki and Christoph Wosiek. We also thank Dr Alexander Navarrete‐Santos, Annika Weißenborn and Dr Dagmar Riemann of the cell sorting core facility at the University Hospital Halle (Saale) for performing the sorting. Moreover, we thank all patients and donors after recovery from COVID‐19 for donating their blood for this project. This project was partially funded by the CRC 841 of the German Research Foundation (to MB) as well as by the Martin‐Luther‐University Halle (Saale).
References
- 1.Zhou P, Yang X‐L, Wang X‐Get al. A pneumonia outbreak associated with a new coronavirus of probable bat origin. Nature 2020; 579: 270–273. [DOI] [PMC free article] [PubMed] [Google Scholar]
- 2.Wu F, Wang A, Liu Met al. Neutralizing antibody responses to SARS‐CoV‐2 in a COVID‐19 recovered patient cohort and their implications. medRxiv2020. 10.1101/2020.1103.1130.20047365. [DOI]
- 3.Puelles VG, Lutgehetmann M, Lindenmeyer MTet al. Multiorgan and renal tropism of SARS‐CoV‐2. N Engl J Med 2020; 383: 590–592. [DOI] [PMC free article] [PubMed] [Google Scholar]
- 4.Liu J, Li Y, Liu Qet al. SARS‐CoV‐2 cell tropism and multiorgan infection. Cell Discov 2021; 7: 17. [DOI] [PMC free article] [PubMed] [Google Scholar]
- 5.Sette A, Crotty S. Adaptive immunity to SARS‐CoV‐2 and COVID‐19. Cell 2021; 184: 861–880. [DOI] [PMC free article] [PubMed] [Google Scholar]
- 6.Weiskopf D, Schmitz KS, Raadsen MPet al. Phenotype and kinetics of SARS‐CoV‐2–specific T cells in COVID‐19 patients with acute respiratory distress syndrome. Science Immunology 2020; 5: eabd2071. [DOI] [PMC free article] [PubMed] [Google Scholar]
- 7.Shomuradova AS, Vagida MS, Sheetikov SAet al. SARS‐CoV‐2 epitopes are recognized by a public and diverse repertoire of human T cell receptors. Immunity 2020; 53: 1245–1257 e1245. [DOI] [PMC free article] [PubMed] [Google Scholar]
- 8.Nelde A, Bilich T, Heitmann JSet al. SARS‐CoV‐2‐derived peptides define heterologous and COVID‐19‐induced T cell recognition. Nat Immunol 2021; 22: 74–85. [DOI] [PubMed] [Google Scholar]
- 9.Grifoni A, Weiskopf D, Ramirez SIet al. Targets of T cell responses to SARS‐CoV‐2 coronavirus in humans with COVID‐19 disease and unexposed individuals. Cell 2020; 181: 1489–1501. [DOI] [PMC free article] [PubMed] [Google Scholar]
- 10.Mateus J, Grifoni A, Tarke Aet al. Selective and cross‐reactive SARS‐CoV‐2 T cell epitopes in unexposed humans. Science 2020; 370: 89–94. [DOI] [PMC free article] [PubMed] [Google Scholar]
- 11.Meckiff BJ, Ramirez‐Suastegui C, Fajardo Vet al. Imbalance of regulatory and cytotoxic SARS‐CoV‐2‐reactive CD4+ T cells in COVID‐19. Cell 2020; 183: 1340–1353 e1316. [DOI] [PMC free article] [PubMed] [Google Scholar]
- 12.Bacher P, Rosati E, Esser Det al. Low‐avidity CD4+ T cell responses to SARS‐CoV‐2 in unexposed individuals and humans with severe COVID‐19. Immunity 2020; 53: 1258–1271 e1255. [DOI] [PMC free article] [PubMed] [Google Scholar]
- 13.Braun J, Loyal L, Frentsch Met al. SARS‐CoV‐2‐reactive T cells in healthy donors and patients with COVID‐19. Nature 2020: 587(7833): 270–274. [DOI] [PubMed] [Google Scholar]
- 14.Le Bert N, Tan AT, Kunasegaran Ket al. SARS‐CoV‐2‐specific T cell immunity in cases of COVID‐19 and SARS, and uninfected controls. Nature 2020; 584(7821): 457–462. [DOI] [PubMed] [Google Scholar]
- 15.Liao M, Liu Y, Yuan Jet al. Single‐cell landscape of bronchoalveolar immune cells in patients with COVID‐19. Nat Med 2020; 26: 842–844. [DOI] [PubMed] [Google Scholar]
- 16.Bagaev DV, Vroomans RMA, Samir Jet al. VDJdb in 2019: database extension, new analysis infrastructure and a T‐cell receptor motif compendium. Nucleic Acids Res 2020; 48: D1057–D1062. [DOI] [PMC free article] [PubMed] [Google Scholar]
- 17.Tickotsky N, Sagiv T, Prilusky J, Shifrut E, Friedman N. McPAS‐TCR: a manually curated catalogue of pathology‐associated T cell receptor sequences. Bioinformatics 2017; 33: 2924–2929. [DOI] [PubMed] [Google Scholar]
- 18.Schultheiss C, Paschold L, Simnica Det al. Next‐generation sequencing of T and B cell receptor repertoires from COVID‐19 patients showed signatures associated with severity of disease. Immunity 2020; 53(2): 442–455. [DOI] [PMC free article] [PubMed] [Google Scholar]
- 19.Ellwardt E, Walsh JT, Kipnis J, Zipp F. Understanding the role of T cells in CNS homeostasis. Trends Immunol 2016; 37: 154–165. [DOI] [PubMed] [Google Scholar]
- 20.Song E, Zhang C, Israelow Bet al. Neuroinvasion of SARS‐CoV‐2 in human and mouse brain. J Exp Med 2021; 218: e20202135. [DOI] [PMC free article] [PubMed] [Google Scholar]
- 21.Matschke J, Lutgehetmann M, Hagel Cet al. Neuropathology of patients with COVID‐19 in Germany: a post‐mortem case series. Lancet Neurol 2020; 19: 919–929. [DOI] [PMC free article] [PubMed] [Google Scholar]
- 22.Schwabenland M, Salie H, Tanevski Jet al. Deep spatial profiling of human COVID‐19 brains reveals neuroinflammation with distinct microanatomical microglia‐T‐cell interactions. Immunity 2021; 54: 1594–1610 e1511. [DOI] [PMC free article] [PubMed] [Google Scholar]
- 23.Yan CH, Faraji F, Prajapati DP, Ostrander BT, DeConde AS. Self‐reported olfactory loss associates with outpatient clinical course in COVID‐19. Int Forum Allergy Rhinol 2020; 10: 821–831. [DOI] [PMC free article] [PubMed] [Google Scholar]
- 24.Schultheiss C, Simnica D, Willscher Eet al. Next‐generation immunosequencing reveals pathological T cell architecture in autoimmune hepatitis. Hepatology 2020; 73: 1436–1448. [DOI] [PubMed] [Google Scholar]
- 25.Zhao Y, Kilian C, Turner JEet al. Clonal expansion and activation of tissue‐resident memory‐like Th17 cells expressing GM‐CSF in the lungs of severe COVID‐19 patients. Sci Immunol 2021; 6: eabf6692. [DOI] [PMC free article] [PubMed] [Google Scholar]
- 26.Huang H, Wang C, Rubelt F, Scriba TJ, Davis MM. Analyzing the Mycobacterium tuberculosis immune response by T‐cell receptor clustering with GLIPH2 and genome‐wide antigen screening. Nat Biotechnol 2020; 38: 1194–1202. [DOI] [PMC free article] [PubMed] [Google Scholar]
- 27.Simnica D, Akyüz N, Schliffke Set al. T cell receptor next‐generation sequencing reveals cancer‐associated repertoire metrics and reconstitution after chemotherapy in patients with hematological and solid tumors. OncoImmunology 2019; 8: 1–11. [DOI] [PMC free article] [PubMed] [Google Scholar]
- 28.Karlsson AC, Humbert M, Buggert M. The known unknowns of T cell immunity to COVID‐19. Sci Immunol 2020; 5: eabe8063. [DOI] [PubMed] [Google Scholar]
- 29.Gutierrez L, Beckford J, Alachkar H. Deciphering the TCR repertoire to solve the COVID‐19 mystery. Trends Pharmacol Sci 2020; 41: 518–530. [DOI] [PMC free article] [PubMed] [Google Scholar]
- 30.Lucas M, Karrer U, Lucas A, Klenerman P. Viral escape mechanisms–escapology taught by viruses. Int J Exp Pathol 2001; 82: 269–286. [DOI] [PMC free article] [PubMed] [Google Scholar]
- 31.Fajnzylber J, Regan J, Coxen Ket al. SARS‐CoV‐2 viral load is associated with increased disease severity and mortality. Nat Commun 2020; 11: 5493. [DOI] [PMC free article] [PubMed] [Google Scholar]
- 32.Korva M, Saksida A, Kejzar N, Schmaljohn C, Avsic‐Zupanc T. Viral load and immune response dynamics in patients with haemorrhagic fever with renal syndrome. Clin Microbiol Infect 2013; 19: E358–366. [DOI] [PubMed] [Google Scholar]
- 33.Minervina AA, Komech EA, Titov Aet al. Longitudinal high‐throughput TCR repertoire profiling reveals the dynamics of T‐cell memory formation after mild COVID‐19 infection. Elife 2021; 10: e63502. [DOI] [PMC free article] [PubMed] [Google Scholar]
- 34.Thomas PG, Crawford JC. Selected before selection: A case for inherent antigen bias in the T cell receptor repertoire. Curr Opin Syst Biol 2019; 18: 36–43. [DOI] [PMC free article] [PubMed] [Google Scholar]
- 35.Rubelt F, Bolen CR, McGuire HMet al. Individual heritable differences result in unique cell lymphocyte receptor repertoires of naive and antigen‐experienced cells. Nat Commun 2016; 7: 11112. [DOI] [PMC free article] [PubMed] [Google Scholar]
- 36.Fadl N, Ali E, Salem TZ. COVID‐19: risk factors associated with infectivity and severity. Scand J Immunol 2021; 93: e13039. [DOI] [PMC free article] [PubMed] [Google Scholar]
- 37.Bunders MJ, Altfeld M. Implications of sex differences in immunity for SARS‐CoV‐2 pathogenesis and design of therapeutic interventions. Immunity 2020; 53: 487–495. [DOI] [PMC free article] [PubMed] [Google Scholar]
- 38.Paschold L, Simnica D, Willscher Eet al. SARS‐CoV‐2‐specific antibody rearrangements in prepandemic immune repertoires of risk cohorts and patients with COVID‐19. J Clin Invest 2021; 131: e142966. [DOI] [PMC free article] [PubMed] [Google Scholar]
- 39.Gil A, Kamga L, Chirravuri‐Venkata Ret al. Epstein‐Barr virus epitope‐major histocompatibility complex interaction combined with convergent recombination drives selection of diverse T cell receptor α and β repertoires. MBio 2020; 11: e00250–e320. [DOI] [PMC free article] [PubMed] [Google Scholar]
- 40.Trautmann L, Rimbert M, Echasserieau Ket al. Selection of T cell clones expressing high‐affinity public TCRs within Human cytomegalovirus‐specific CD8 T cell responses. J Immunol 2005; 175: 6123–6132. [DOI] [PubMed] [Google Scholar]
- 41.Chen G, Yang X, Ko Aet al. Sequence and structural analyses reveal distinct and highly diverse human CD8+ TCR repertoires to immunodominant viral antigens. Cell Rep 2017; 19: 569–583. [DOI] [PMC free article] [PubMed] [Google Scholar]
- 42.Miles JJ, Thammanichanond D, Moneer Set al. Antigen‐driven patterns of TCR bias are shared across diverse outcomes of human hepatitis C virus infection. J Immunol 2011; 186: 901–912. [DOI] [PubMed] [Google Scholar]
- 43.Song I, Gil A, Mishra R, Ghersi D, Selin LK, Stern LJ. Broad TCR repertoire and diverse structural solutions for recognition of an immunodominant CD8+ T cell epitope. Nat Struct Mol Biol 2017; 24: 395–406. [DOI] [PMC free article] [PubMed] [Google Scholar]
- 44.Price DA, Asher TE, Wilson NAet al. Public clonotype usage identifies protective Gag‐specific CD8+ T cell responses in SIV infection. J Exp Med 2009; 206: 923–936. [DOI] [PMC free article] [PubMed] [Google Scholar]
- 45.Li H, Ye C, Ji G, Han J. Determinants of public T cell responses. Cell Res 2012; 22: 33–42. [DOI] [PMC free article] [PubMed] [Google Scholar]
- 46.Madi A, Shifrut E, Reich‐Zeliger Set al. T‐cell receptor repertoires share a restricted set of public and abundant CDR3 sequences that are associated with self‐related immunity. Genome Res 2014; 24: 1603–1612. [DOI] [PMC free article] [PubMed] [Google Scholar]
- 47.Liu Y, Sawalha AH, Lu Q. COVID‐19 and autoimmune diseases. Curr Opin Rheumatol 2021; 33: 155–162. [DOI] [PMC free article] [PubMed] [Google Scholar]
- 48.van Dongen JJM, Langerak AW, Brüggemann Met al. Design and standardization of PCR primers and protocols for detection of clonal immunoglobulin and T‐cell receptor gene recombinations in suspect lymphoproliferations: Report of the BIOMED‐2 Concerted Action BMH4‐CT98‐3936. Leukemia 2003; 17: 2257–2317. [DOI] [PubMed] [Google Scholar]
- 49.Bolotin DA, Poslavsky S, Mitrophanov Iet al. MiXCR: software for comprehensive adaptive immunity profiling. Nat Methods 2015; 12: 380–381. [DOI] [PubMed] [Google Scholar]
- 50.Sethna Z, Elhanati Y, Callan CG, Walczak AM, Mora T. OLGA: fast computation of generation probabilities of B‐ and T‐cell receptor amino acid sequences and motifs. Bioinformatics 2019; 35: 2974–2981. [DOI] [PMC free article] [PubMed] [Google Scholar]
- 51.Pfefferle S, Huang J, Norz Det al. Complete genome sequence of a SARS‐CoV‐2 strain isolated in Northern Germany. Microbiol Resour Announc 2020; 9: e00520–e620. [DOI] [PMC free article] [PubMed] [Google Scholar]
- 52.Ciucci T, Vacchio MS, Gao Yet al. The emergence and functional fitness of memory CD4+ T cells require the transcription factor Thpok. Immunity 2019; 50: 91–105 e104. [DOI] [PMC free article] [PubMed] [Google Scholar]
Associated Data
This section collects any data citations, data availability statements, or supplementary materials included in this article.
Supplementary Materials
Supplementary figures 1‐4
Supplementary tables 1‐5
Data Availability Statement
COVID‐19 patients’ repertoire data are available from the iReceptor Public Archive (IPA) as part of the AIRR Data Commons using the iReceptor Gateway (gateway.ireceptor.org; iReceptor Study ID IR‐Binder‐000001). Moreover, raw fastq sequencing files are deposited in the European Nucleotide Archive (ENA, deposition number PRJEB38339).